INFOGRAPHICS: August 2023 TRREB Toronto Market Reports

GTA REALTORS® Release August Stats
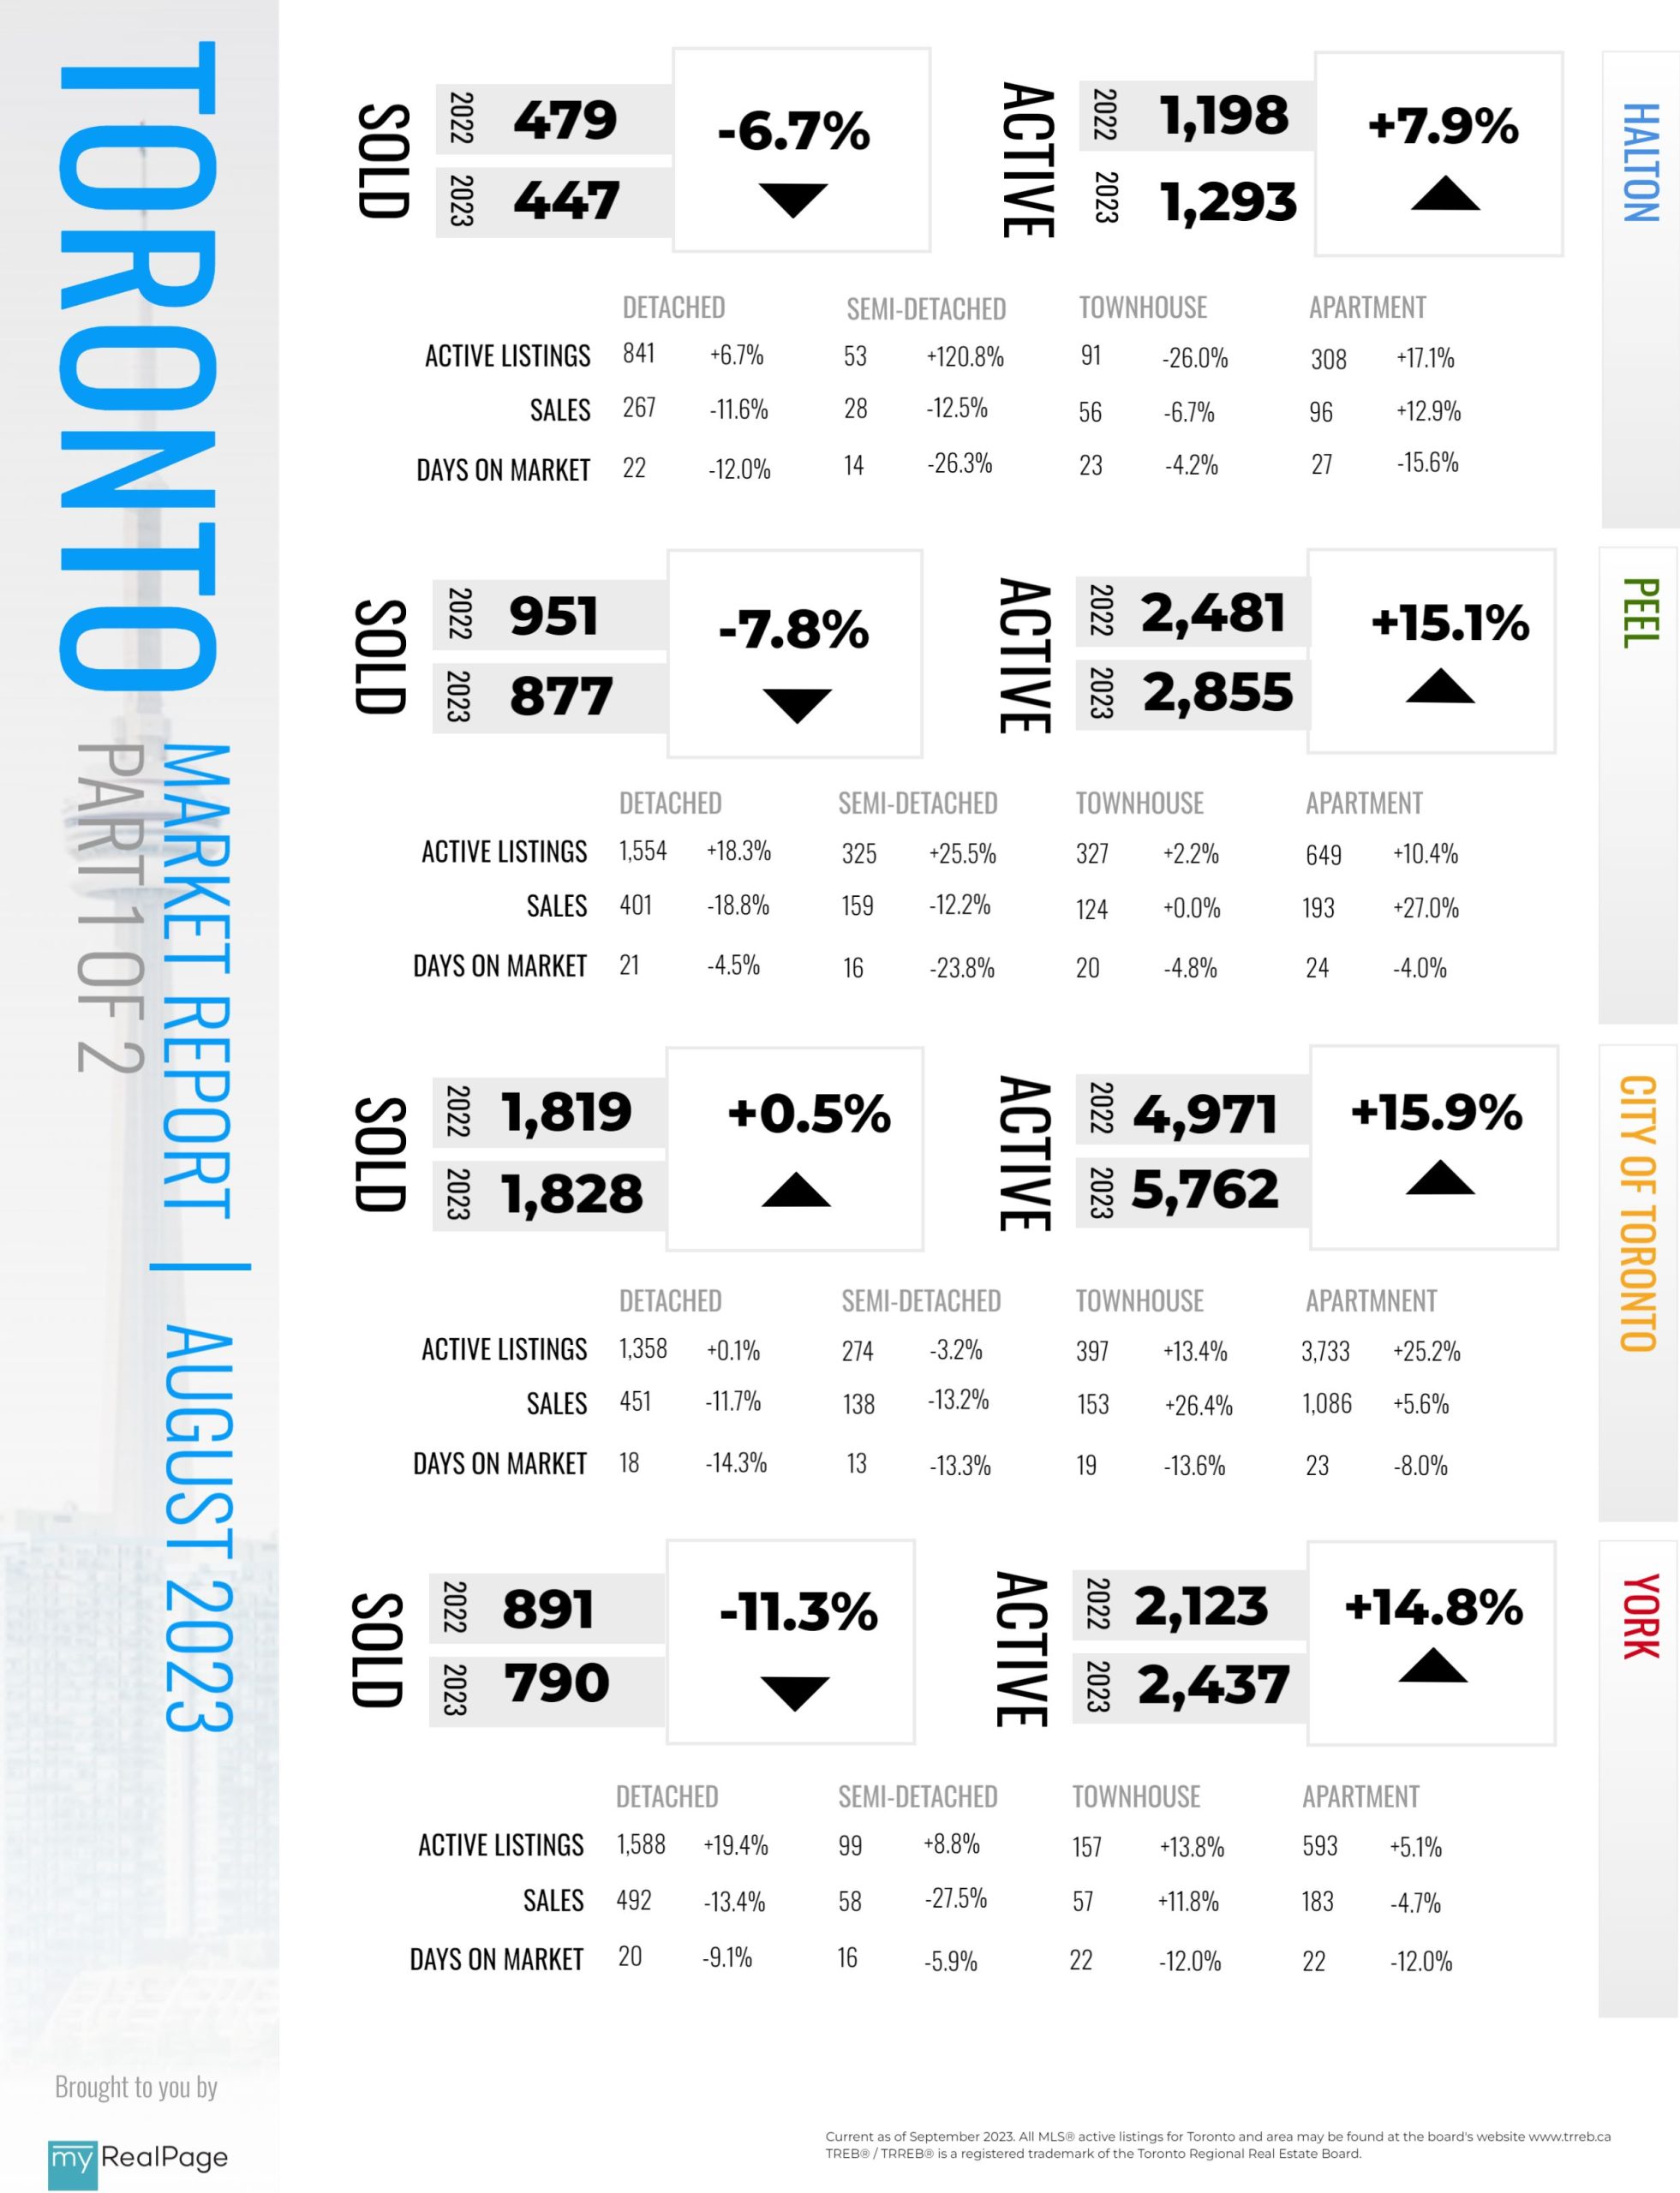
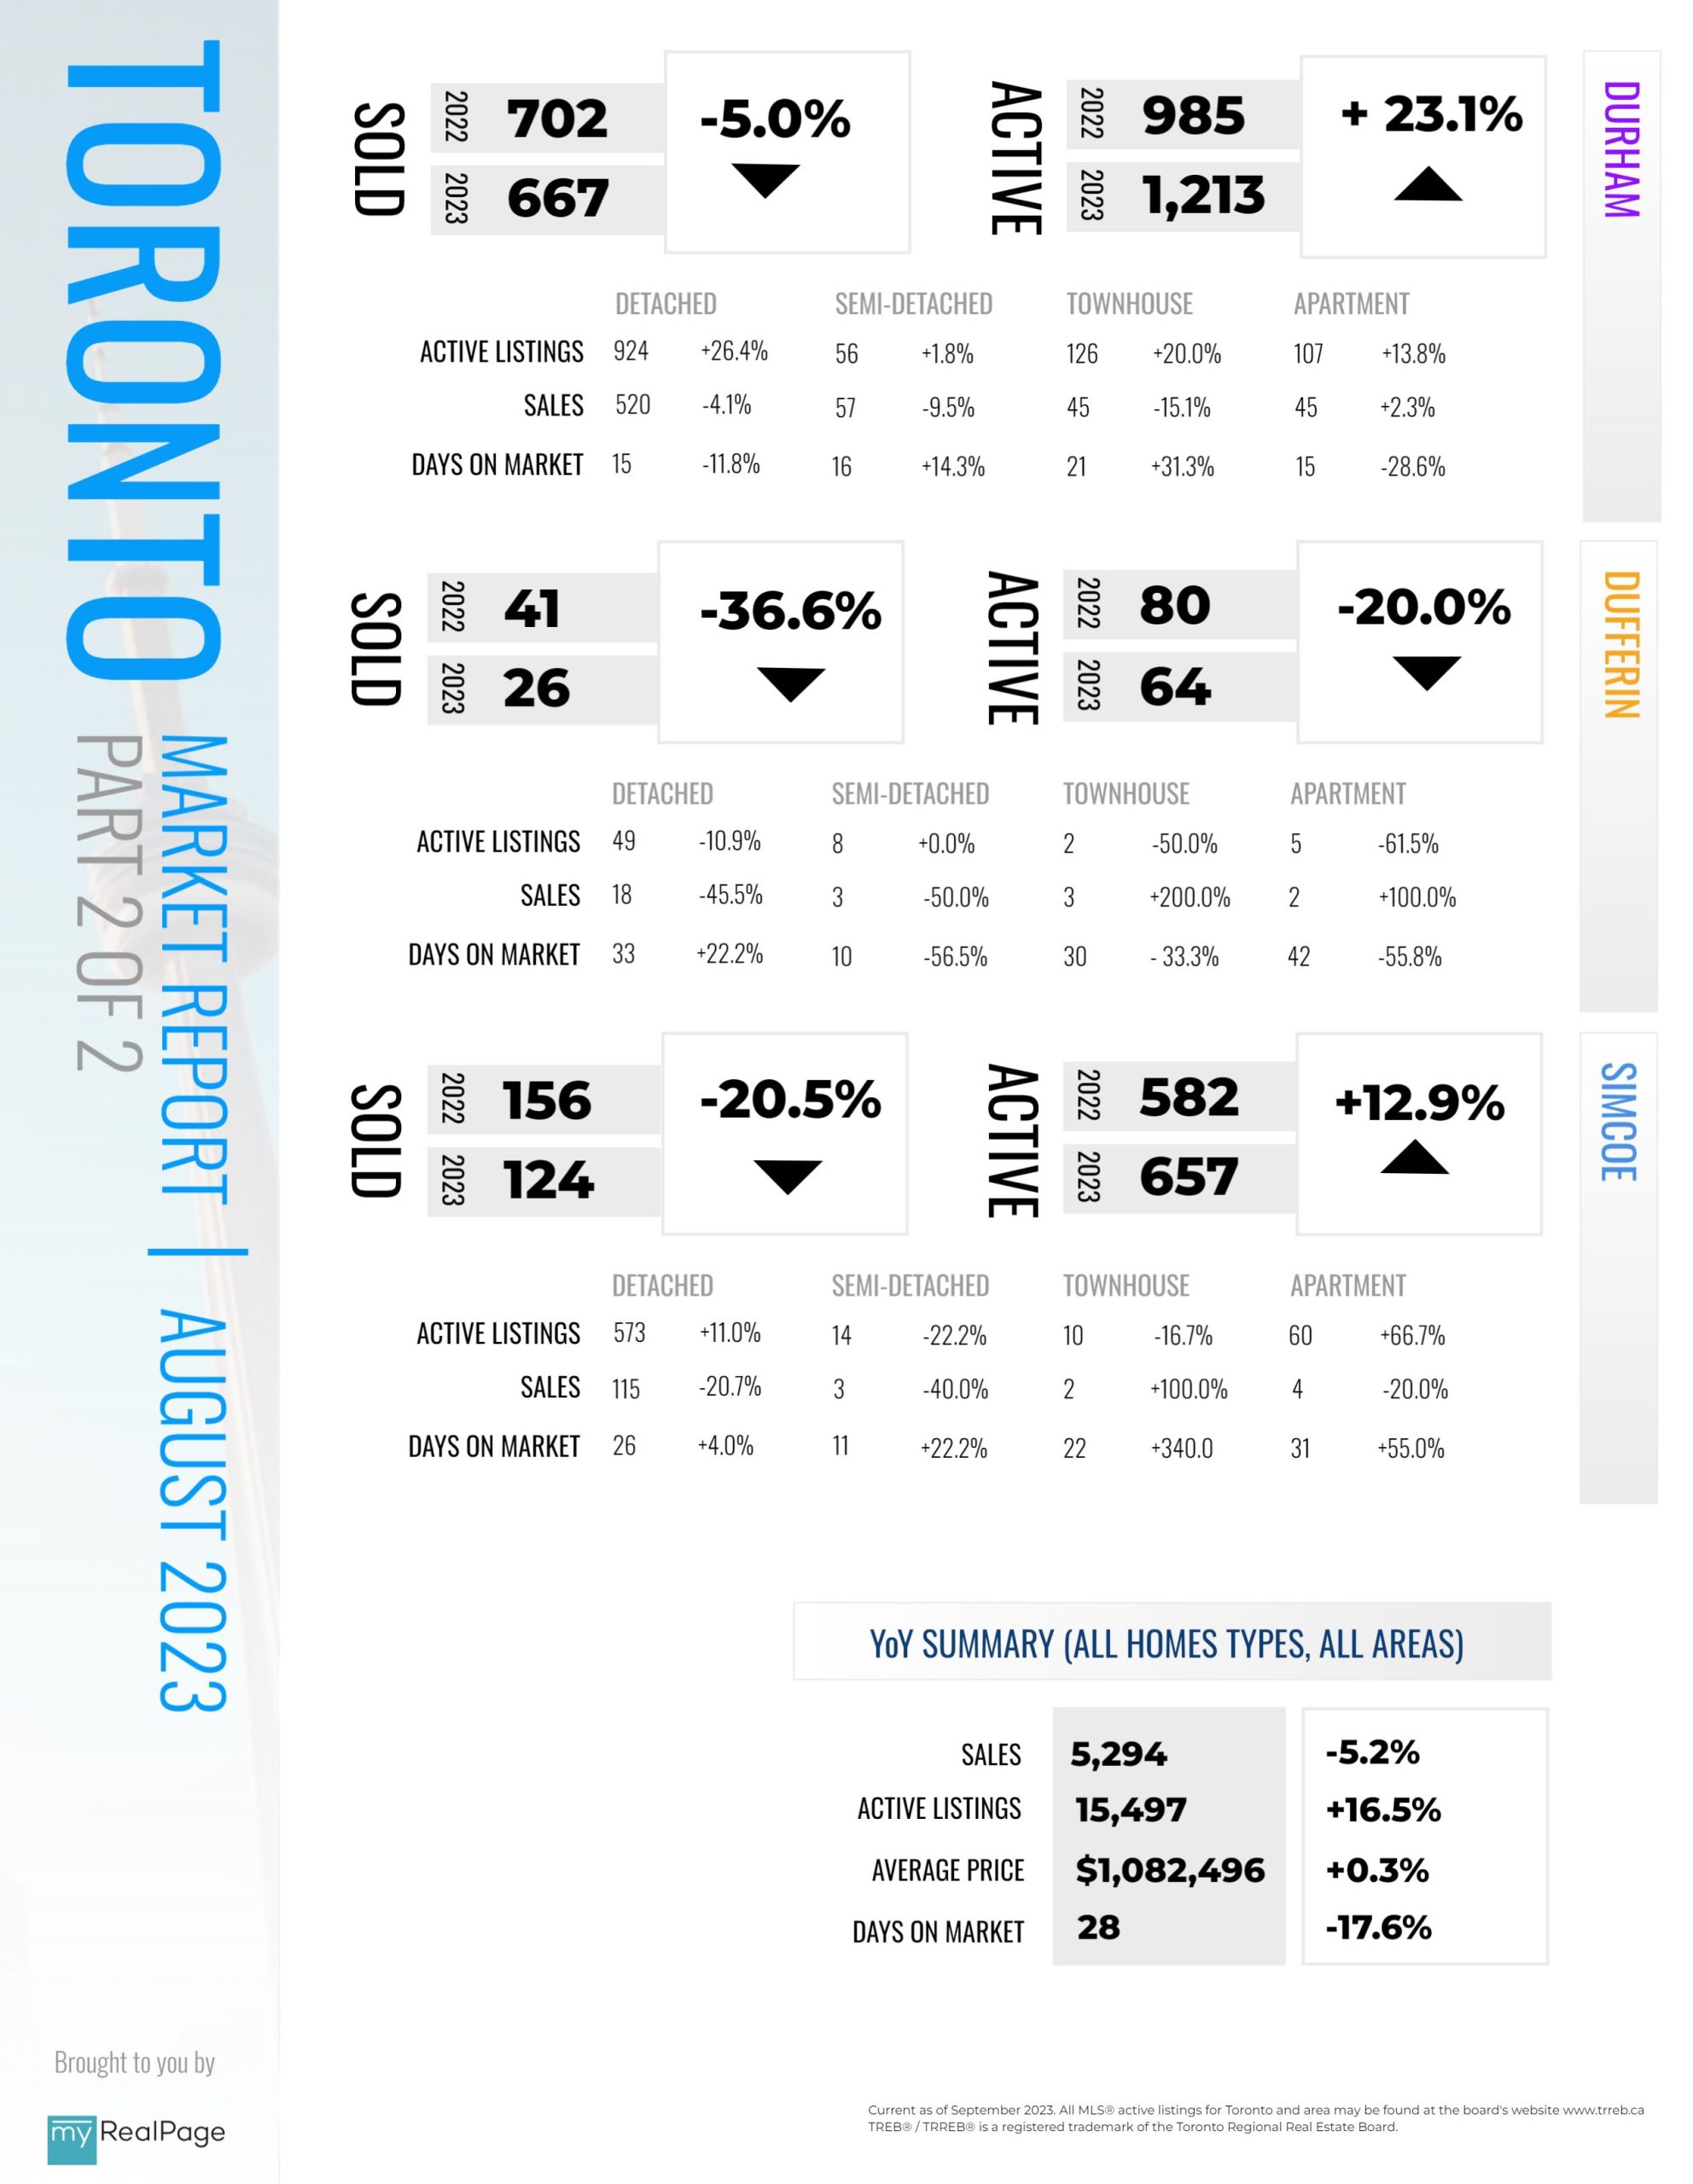
Higher borrowing costs, continued uncertainty about the economy and Bank of Canada decision making, and the constrained supply of listings resulted in fewer home sales in August 2023 compared to August 2022. The average selling price remained virtually unchanged over the same period. On a seasonally adjusted monthly basis, sales and average price edged lower.
“Looking forward, we know there will be solid demand for housing – both ownership and rental – in the Greater Toronto Area and broader Greater Golden Horseshoe. Record immigration levels alone will assure this. In the short term, we will likely continue to see some volatility in terms of sales and home prices, as buyers and sellers wait for more certainty on the direction of borrowing costs and the overall economy,” said TRREB President Paul Baron.
Greater Toronto Area REALTORS® reported 5,294 sales in August 2023 – down by 5.2 per cent compared to August 2022. New listings were up by 16.2 per cent year-over-over, providing some relief on the supply front, but year-to-date listings are still down substantially compared to the same period last year. Seasonally adjusted sales were down slightly by one per cent month-over-month compared to July 2023, while new listings were up slightly by 1.3 per cent compared to July.
“More balanced market conditions this summer compared to the tighter spring market resulted in selling prices hovering at last year’s levels and dipping slightly compared to July. As interest rates continued to increase in May, after a pause in the winter and early spring, many buyers have had to adjust their offers in order to qualify for higher monthly payments. Not all sellers have chosen to take lower than expected selling prices, resulting in fewer sales,” said TRREB Chief Market Analyst Jason Mercer.
Read the full report on TRREB website!
The following data is a comparison between August 2023 and August 2022 numbers, and is current as of September 2023. For last month’s numbers, check out our previous infographic!
Or follow this link for all our TREB / TRREB Infographics!
Download Printable Version – August 2023 TRREB, Toronto Market Report Part 1
Download Printable Version – August 2023 TRREB, Toronto Market Report Part 2
Last Updated on November 28, 2023 by myRealPage
