INFOGRAPHICS: June 2024 CREB City And Region Market Reports

June sales decline amid supply challenges and rising prices
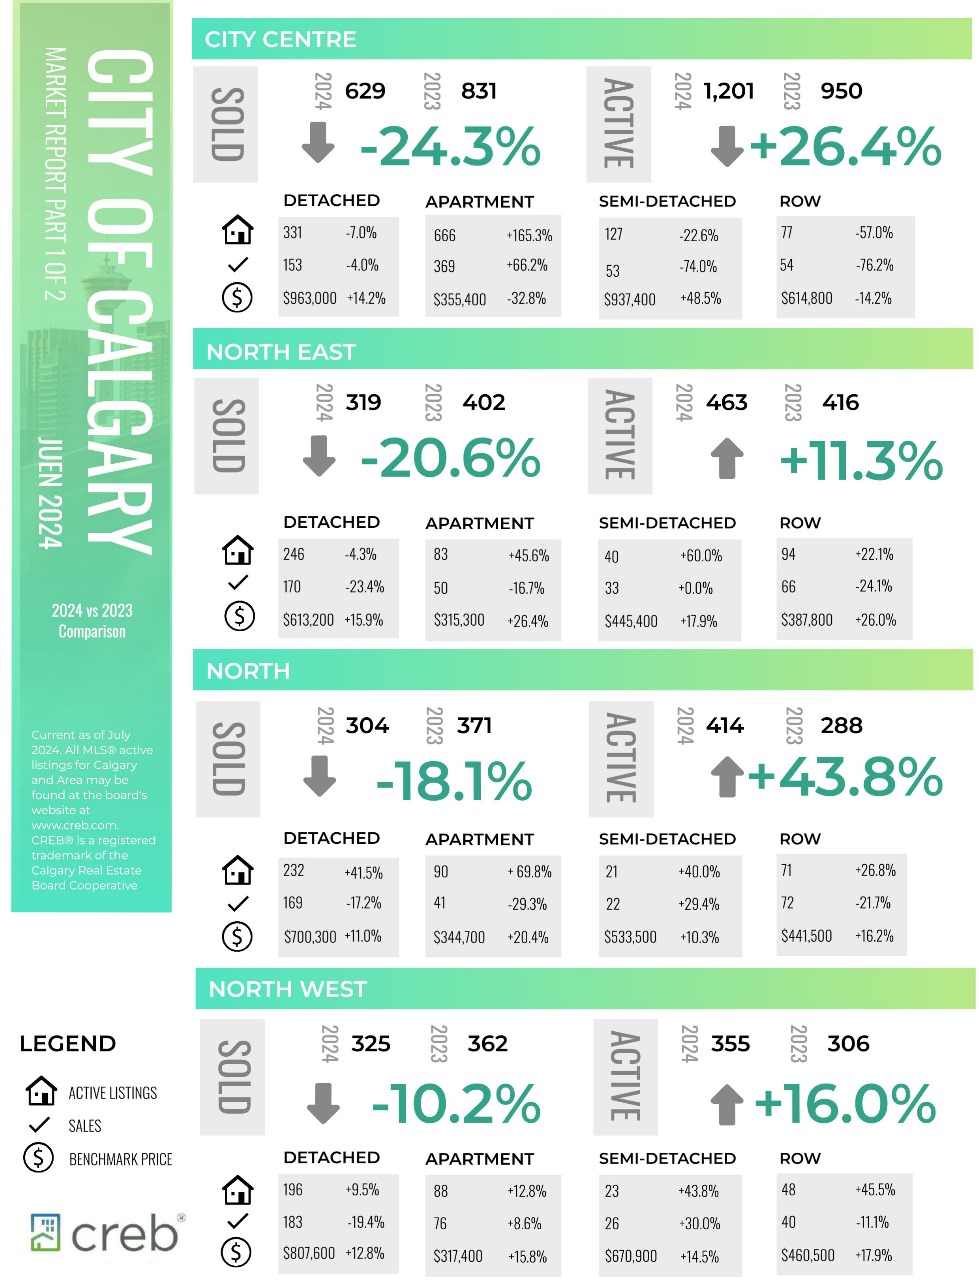
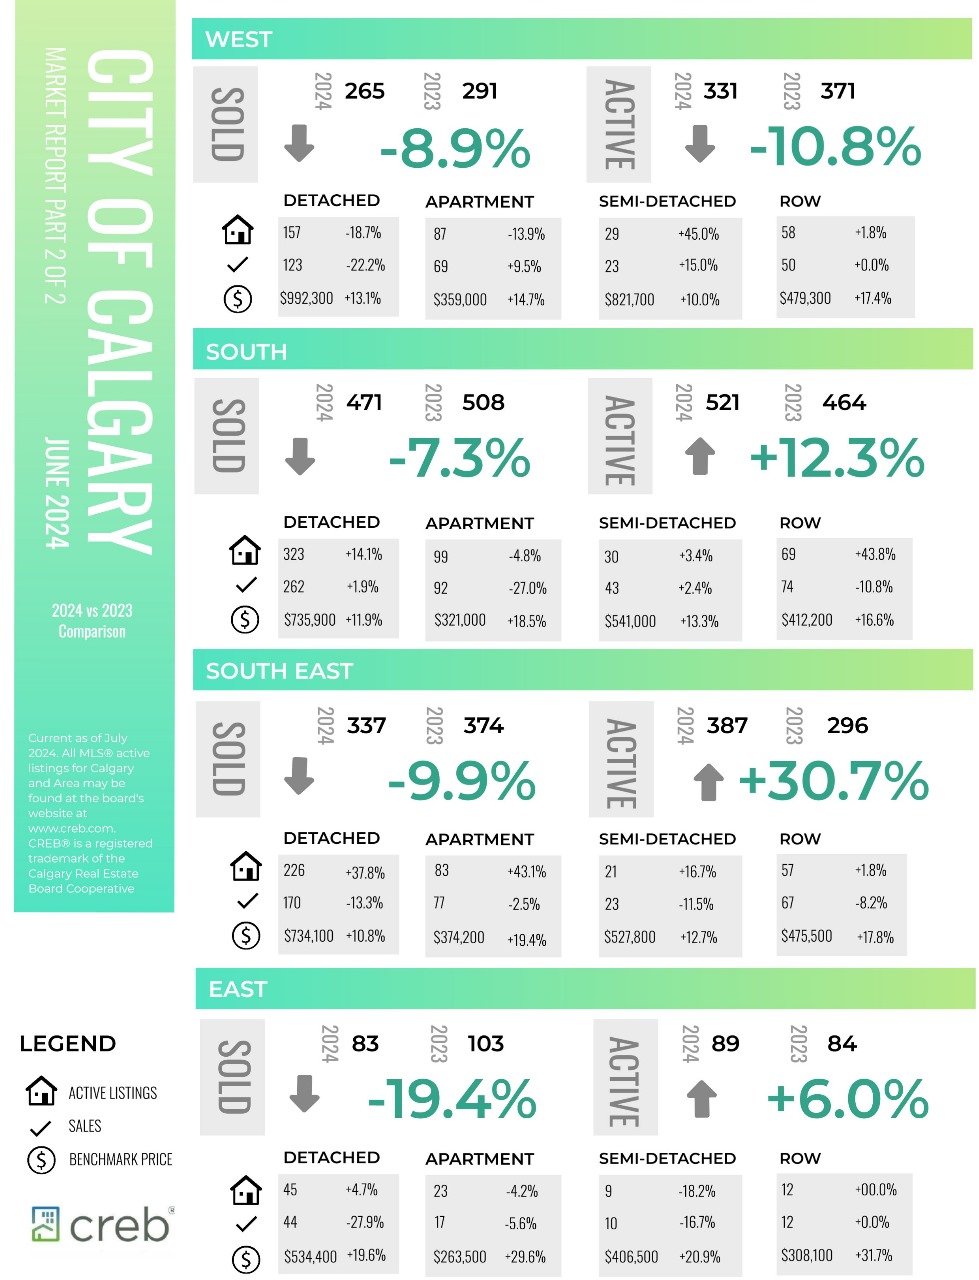
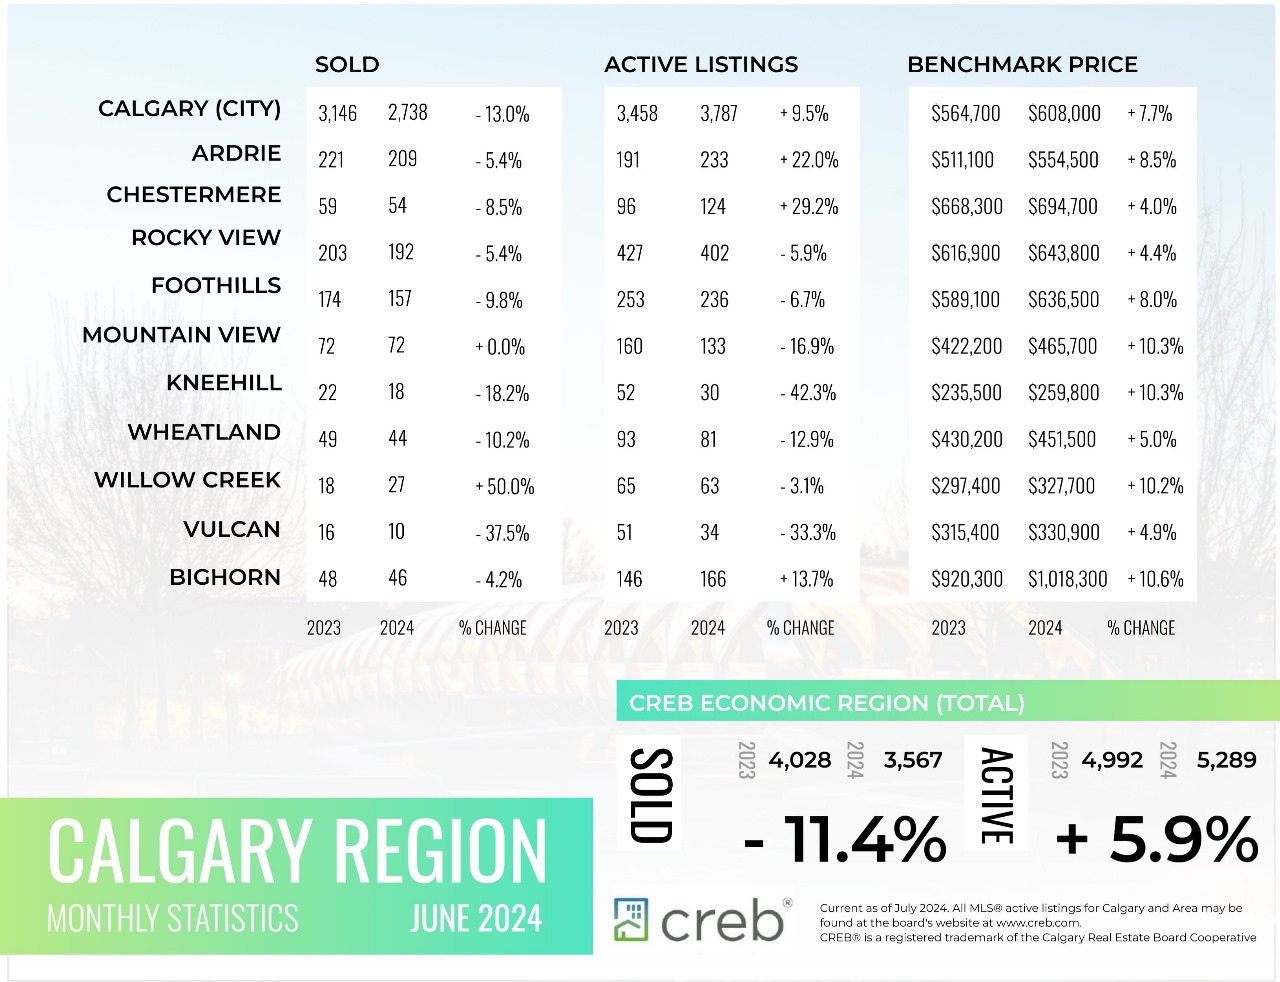
Sales in June reached 2,738, marking a 13 percent decline from last year’s record high. Although sales improved for homes priced above $700,000, it was not enough to offset the declines reported in the lower price ranges. Despite the easing in June sales, they remain over 17 percent higher than long-term trends.
“The pullback in sales reflects supply challenges in the lower price ranges, ultimately limiting sales activity,” said Ann-Marie Lurie, Chief Economist at CREB®. “Inventory in the lower price ranges of each property type continue to fall, providing limited choices for potential purchasers looking for more affordable product. It also continues to be a competitive market for some buyers with over 40 percent of the homes sold selling over list price.”
This month, new listings also eased relative to sales, causing the sales-to-new-listings ratio to remain elevated at 72 percent. Inventory levels did improve over last year’s low levels, primarily due to gains in the higher price ranges. However, with 3,789 units available, levels remain 40 percent lower than long-term trends. The modest change in inventory levels helped increase the months of supply.
Read the full report on the CREB website!
The following data is a comparison between June 2024 and June 2023 numbers, and is current as of July of 2024. For last month’s numbers, check out our previous infographic.
Or follow this link for all our CREB Infographics!
Click on the images for a larger view!
Download Printable Version – June 2024 CREB, City of Calgary Report Pages 1 and 2
Download Printable Version – June 2024 CREB, Calgary Region Report
Last Updated on July 5, 2024 by myRealPage
