INFOGRAPHICS: November 2023 TRREB Toronto Market Reports

GTA REALTORS® Release November Stats
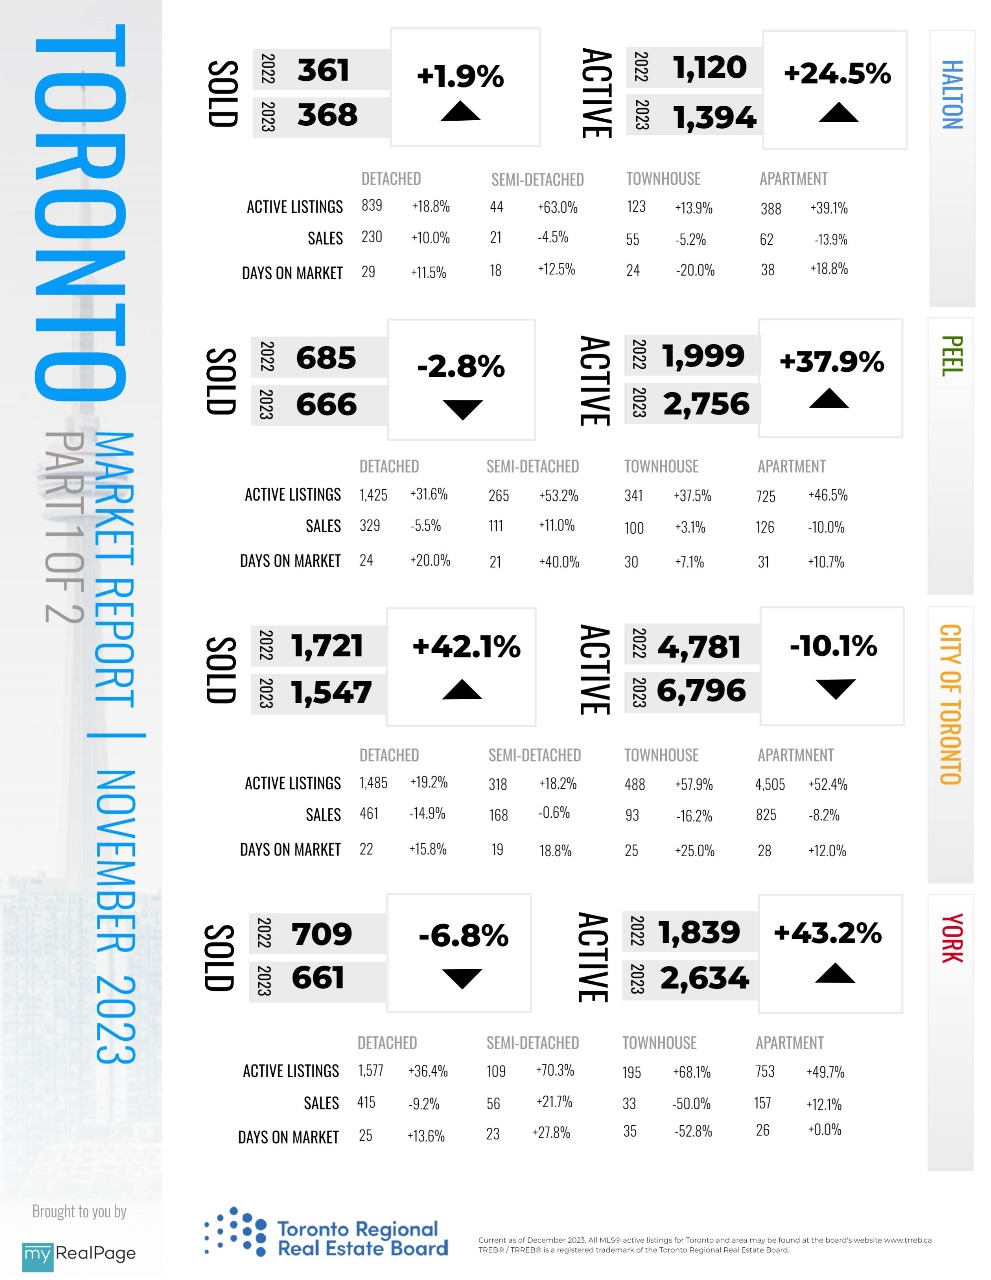
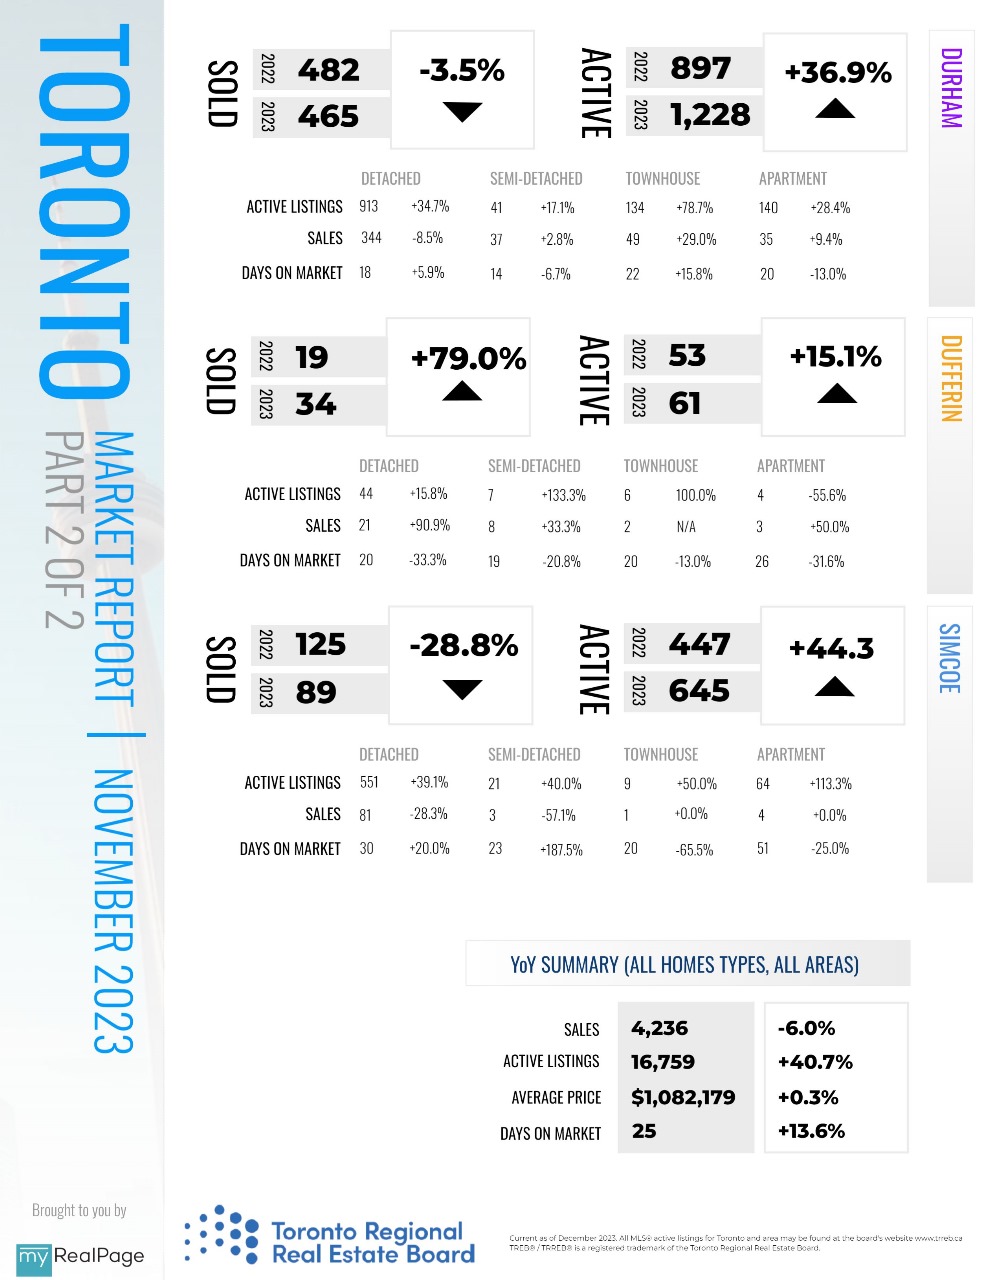
High borrowing costs and uncertain economic conditions continued to weigh on Greater Toronto Area (GTA) home sales in November 2023. Sales were down on a year-over-year basis, while listings were up from last year’s trough in supply. With more choice in the market, selling prices remained basically flat year-over-year.
“Inflation and elevated borrowing costs have taken their toll on affordability. This has been no more apparent than in the interest rate-sensitive housing market. However, it does appear relief is on the horizon. Bond yields, which underpin fixed rate mortgages have been trending lower and an increasing number of forecasters are anticipating Bank of Canada rate cuts in the first half of 2024. Lower rates will help alleviate affordability issues for existing homeowners and those looking to enter the market,” said Toronto Regional Real Estate Board (TRREB) President Paul Baron.
GTA REALTORS® reported 4,236 sales through TRREB’s MLS® System in November 2023 – a six per cent decline compared to November 2022. Over the same period, the number of new listings was up by 16.5 per cent. On a seasonally adjusted monthly basis, sales edged up compared to October 2023, while new listings were down by 5.5 per cent.
Read the full report on TRREB website!
The following data is a comparison between November 2023 and November 2022 numbers, and is current as of December 2023. For last month’s numbers, check out our previous infographic!
Or follow this link for all our TREB / TRREB Infographics!
Download Printable Version – November 2023 TRREB, Toronto Market Report Part 1
Download Printable Version – November 2023 TRREB, Toronto Market Report Part 2
Last Updated on December 8, 2023 by myRealPage
