INFOGRAPHICS: October 2023 TRREB Toronto Market Reports

GTA REALTORS® Release October Stats
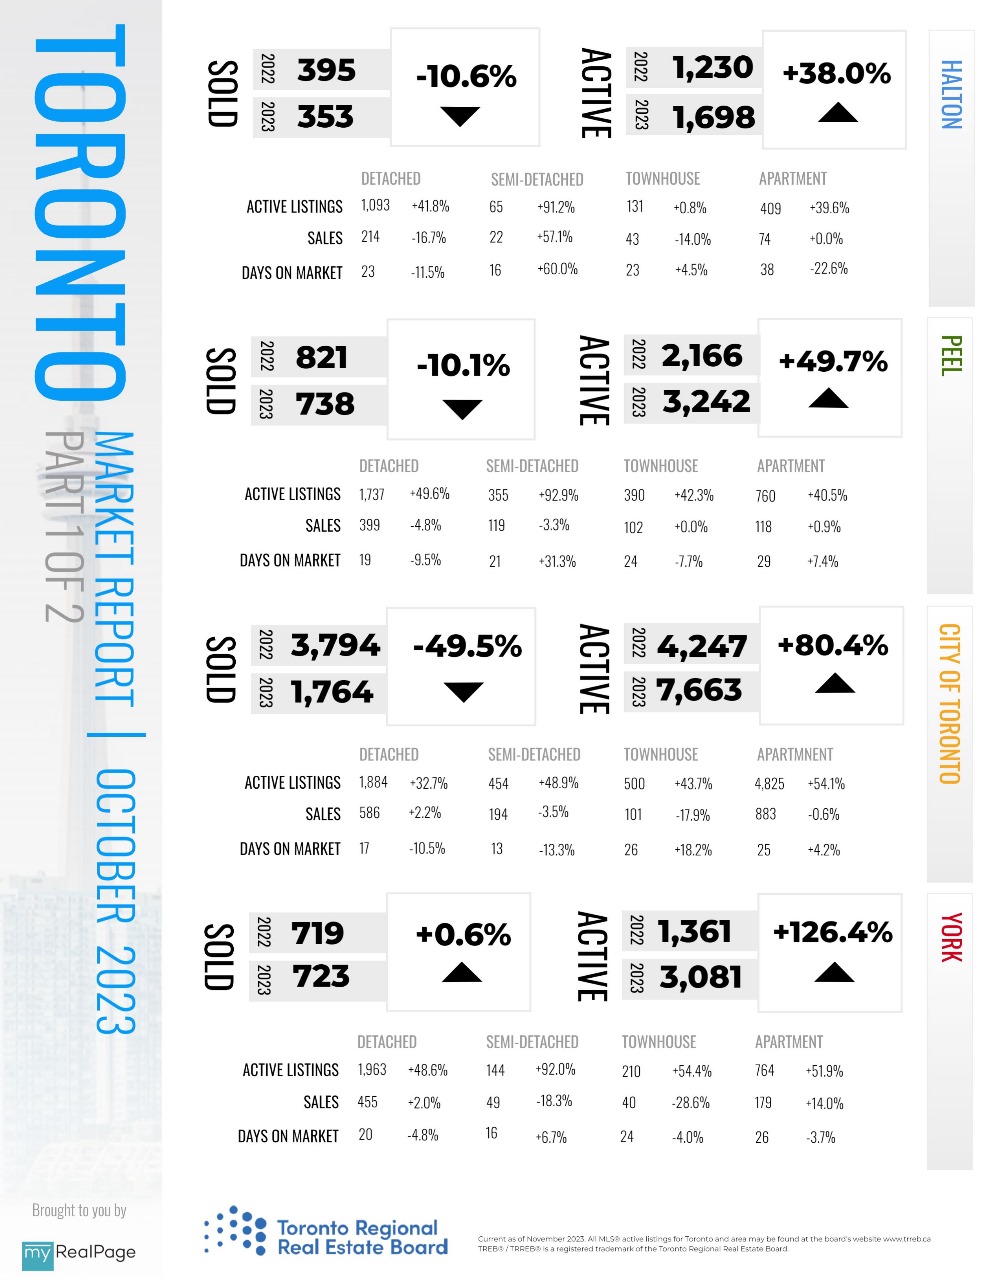
Lack of affordability and uncertainty remained issues for many would-be home buyers in the Greater Toronto Area (GTA) in October 2023. As a result, sales edged lower compared to last year. However, selling prices remained higher than last year’s levels.
“Record population growth and a relatively resilient GTA economy have kept the overall demand for housing strong. However, more of that demand has been pointed at the rental market, as high borrowing costs and uncertainty on the direction of interest rates has seen many would-be home buyers remain on the sidelines in the short term. When mortgage rates start trending lower, home sales will pick up quickly,” said TRREB President Paul Baron.
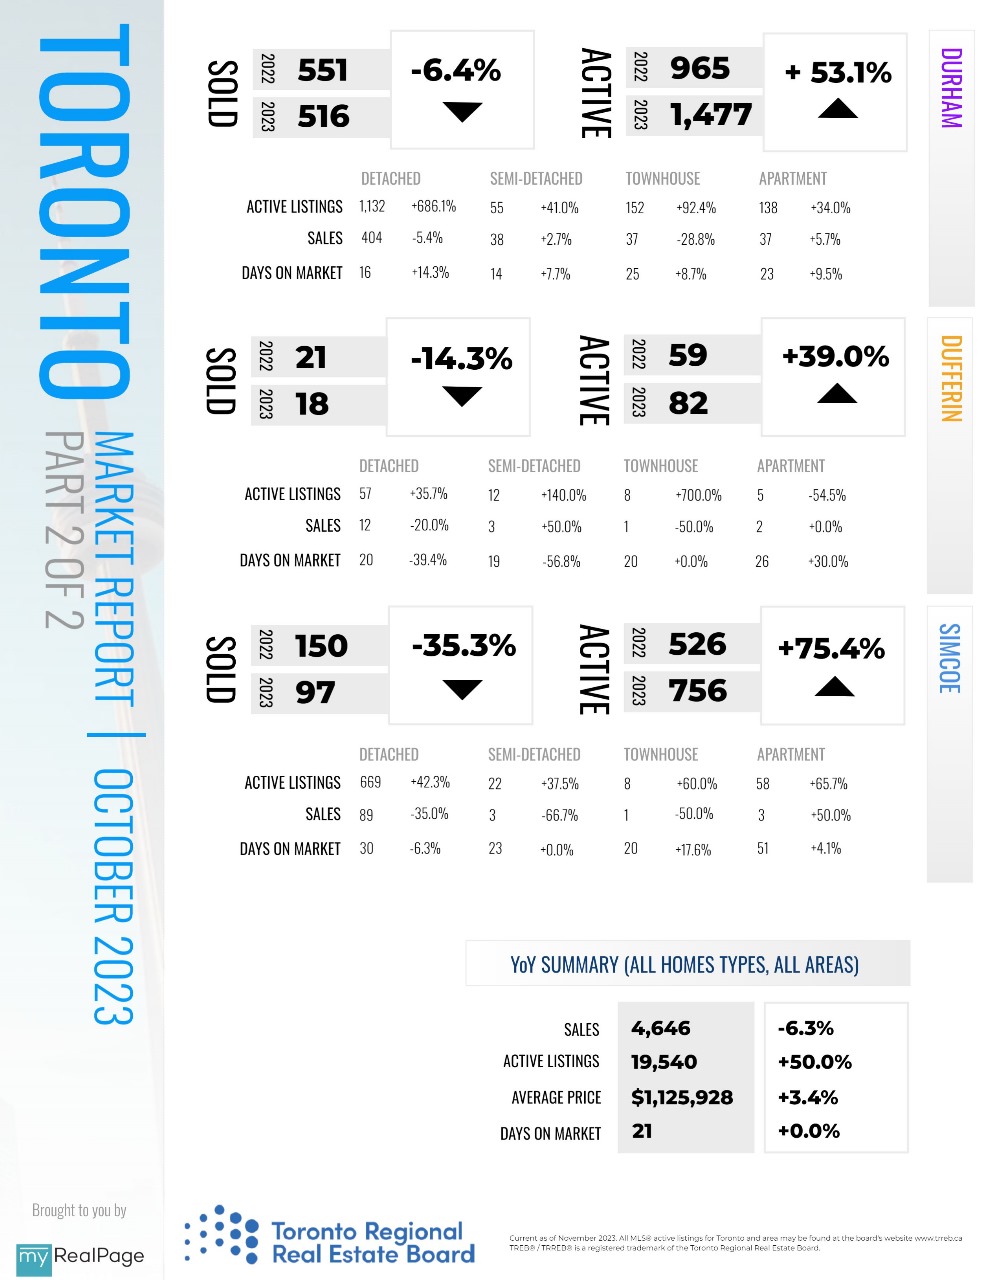
REALTORS® reported 4,646 GTA home sales through TRREB’s MLS® System in October 2023 – down 5.8 per cent compared to October 2022. On a month-over-month seasonally-adjusted basis, sales were also down in comparison to September.
Read the full report on TRREB website!
The following data is a comparison between October 2023 and October 2022 numbers, and is current as of November 2023. For last month’s numbers, check out our previous infographic!
Or follow this link for all our TREB / TRREB Infographics!
Download Printable Version – October 2023 TRREB, Toronto Market Report Part 1
Download Printable Version – October 2023 TRREB, Toronto Market Report Part 2
Last Updated on November 28, 2023 by myRealPage
