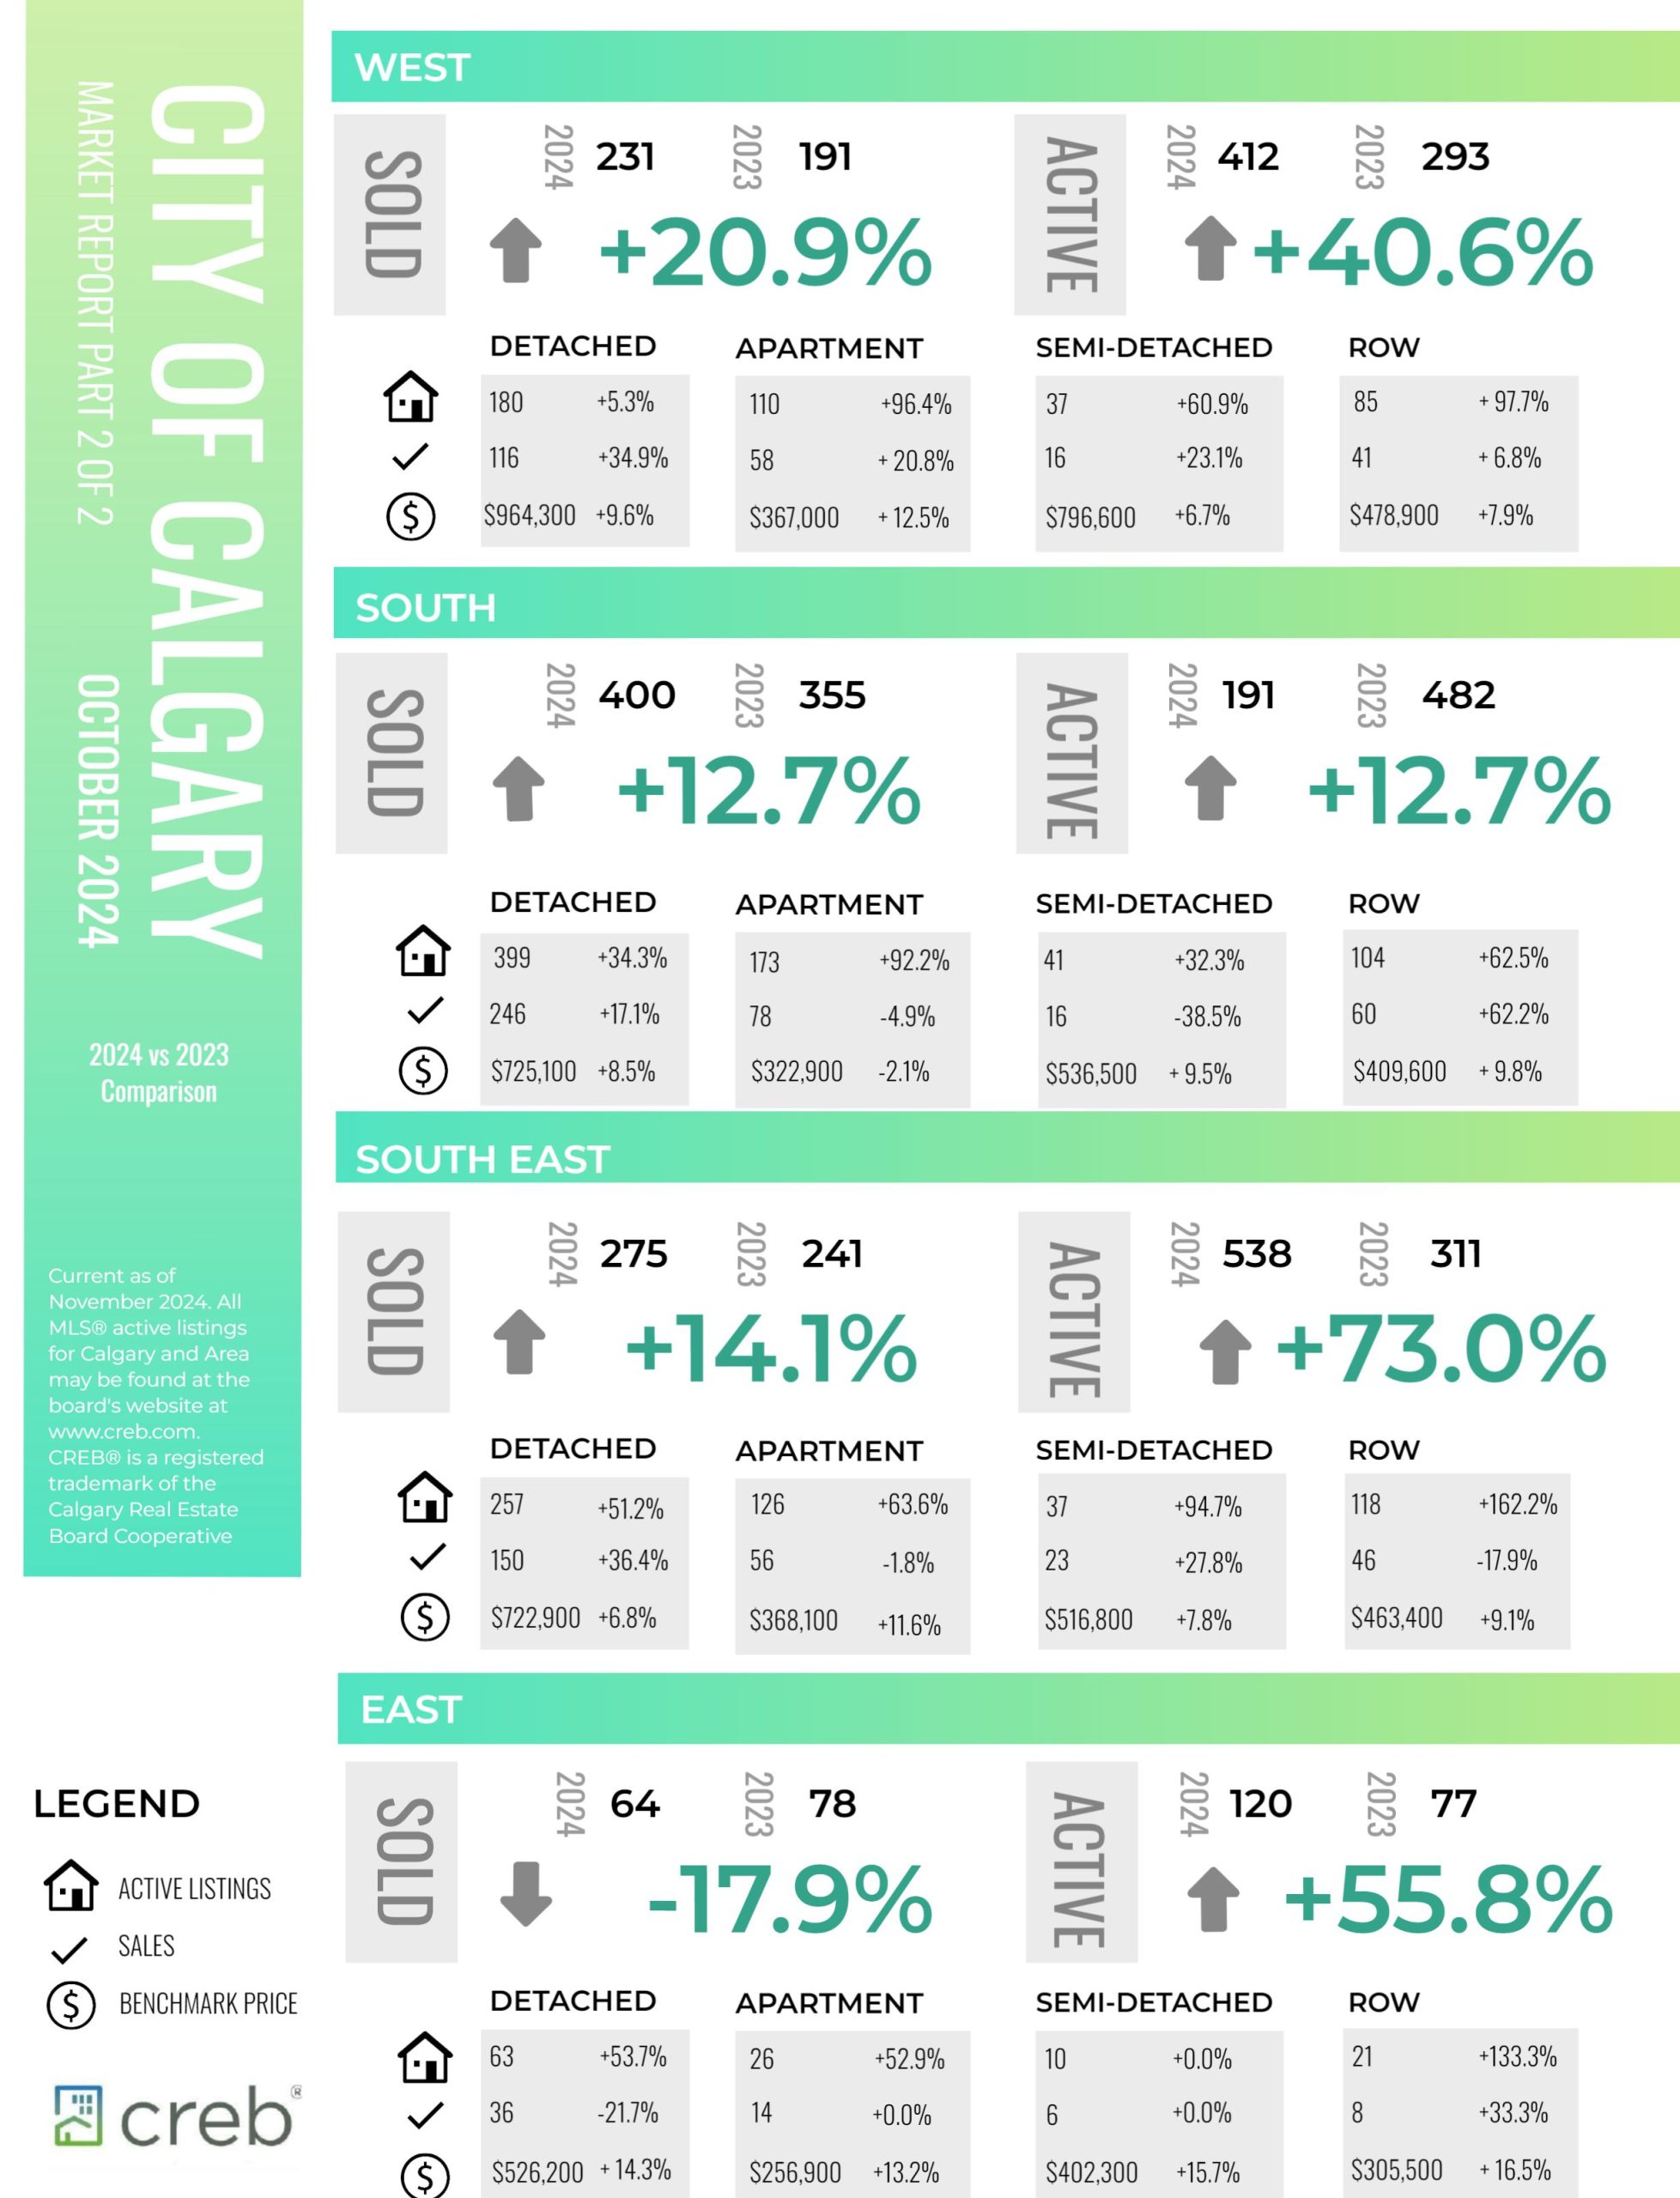
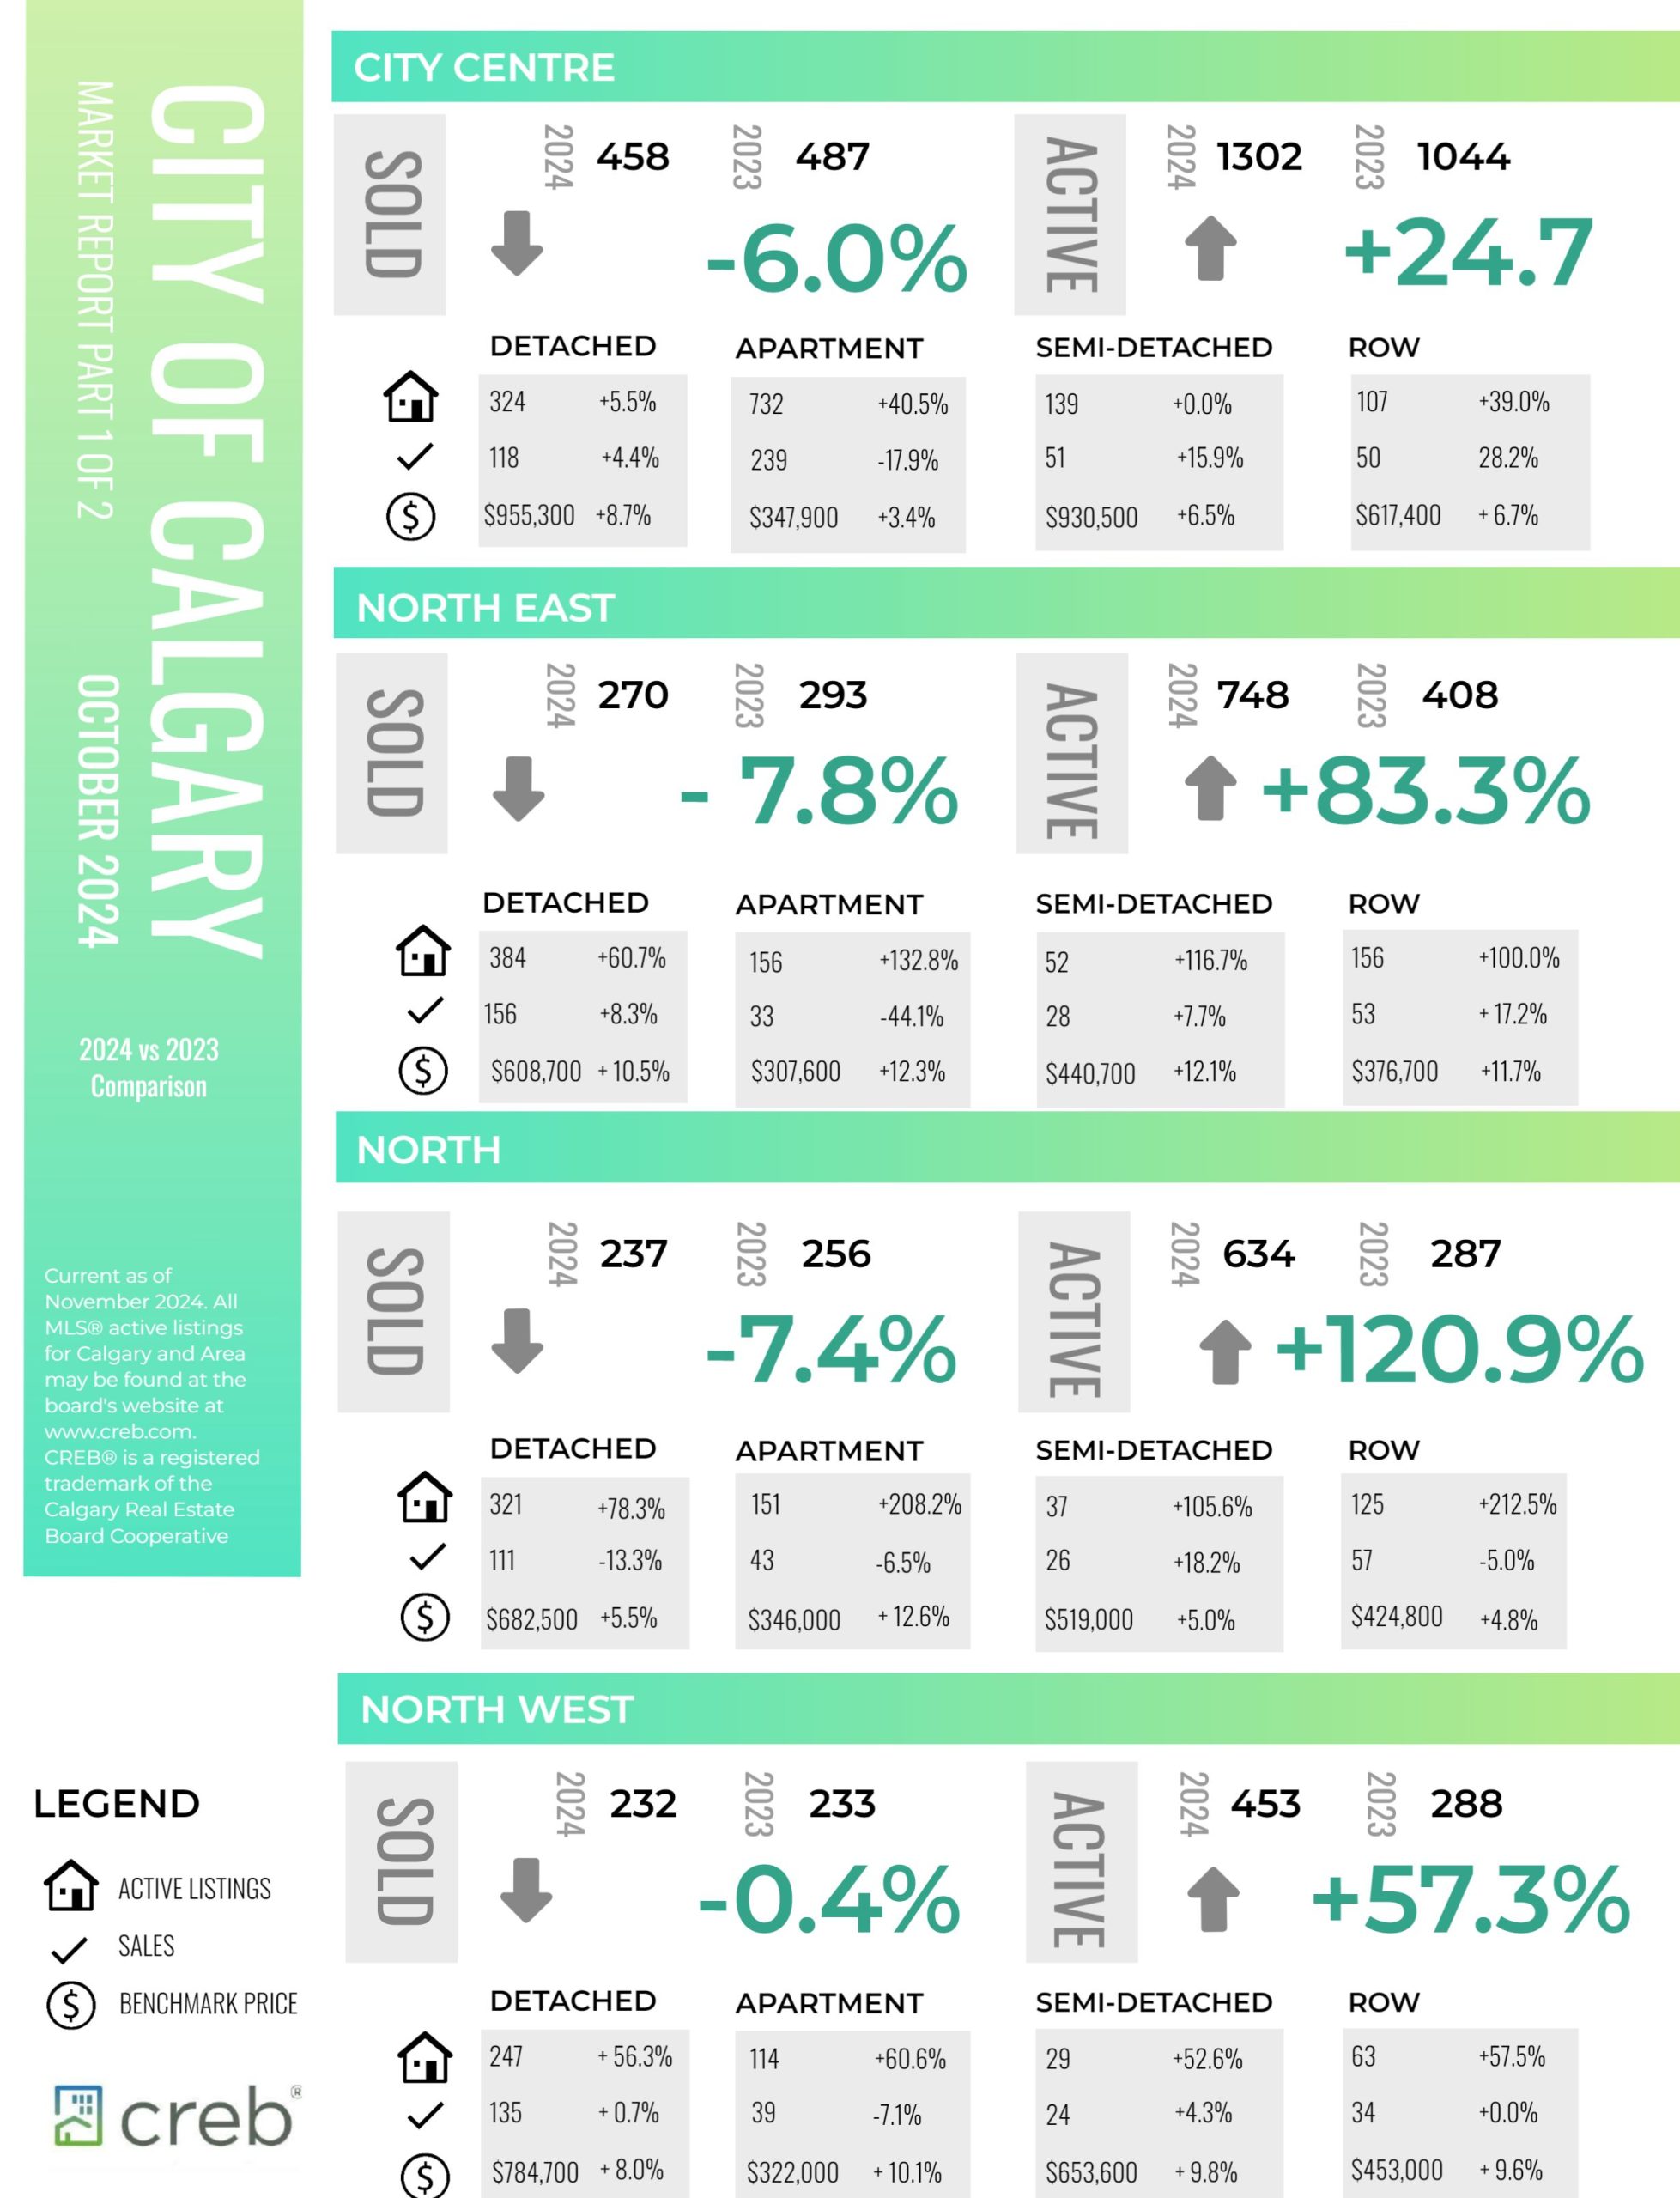
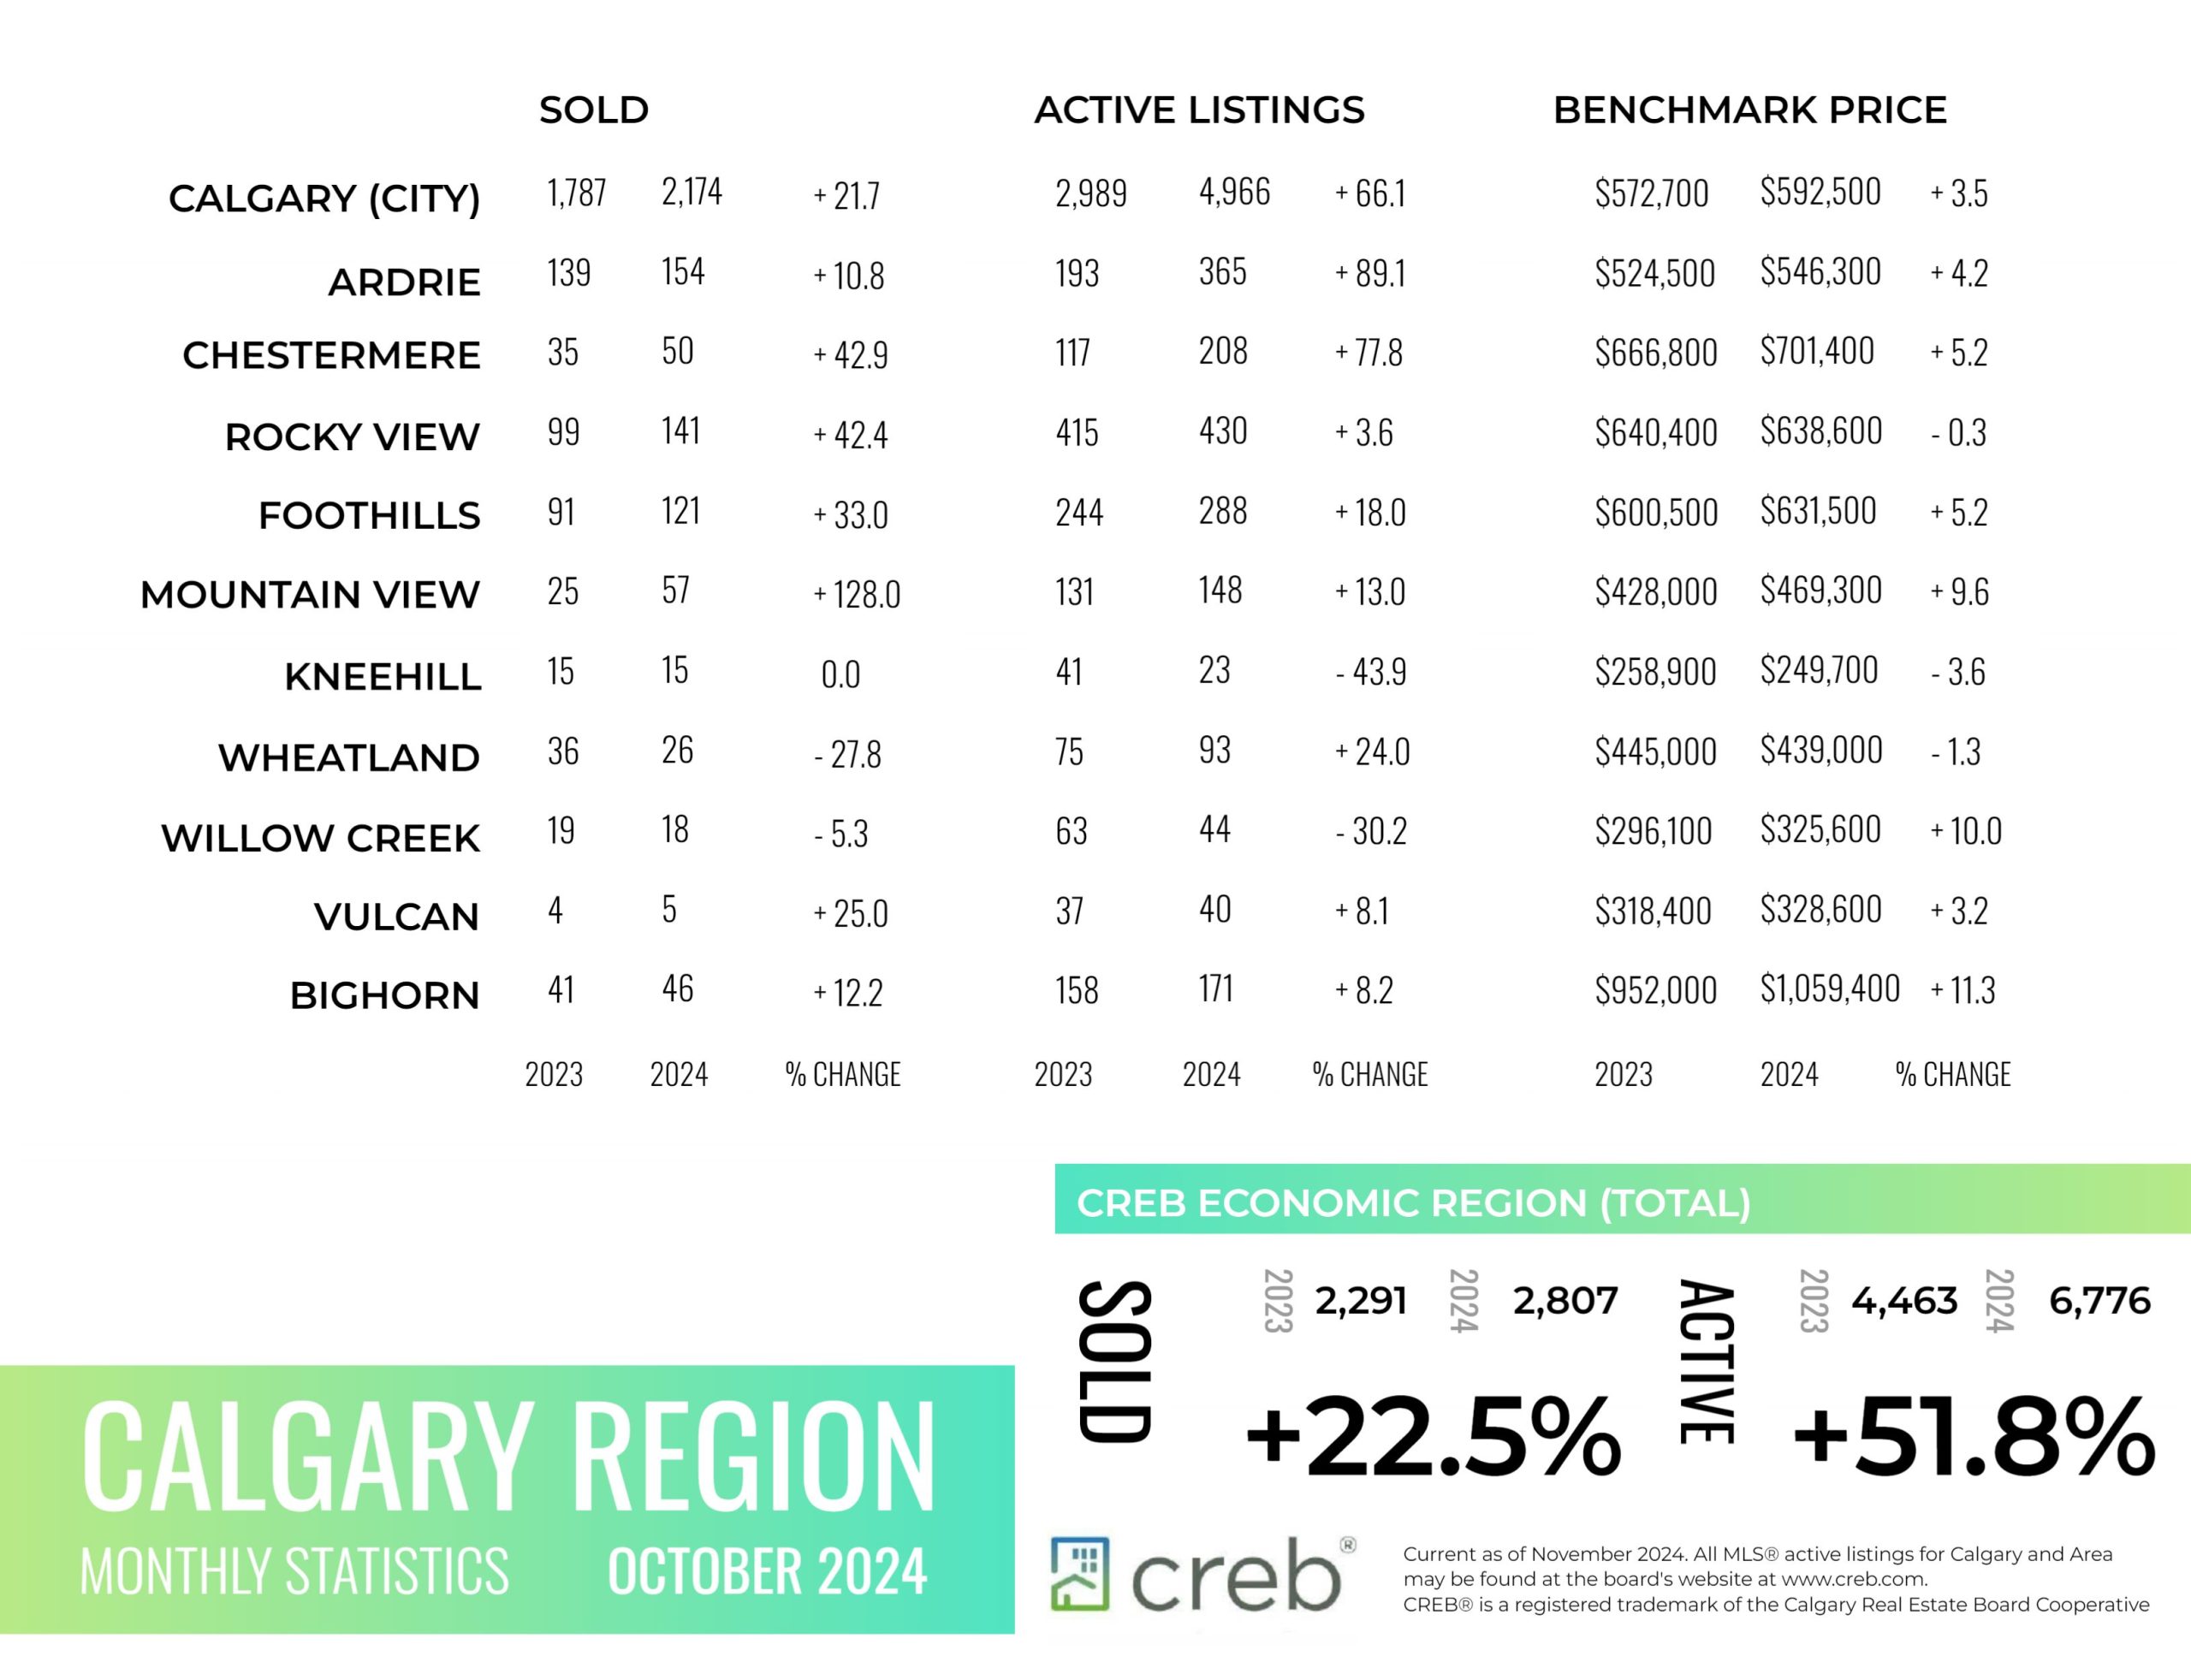
INFOGRAPHICS: October 2024 CREB City And Region Market Reports

Supply levels improving for higher-priced homes
Sales gains for homes priced above $600,000 offset declines at the lower end of the market, resulting in October sales that were similar to last year. The 2,174 sales in October increased over September and stood 24 per cent above long-term trends for the month.
“Housing demand has stayed relatively strong in our market as we move into the fourth quarter, with October sales rising over last month,” said Ann-Marie Lurie, Chief Economist at CREB®. “However, activity would likely have been stronger if more supply choices existed for lower-priced homes. Supply levels in our market are improving relative to the ultra-low levels experienced last year, but much of the gains have been driven by higher-priced units for each property type. This results in conditions far more balanced in the upper end of the market versus the seller’s market conditions in the lower to mid-price ranges of each property type.”
Read the full report on the CREB website!
The following data is a comparison between October 2024 and October 2023 numbers, and is current as of November of 2024. For last month’s numbers, check out our previous infographic.
Or follow this link for all our CREB Infographics!
Click on the images for a larger view!
Download Printable Version – October 2024 CREB, City of Calgary Report Pages 1 and 2
Download Printable Version – October 2024 CREB, Calgary Region Report
Last Updated on November 7, 2024 by myRealPage


