INFOGRAPHICS: October 2025 CREB City And Region Market Reports

Pace of new listings growth slows, preventing further inventory gains
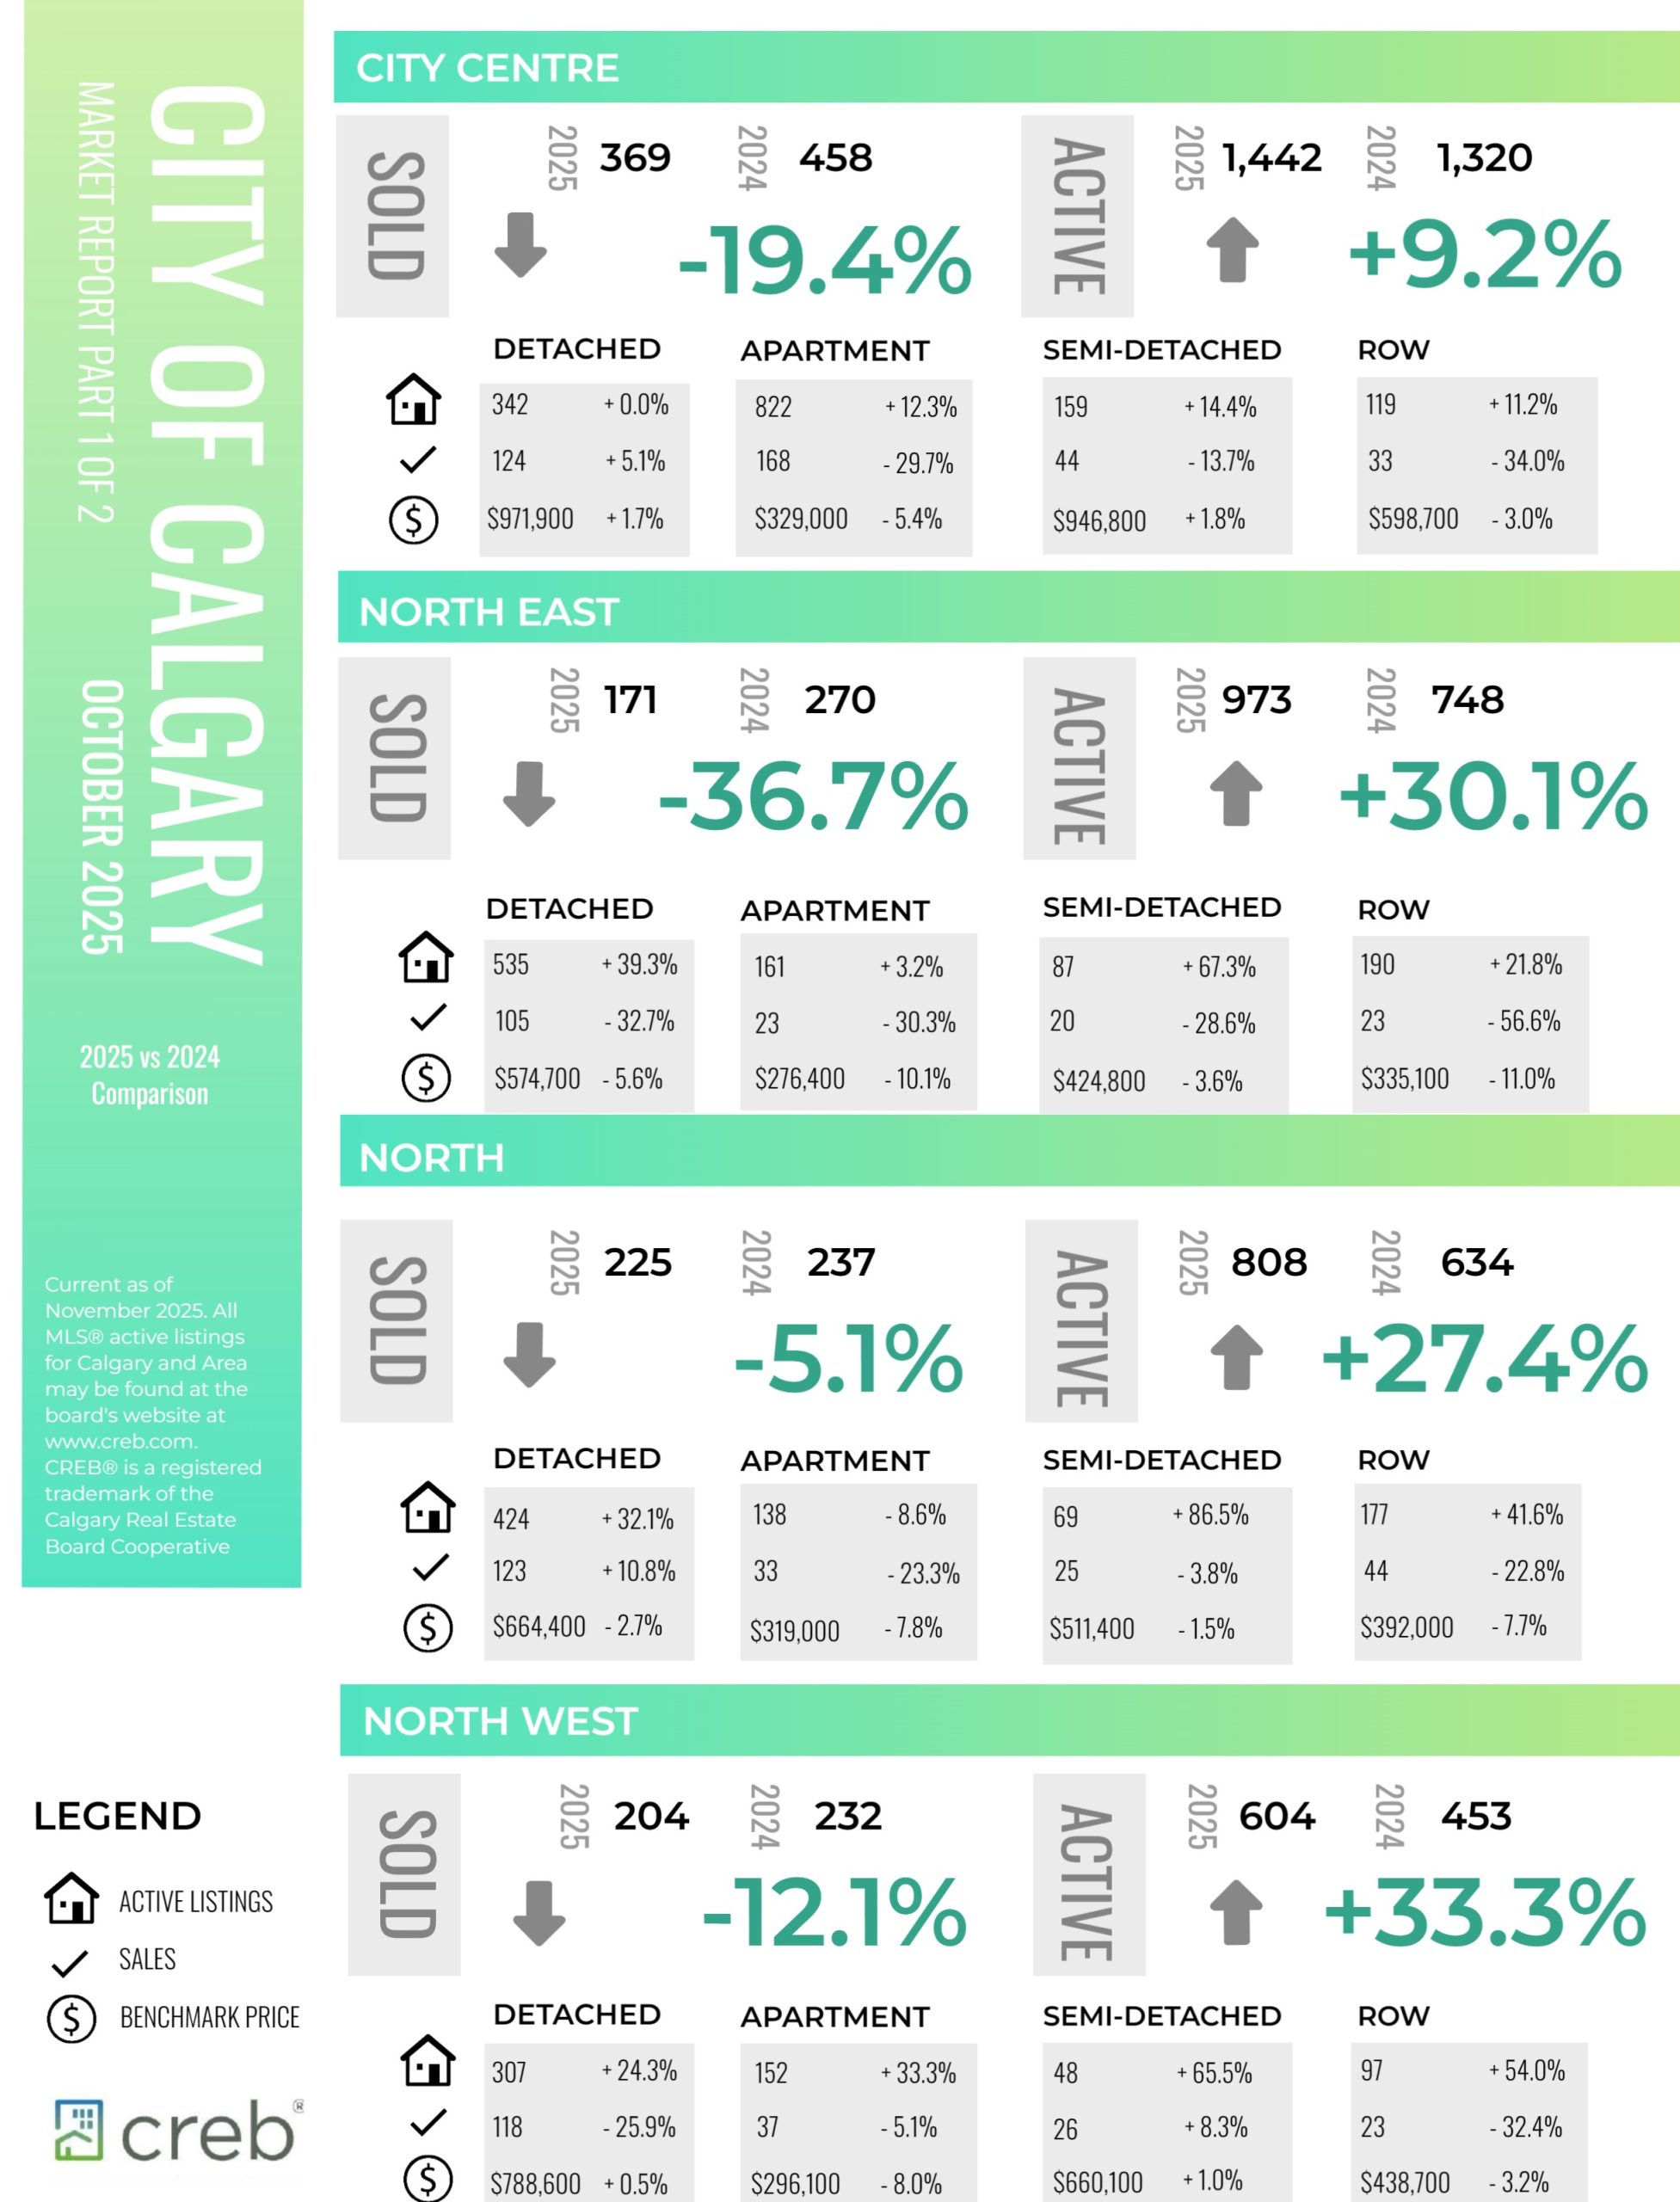
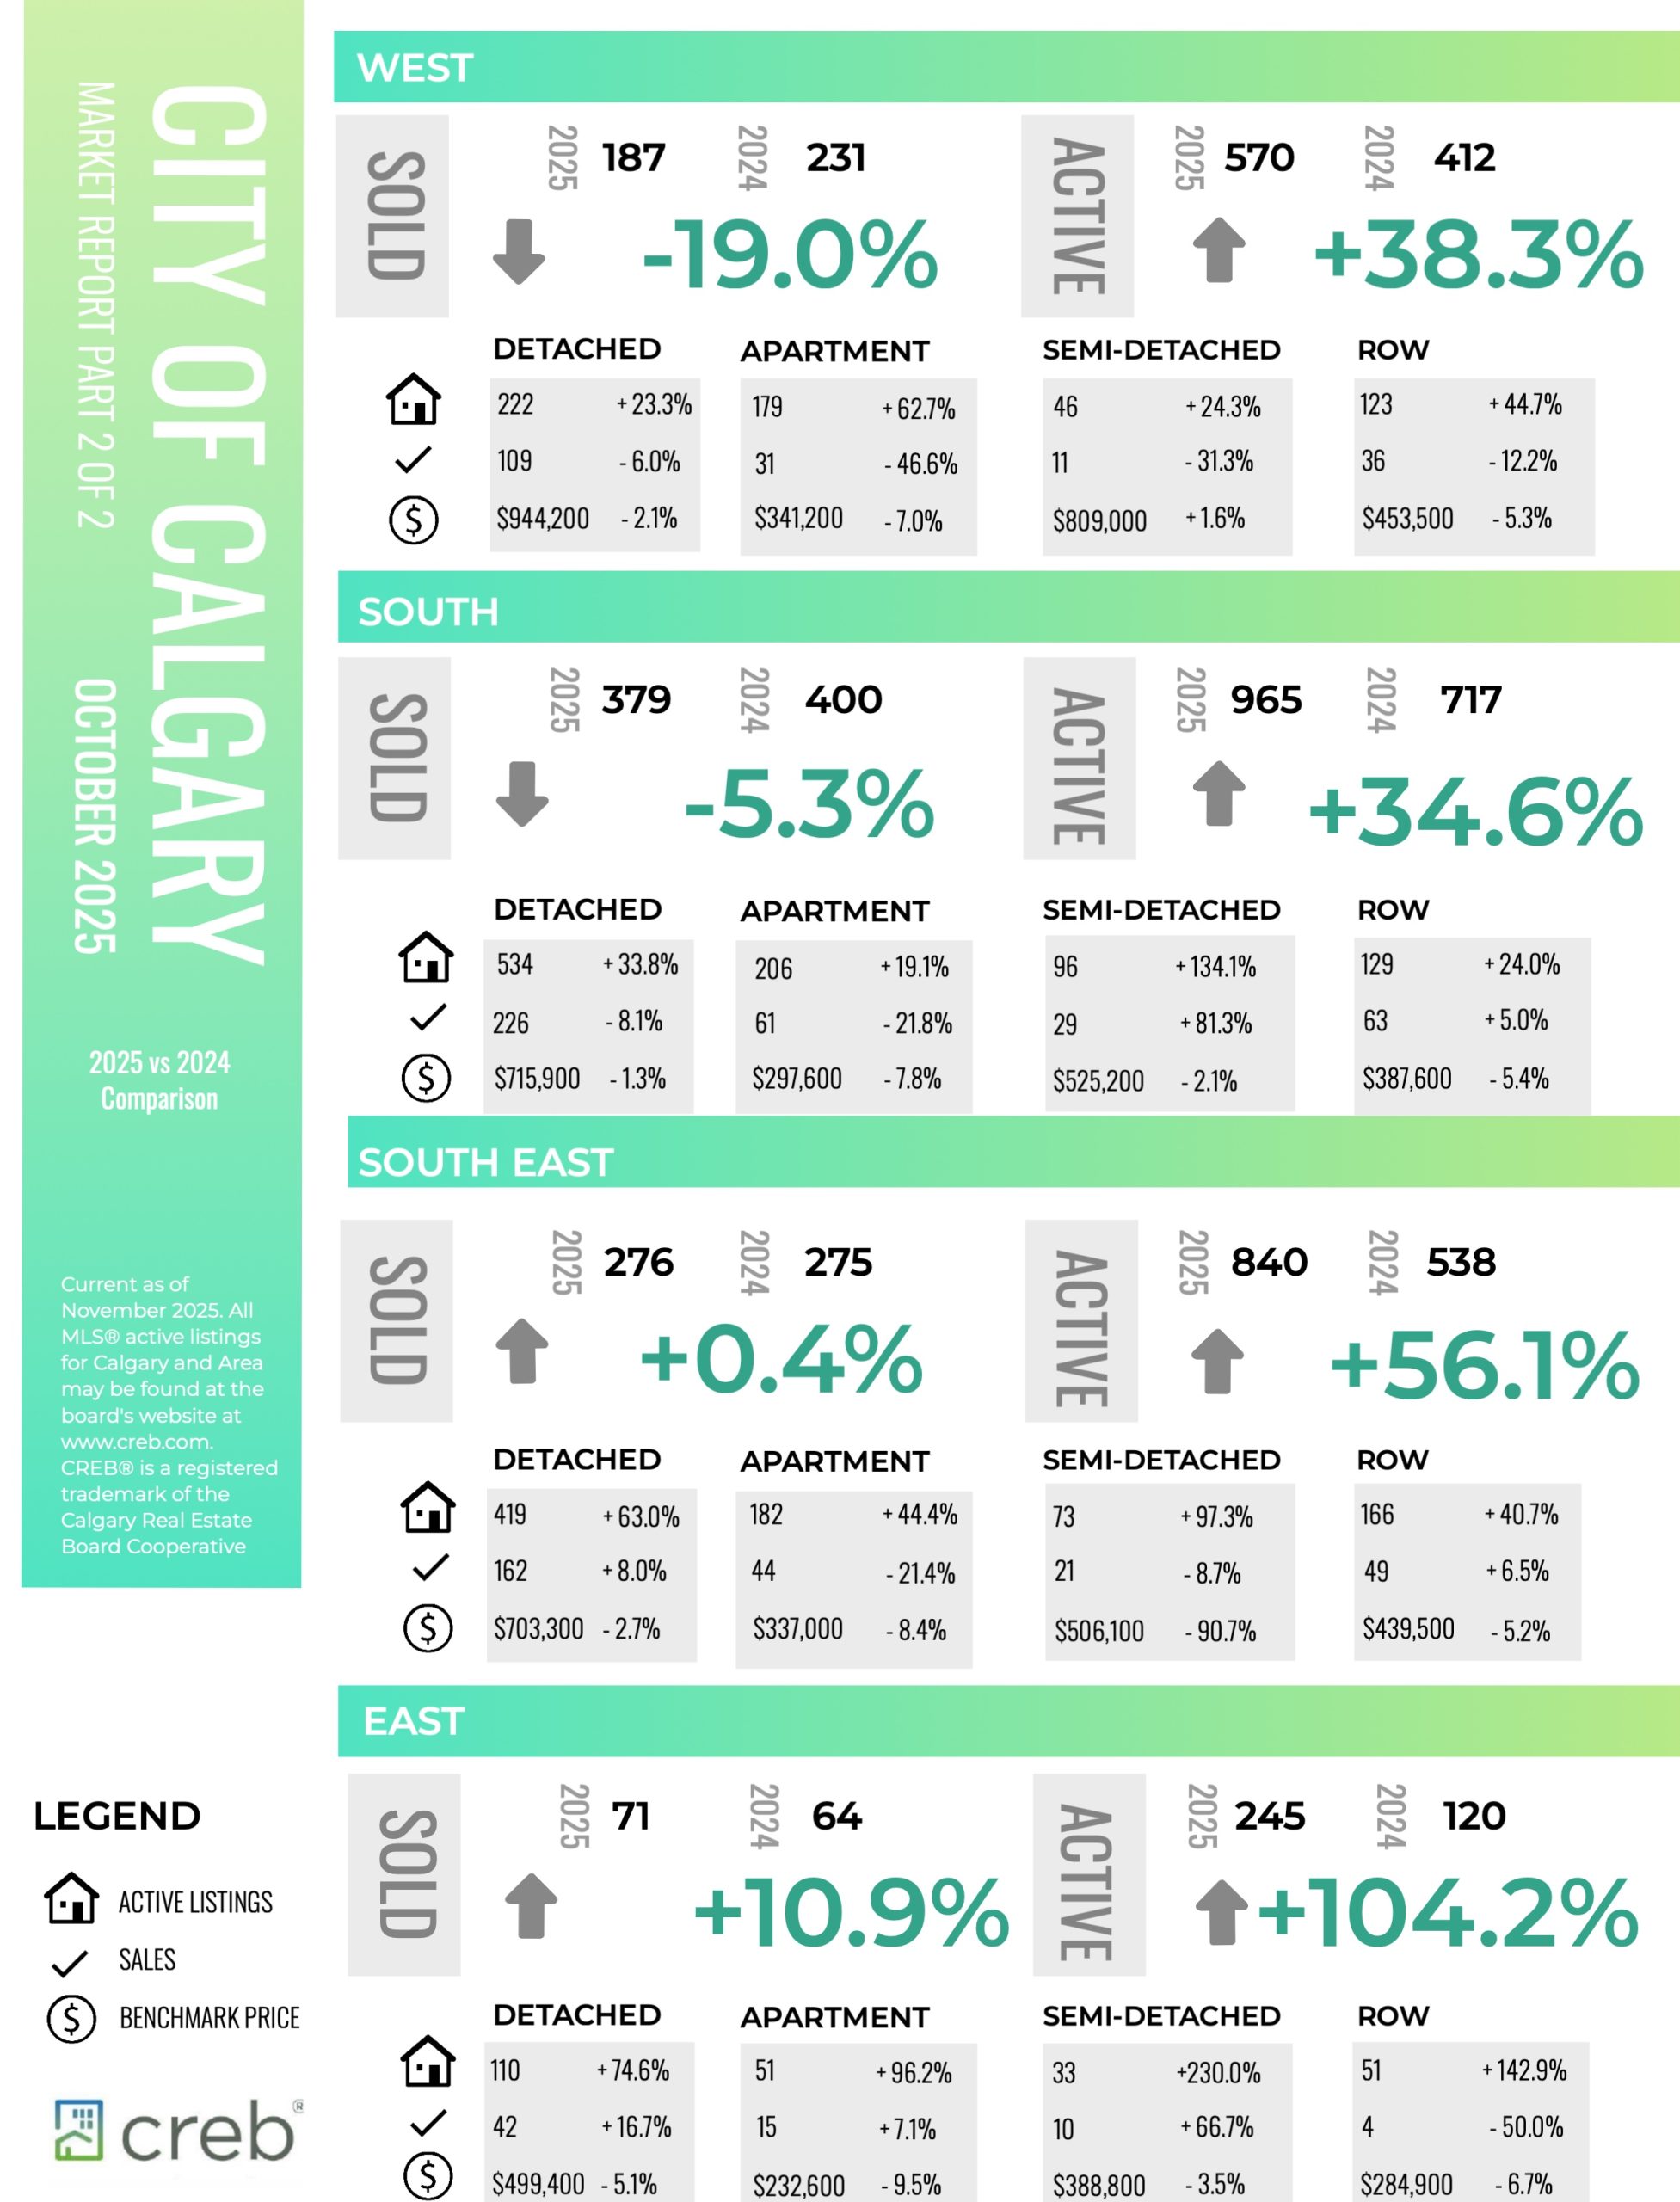
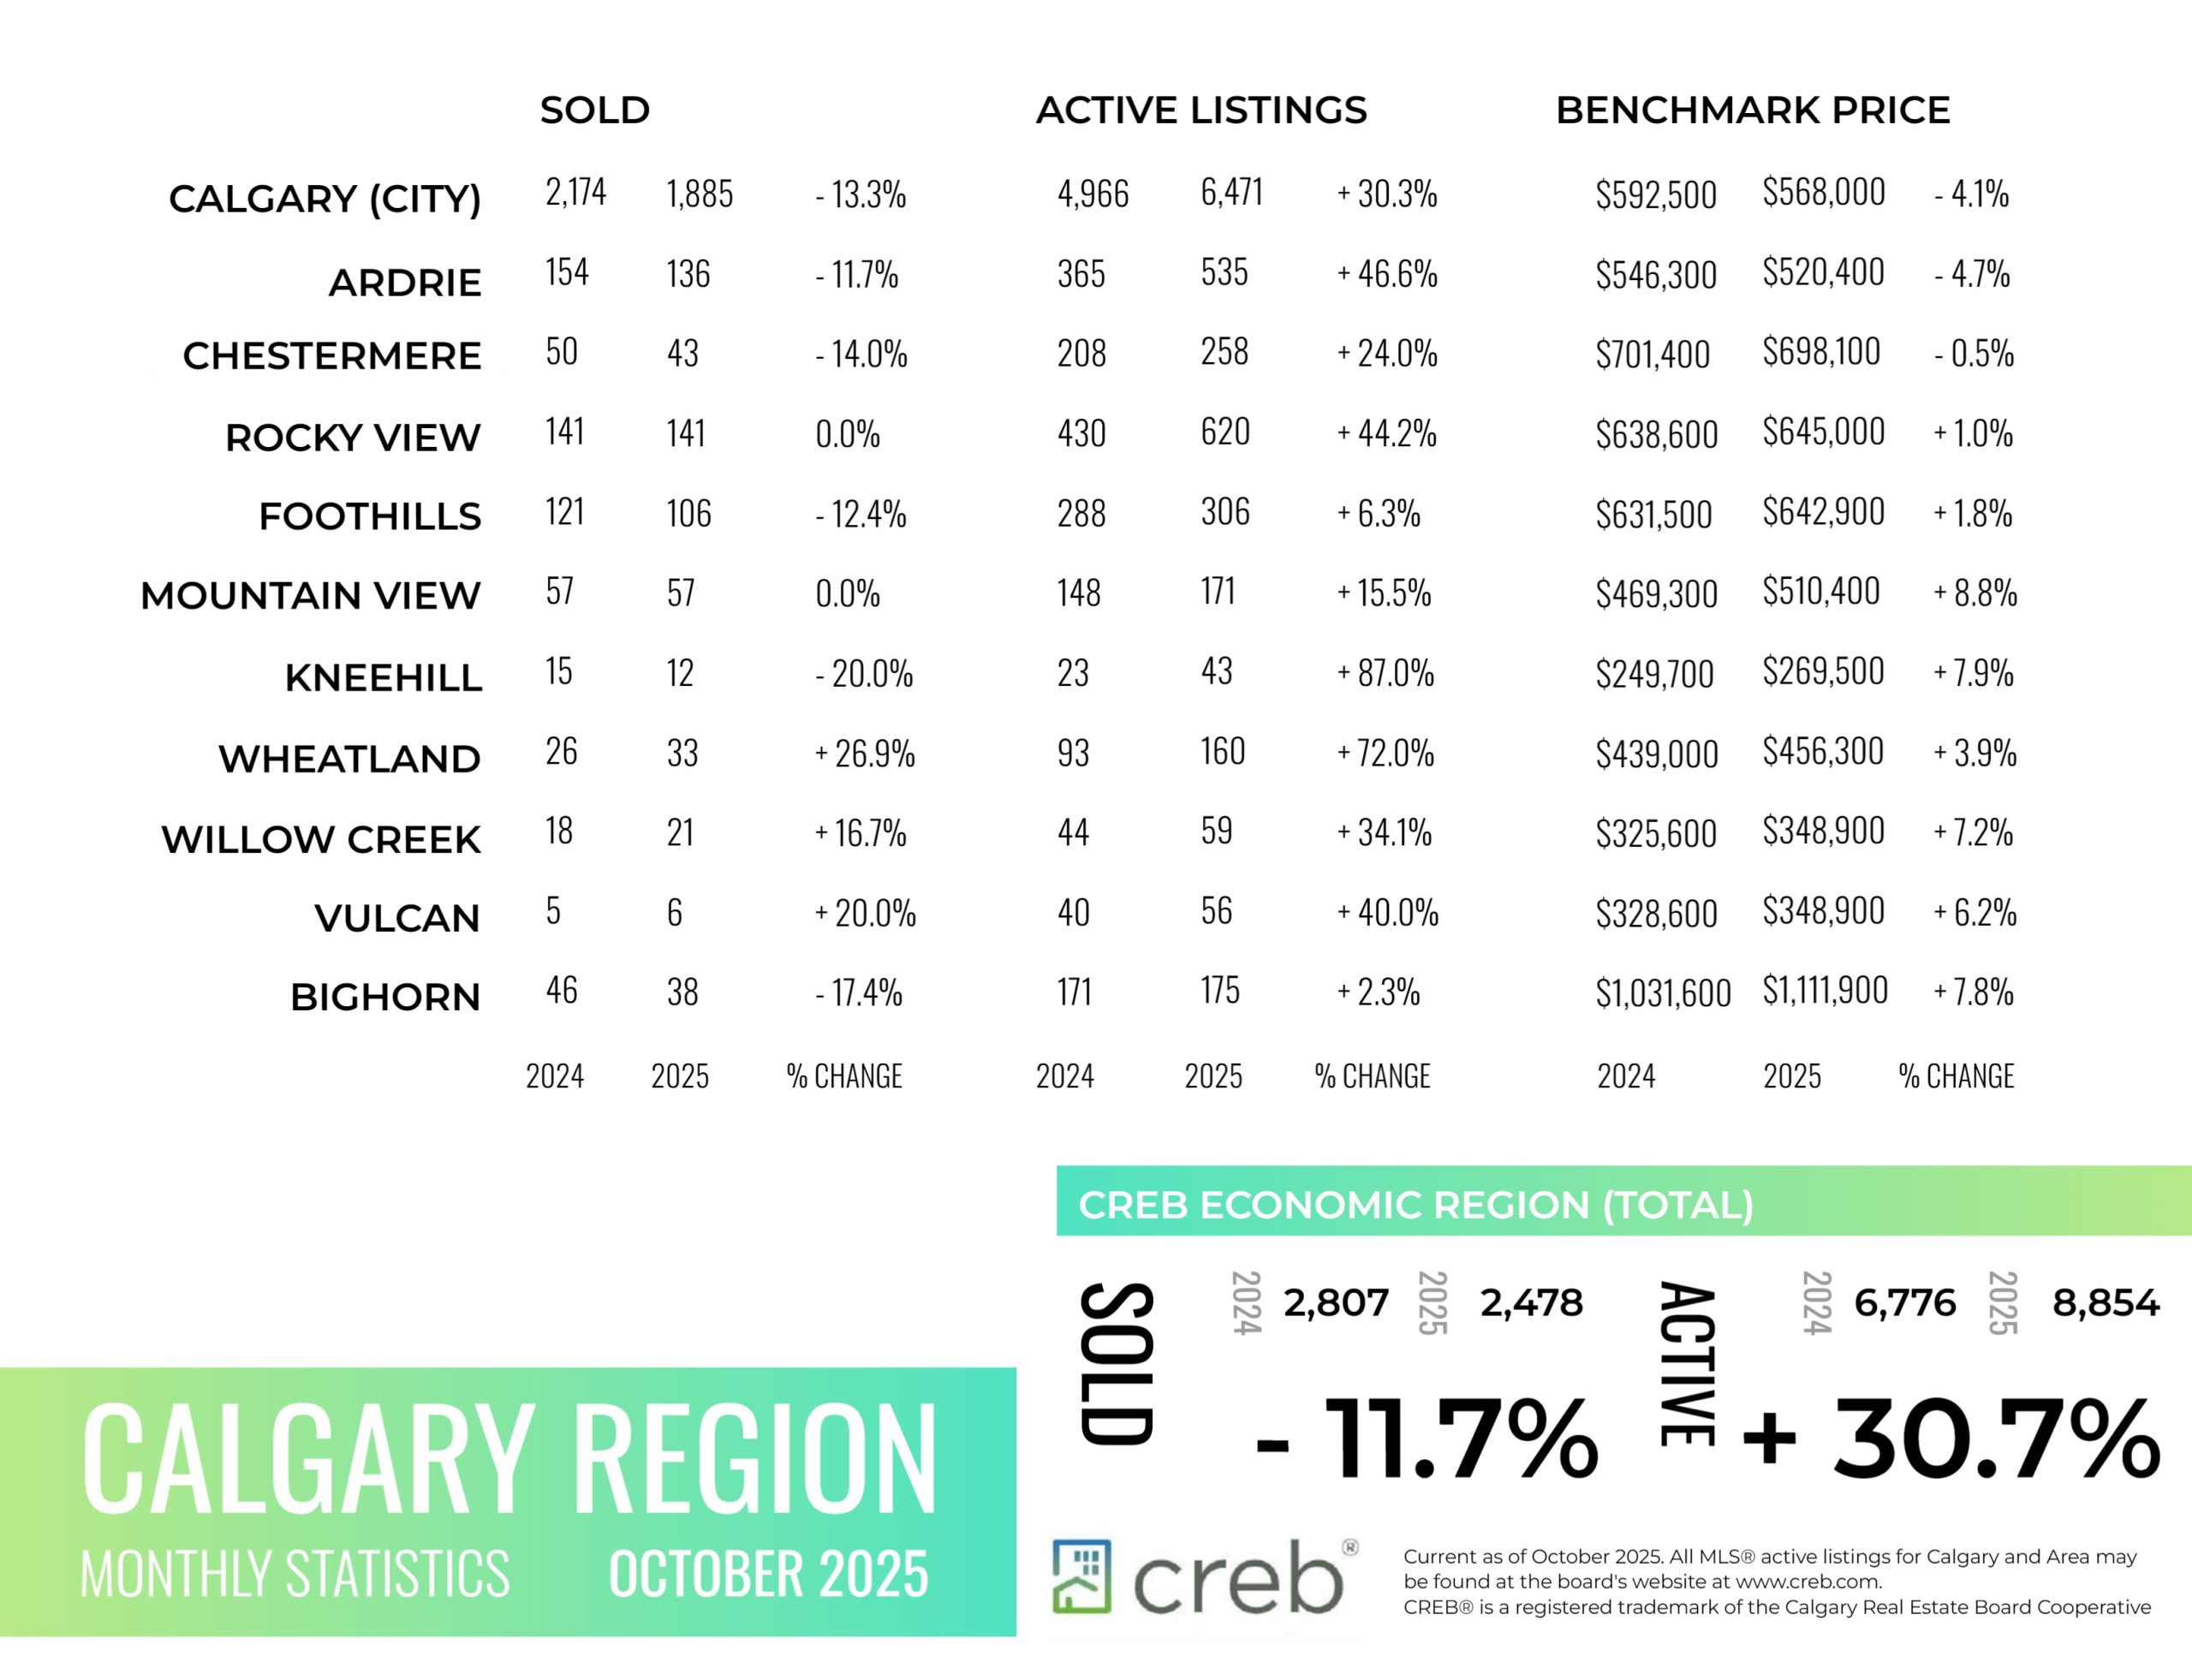
Inventory levels eased over last month thanks to the combined impact of a monthly pullback in new listings and a monthly pick up in sales.
With 6,471 units in inventory and 1,885 sales the October months of supply returned to three-and-a-half months after pushing up to four months in September. While both row- and apartment-style properties continue to report elevated supply levels compared to demand, conditions remain relatively balanced for both detached and semi-detached properties.
Year-to-date sales in the city totaled 20,082, down nearly 16 per cent compared to last year, but still in line with longer-term trends. Much of the decline in sales has been driven by pullbacks for apartment- and row-style homes.
“Improved rental supply and easing rents have slowed ownership demand for apartment- and row-style homes. It is also these segments of the market that have seen October inventories reach a record high for the month,” said Ann-Marie Lurie, CREB®’s Chief Economist. “Excess supply for apartment- and row-style properties is weighing on prices in those segments more so than any other property type, influencing total residential prices.”
Read the full report on the CREB website!
The following data is a comparison between October 2025 and October 2024 numbers, and is current as of November of 2025. For last month’s numbers, check out our previous infographic.
Or follow this link for all our CREB Infographics!
Click on the images for a larger view!
Download Printable Version – October 2025 CREB, City of Calgary Report Pages 1 and 2
Download Printable Version – October 2025 CREB, Calgary Region Report
Last Updated on November 8, 2025 by myRealPage
