INFOGRAPHICS: September 2023 TRREB Toronto Market Reports

GTA REALTORS® Release September Stats
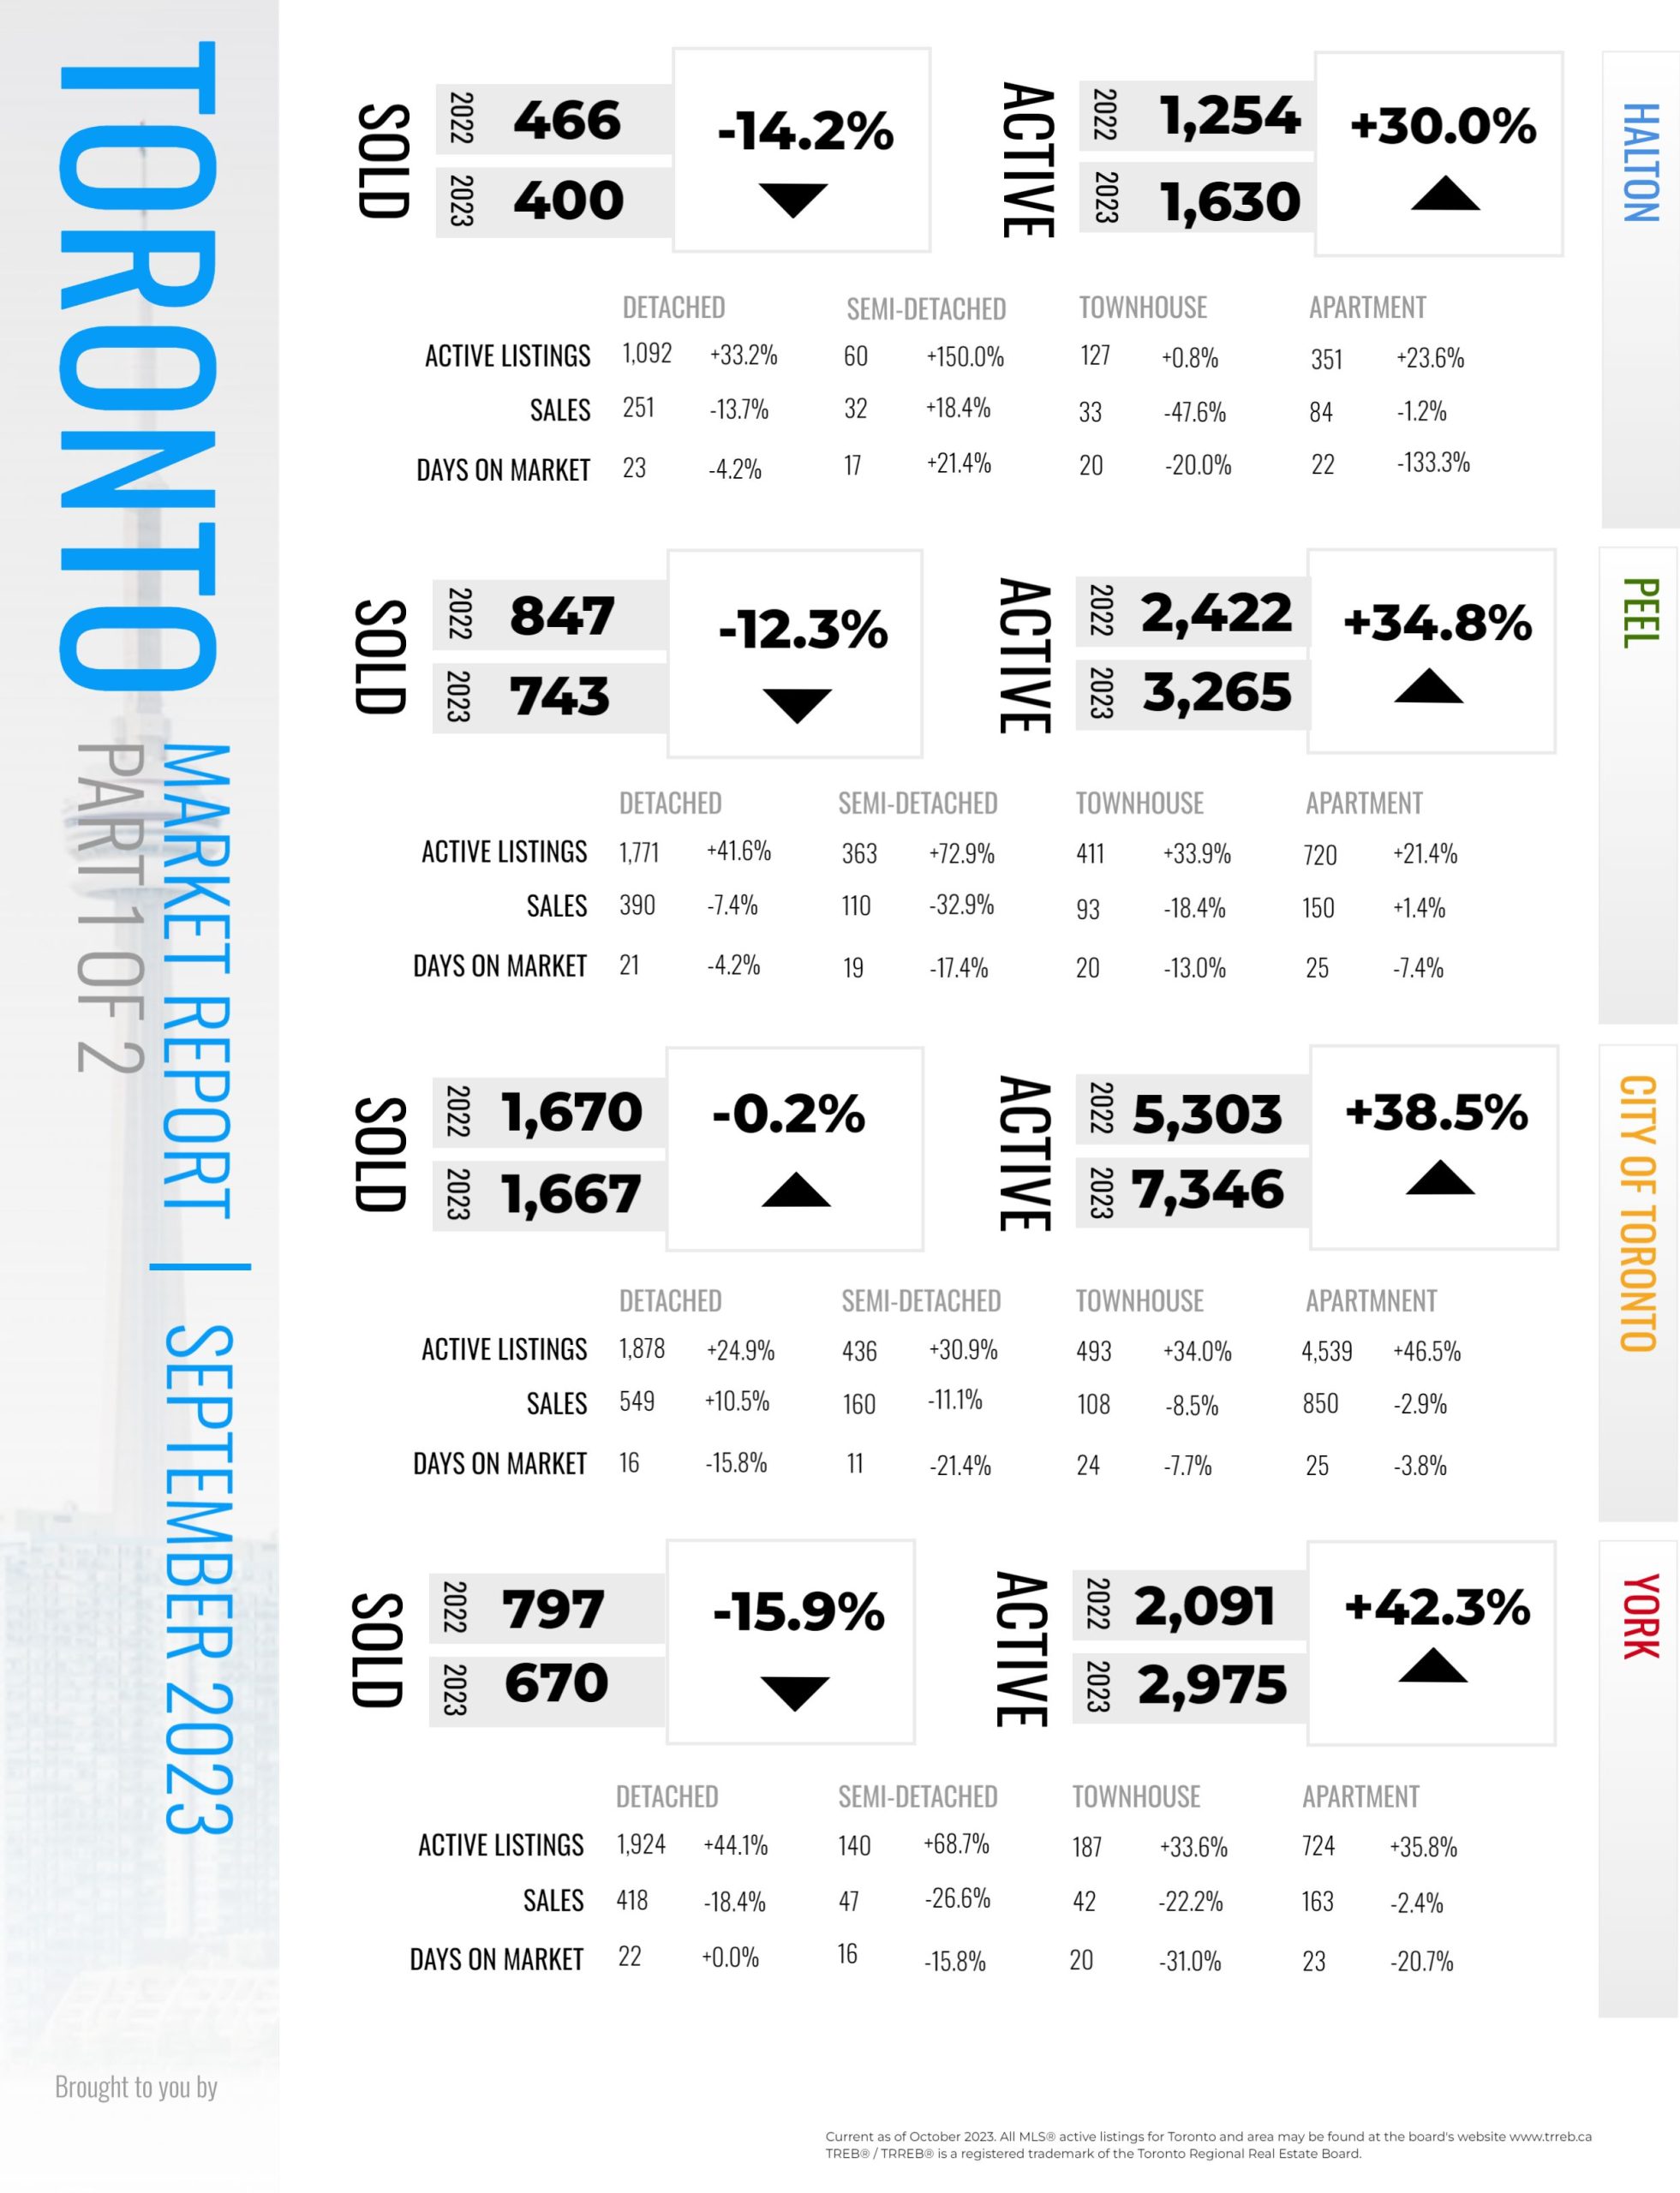
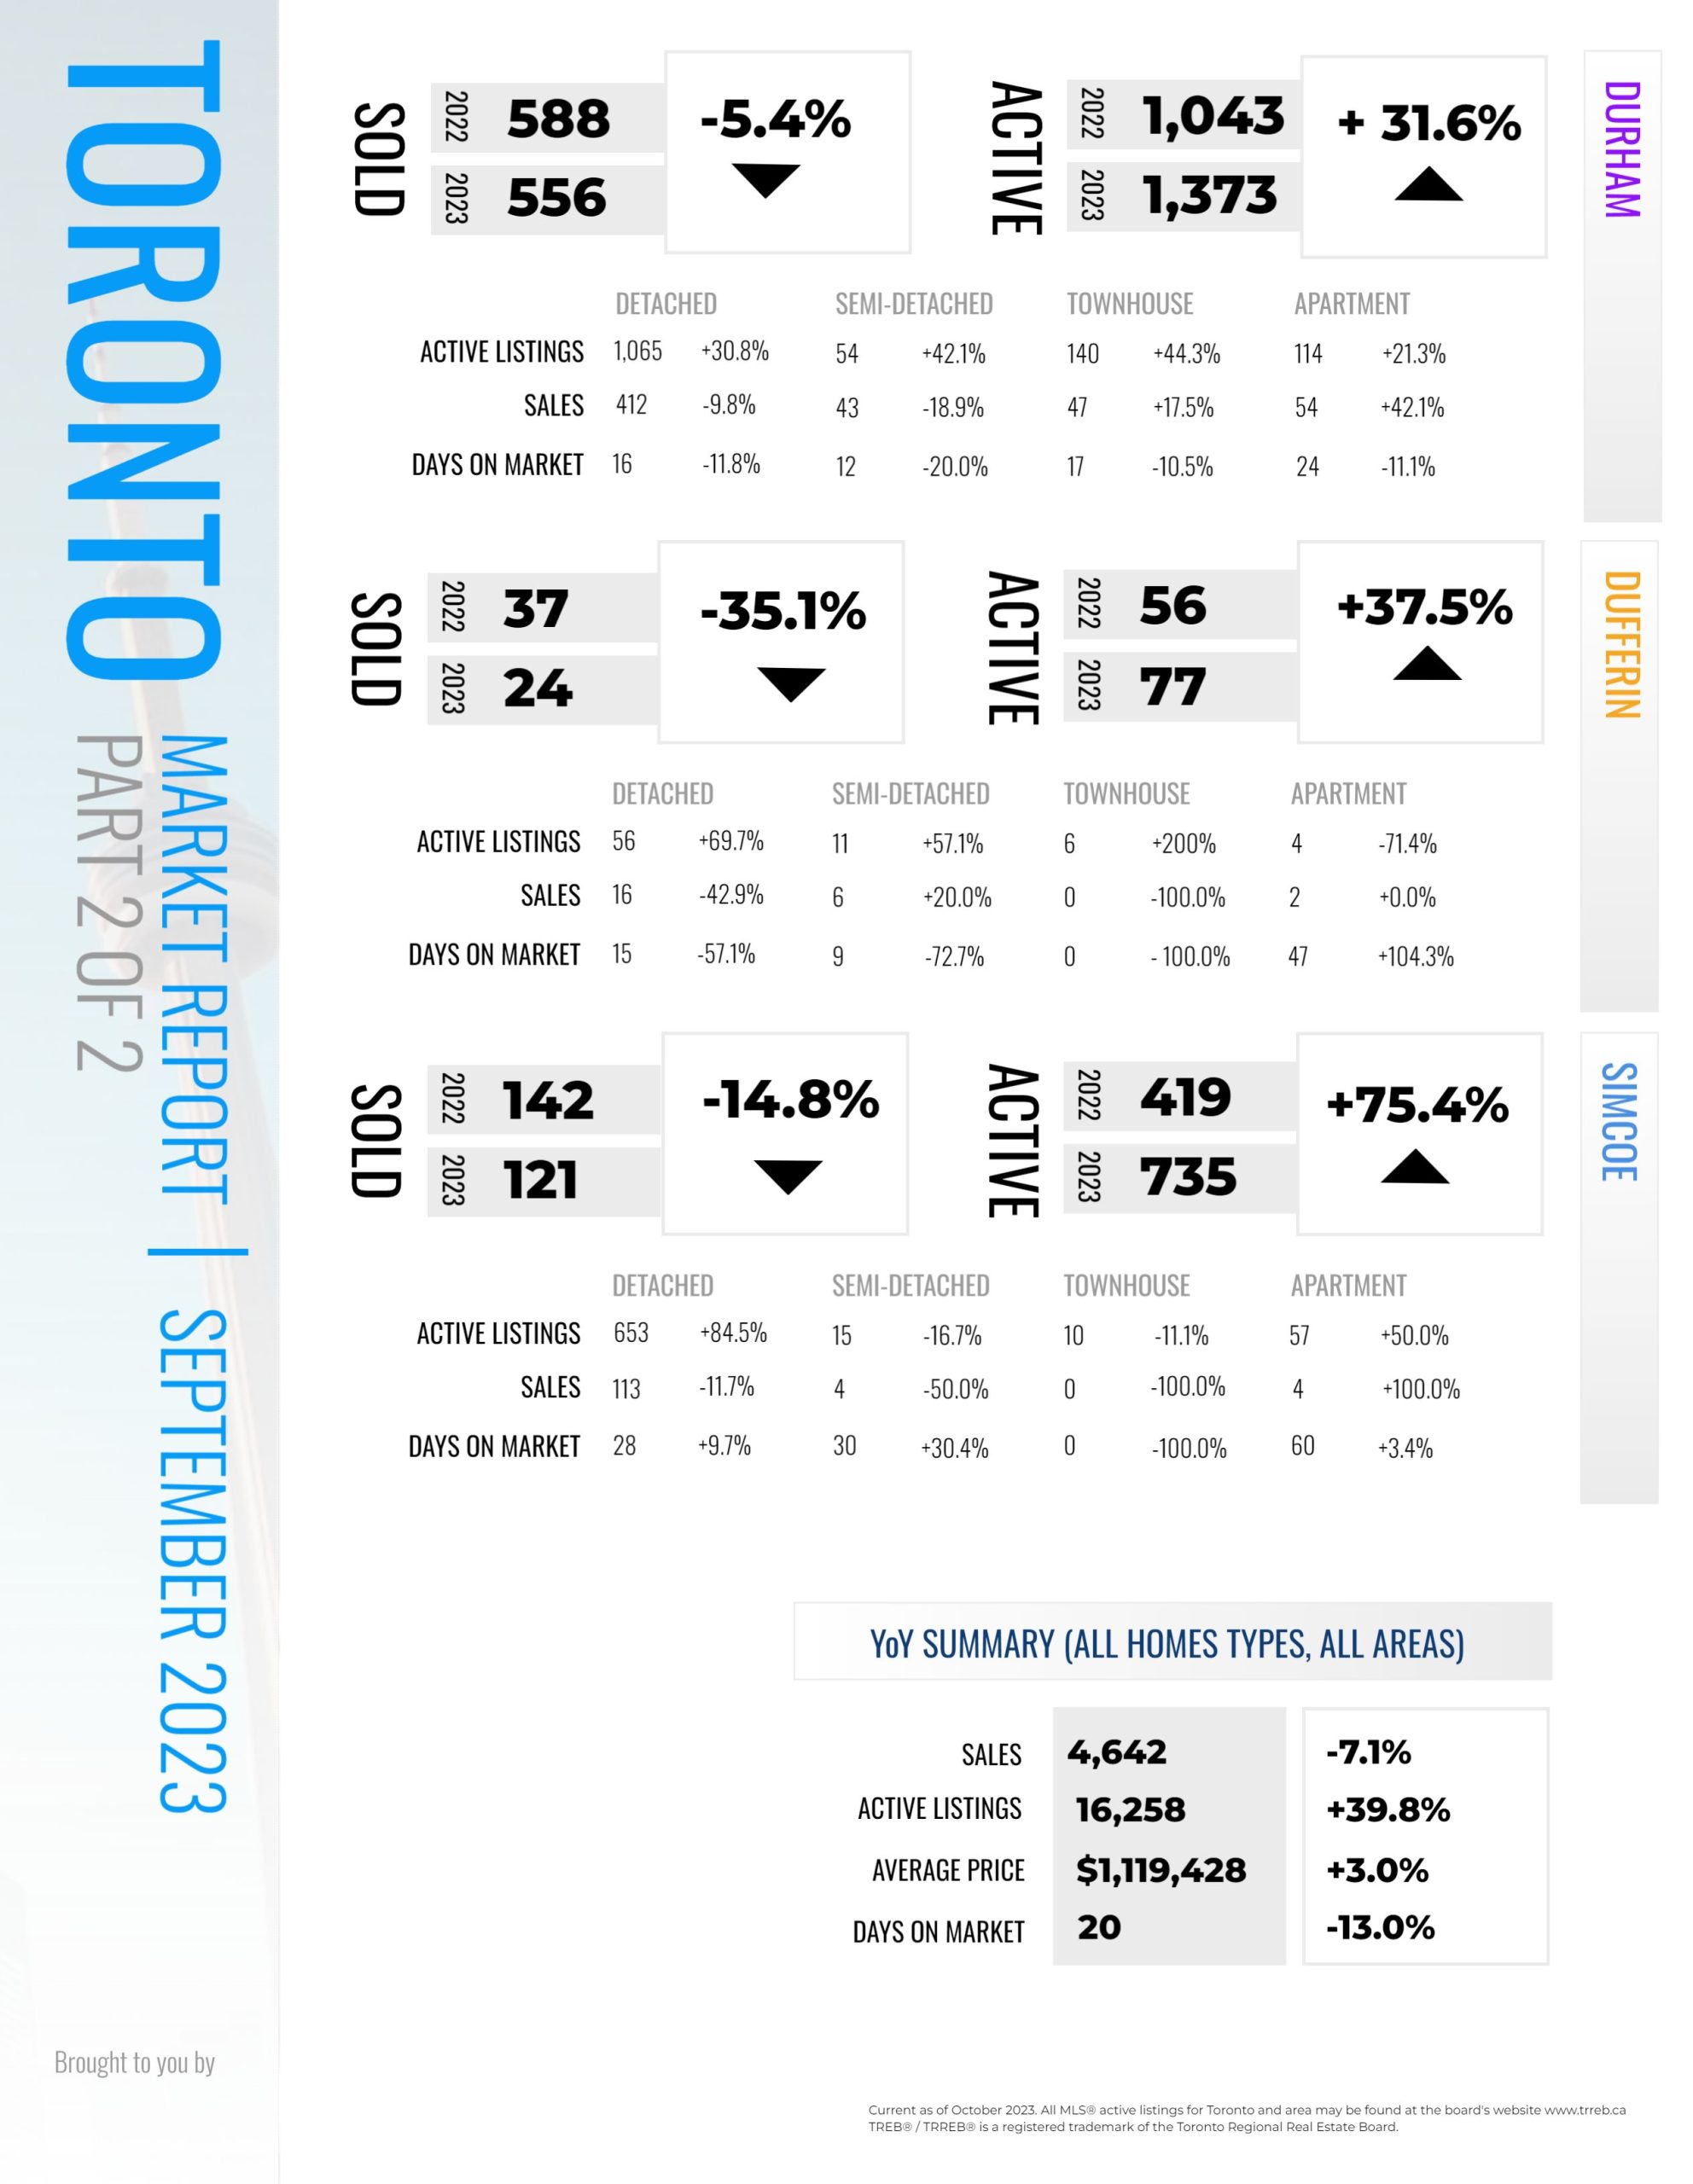
The impact of high borrowing costs, high inflation, uncertainty surrounding future Bank of Canada decisions and slower economic growth continued to weigh on Greater Toronto Area (GTA) home sales in September. However, despite the market being better-supplied with listings, the average selling price was up year-over-year.
“The short and medium-term outlooks for the GTA housing market are very different. In the short term, the consensus view is that borrowing costs will remain elevated until mid-2024, after which they will start to trend lower. This suggests that we should start to see a marked uptick in demand for ownership housing in the second half of next year, as lower rates and record population growth spur an increase in buyers,” said TRREB President Paul Baron.
REALTORS® reported 4,642 home sales through TRREB’s MLS® System in September 2023 – down 7.1 per cent compared to September 2022. The year-over-year dip in sales was more pronounced for ground-oriented homes, particularly semi-detached houses and townhouses. On a month-over-month seasonally-adjusted basis, sales were also down slightly.
Read the full report on TRREB website!
The following data is a comparison between September 2023 and September 2022 numbers, and is current as of October 2023. For last month’s numbers, check out our previous infographic!
Or follow this link for all our TREB / TRREB Infographics!
Download Printable Version – September 2023 TRREB, Toronto Market Report Part 1
Download Printable Version – September 2023 TRREB, Toronto Market Report Part 2
Last Updated on November 28, 2023 by myRealPage
