INFOGRAPHICS: September 2024 CREB City And Region Market Reports

New listing growth driven by higher-priced homes
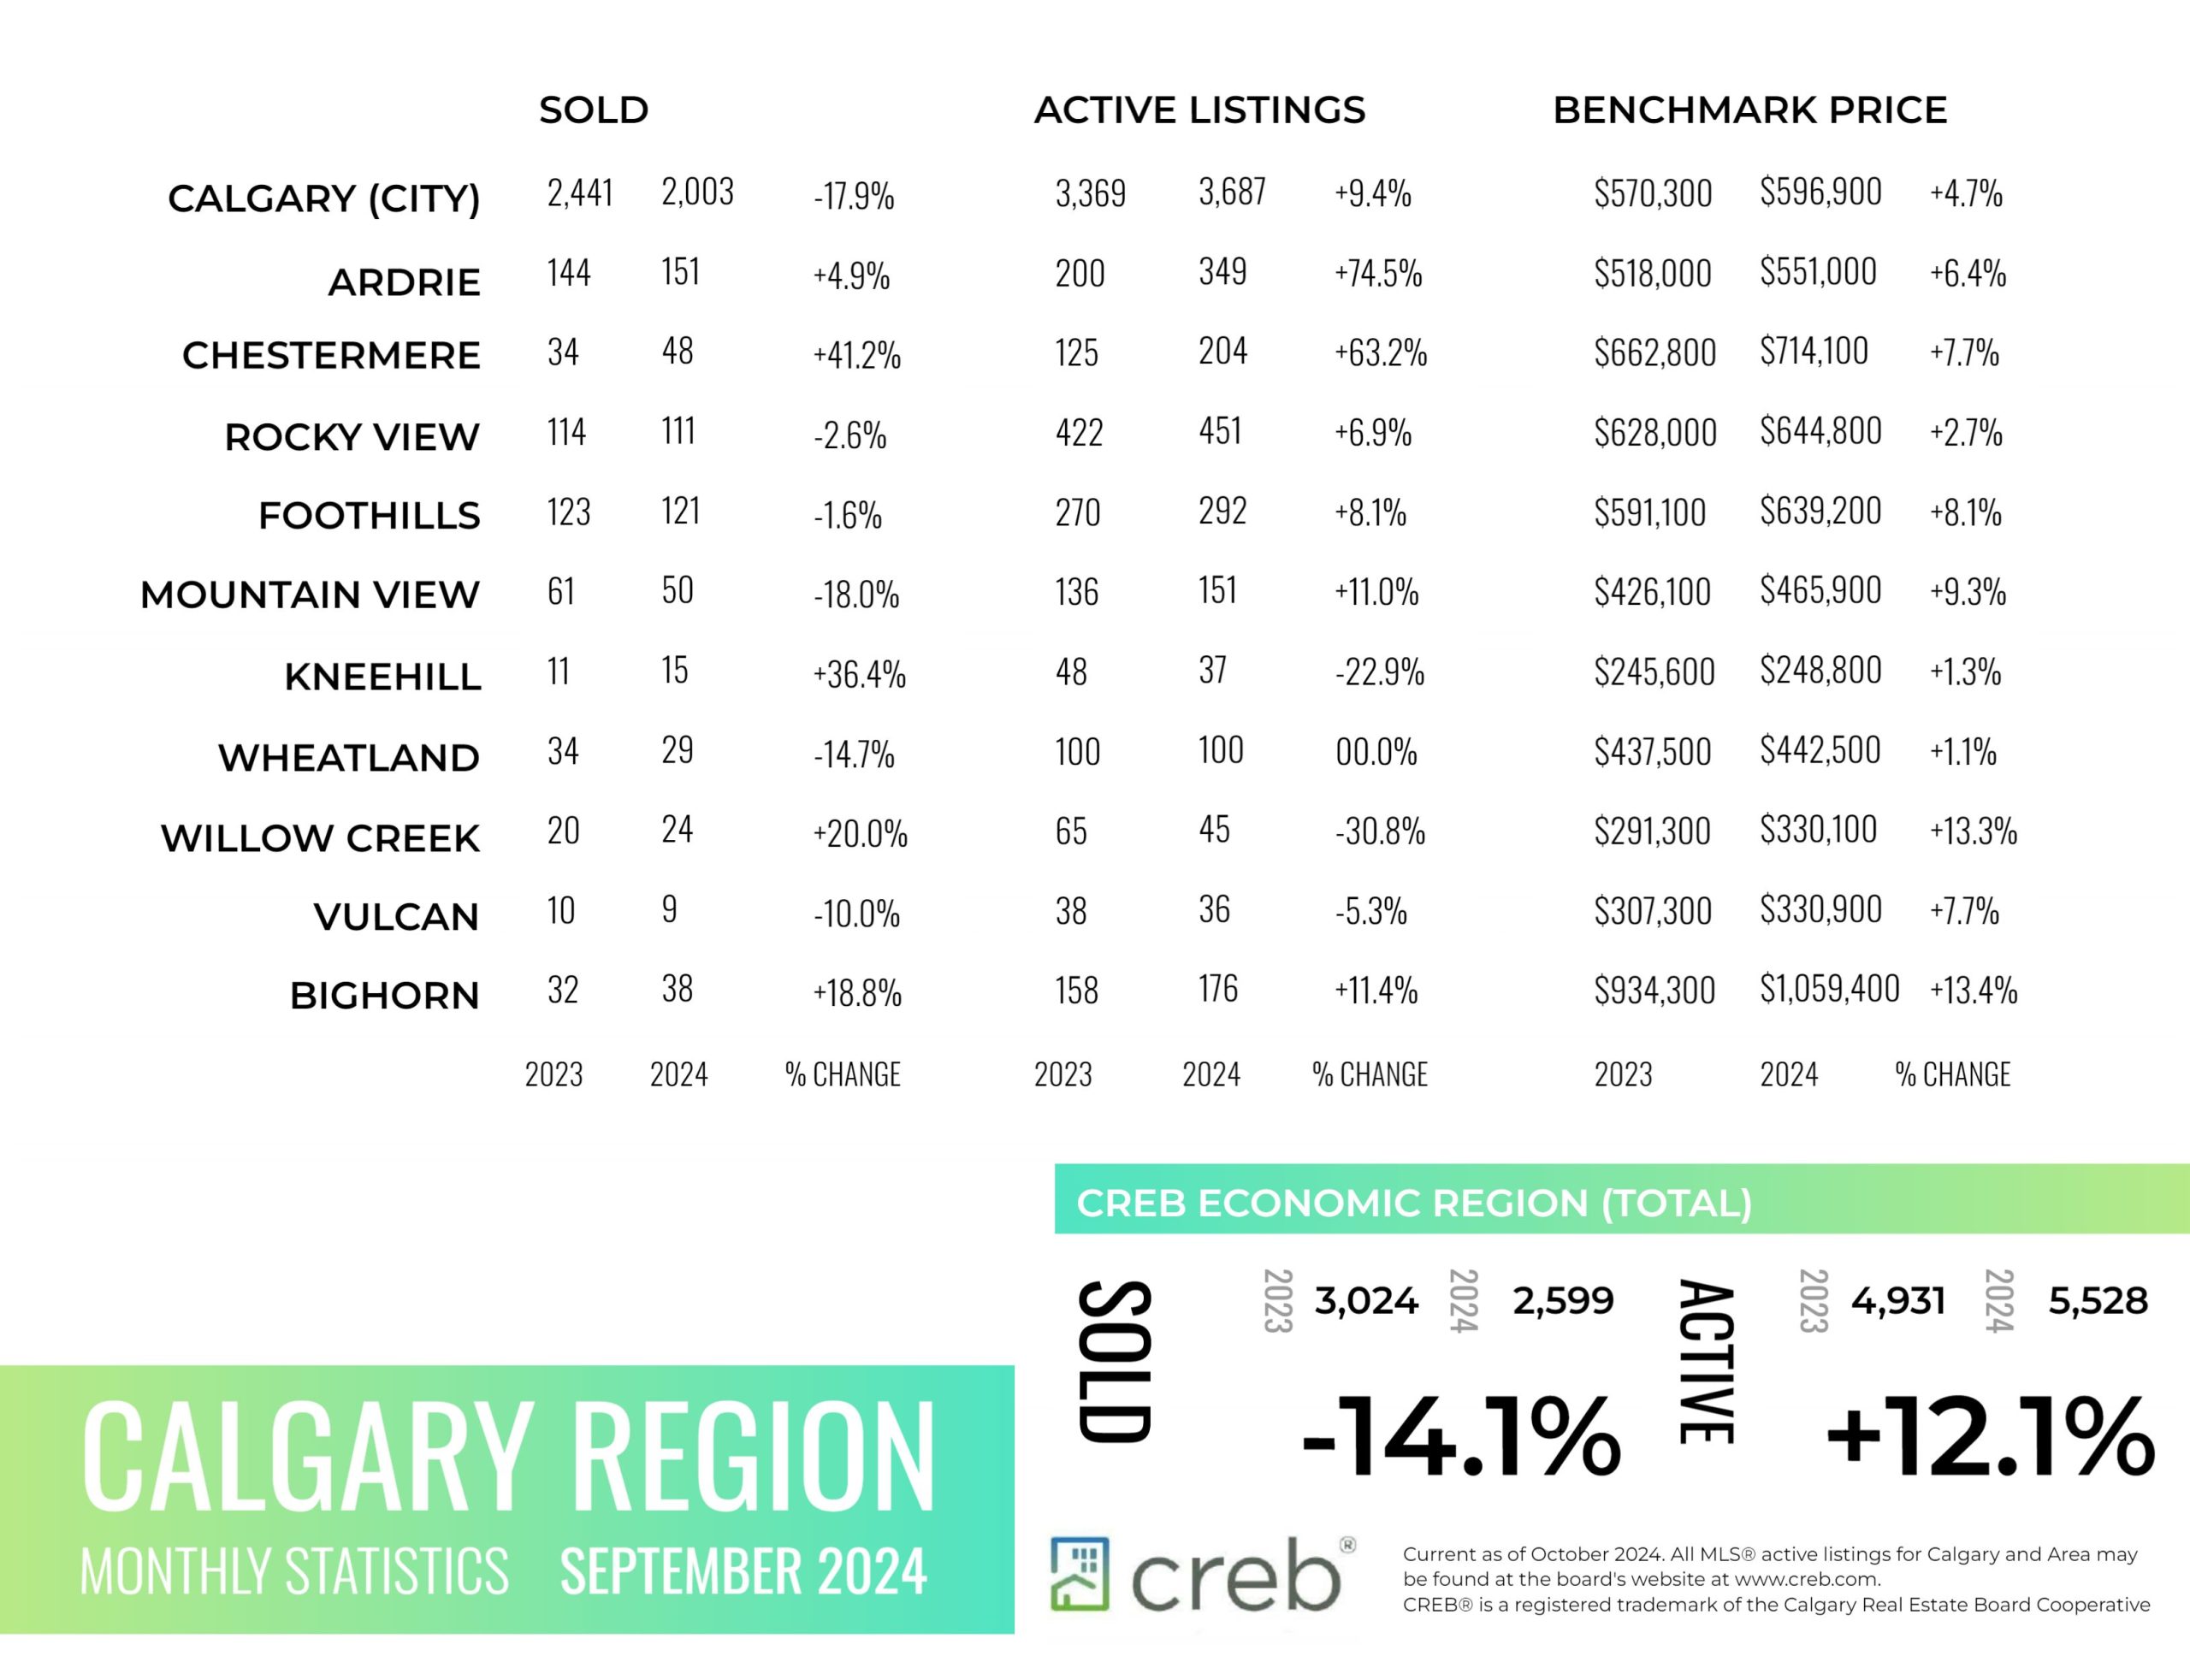
Rising sales in the upper price ranges were not enough to offset the pullback occurring in the lower price ranges, as sales in September were 2,003, 17 per cent below last year’s record high. Despite the decline, sales this month were still over 16 per cent higher than levels traditionally achieved in September.
“We are starting to see a rise in new listings in our market. However, most of the listing growth is occurring in the higher price ranges,” said Ann-Marie Lurie, Chief Economist at CREB®. “While demand has stayed strong across all price ranges, the limited choice for lower-priced homes has likely prevented stronger sales in our market. While the challenges in the lower price ranges are not expected to change, improved supply combined with lower lending rates should keep demand strong throughout the fall, but without the extreme seller market conditions that contributed to the rapid price growth earlier this year.”
New listings in September rose to 3,687 units, the highest September total since 2008. This rise in new listings compared to sales did support some inventory growth. September inventory levels pushed up to 5,064 units, nearly double the exceptionally low levels reported in the spring, but remain below the 6,000 units we typically see in September.
Read the full report on the CREB website!
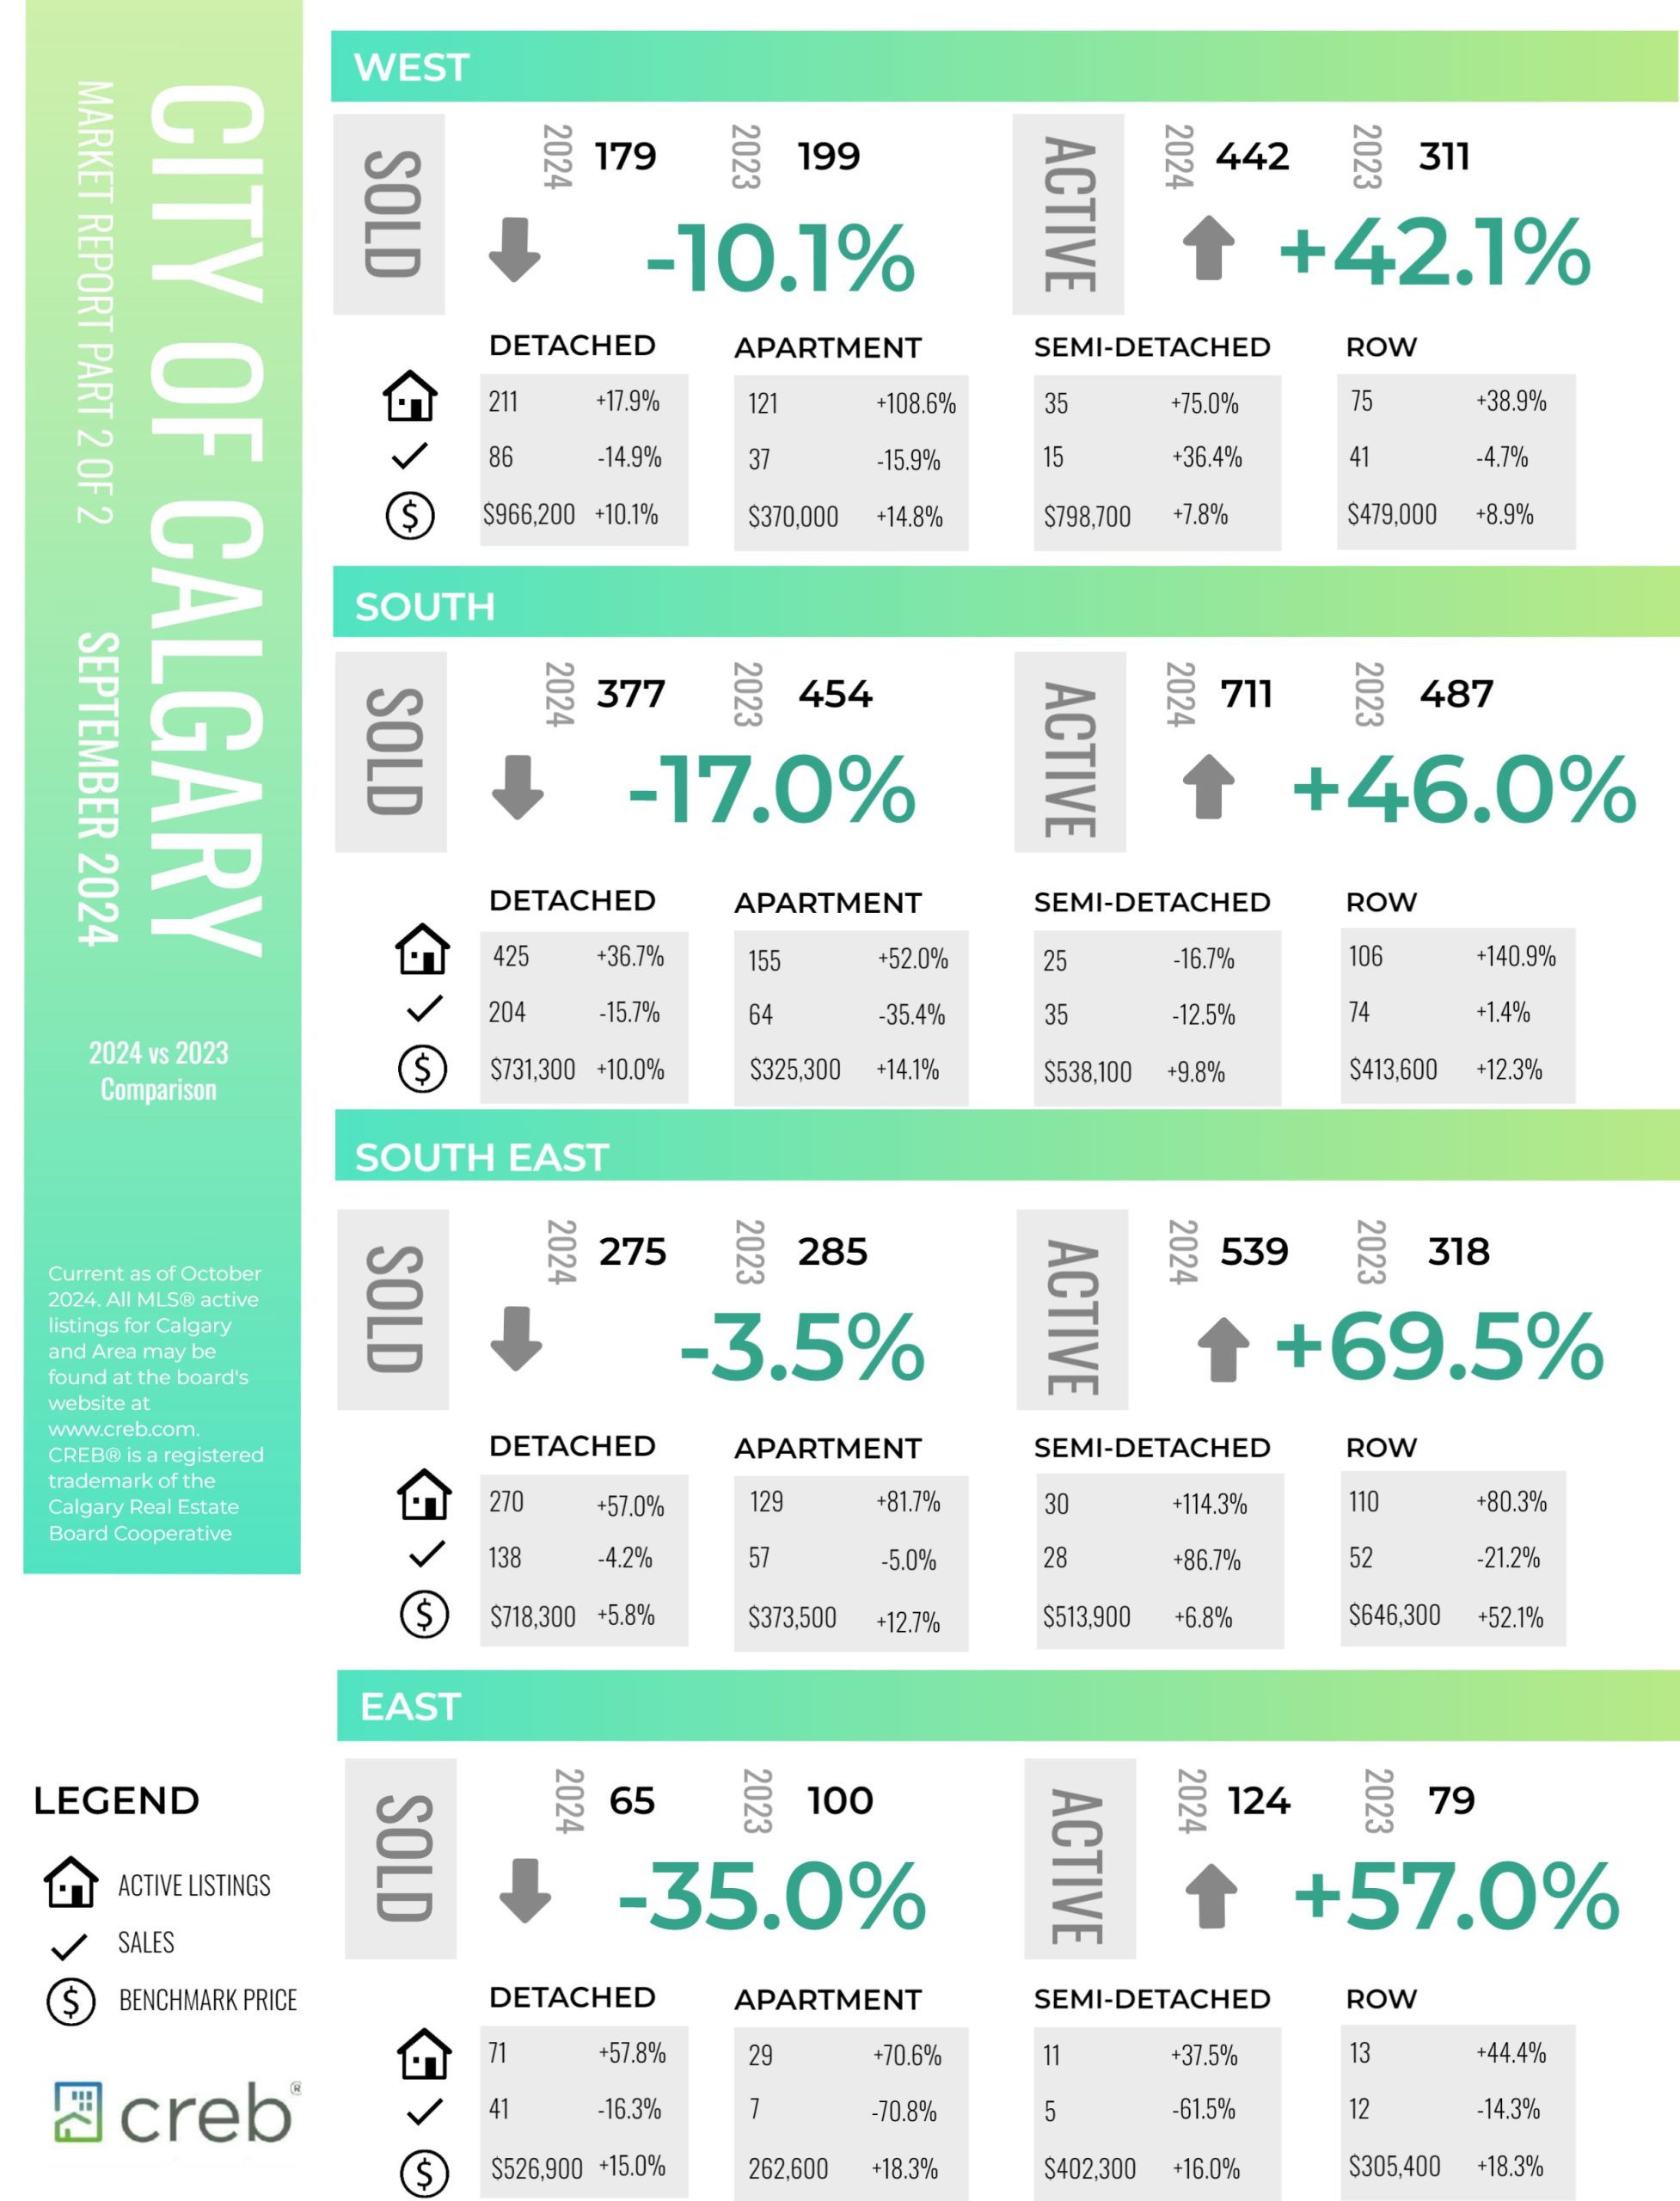
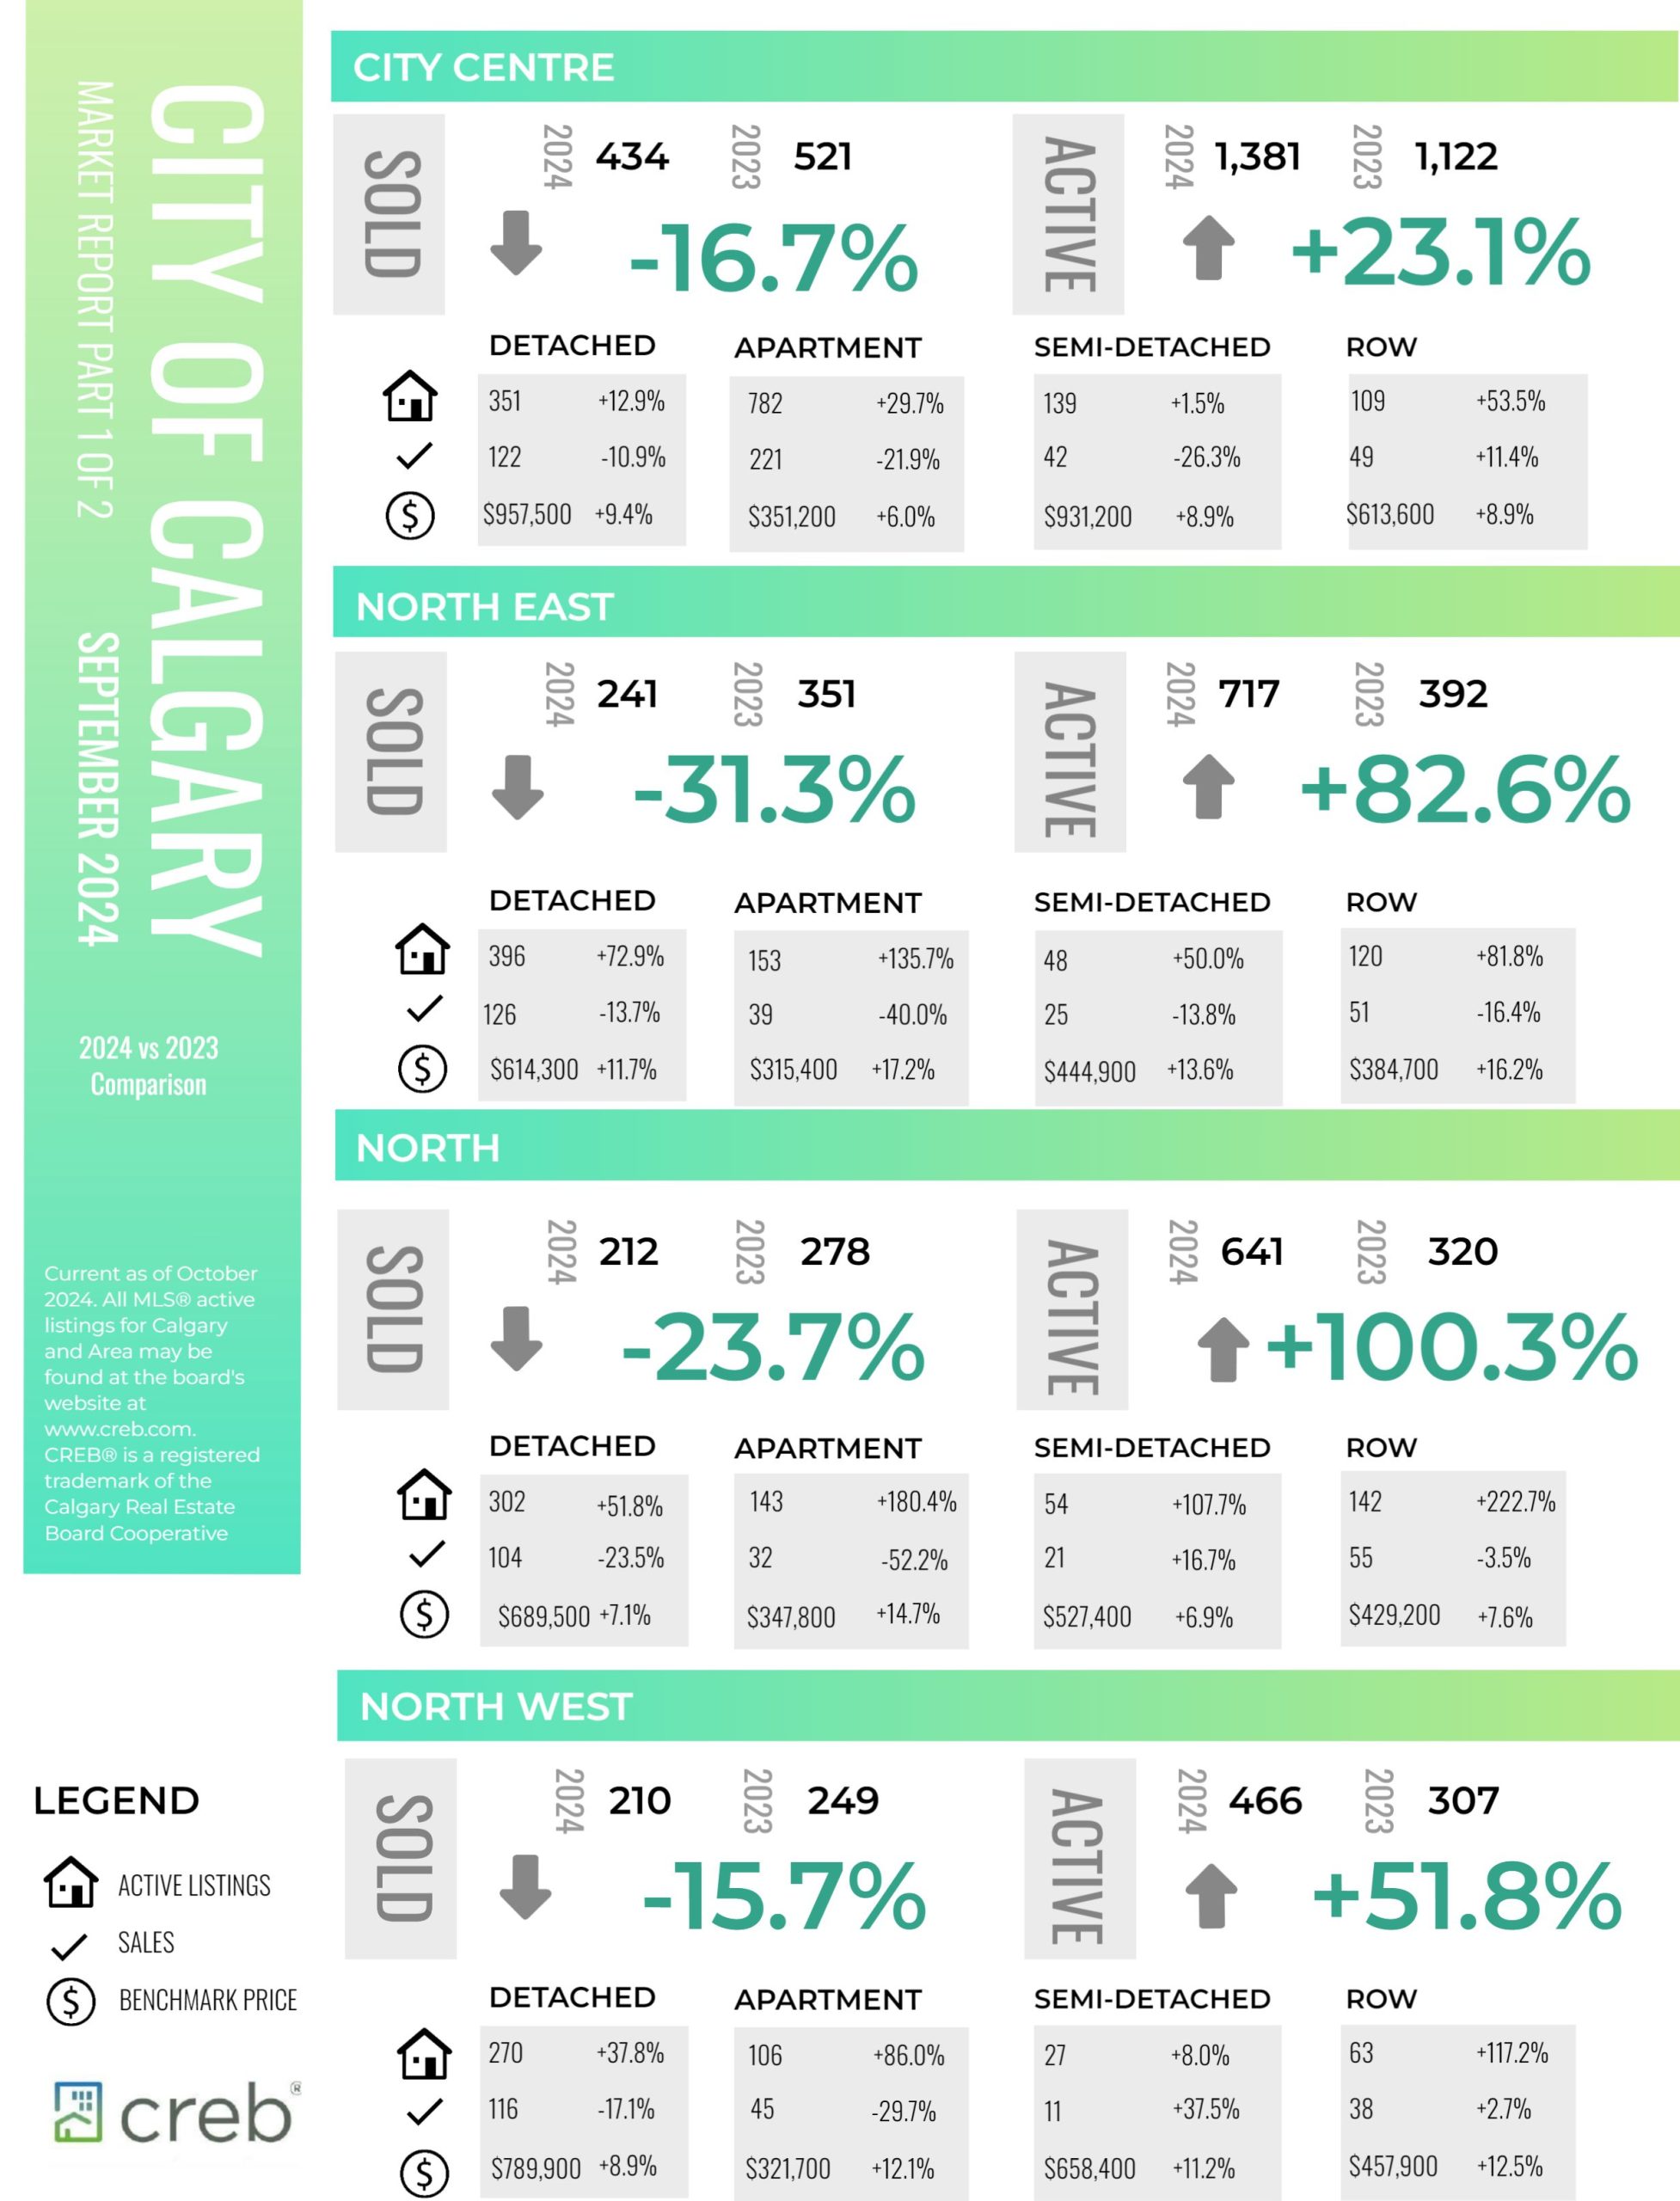
The following data is a comparison between September 2024 and September 2023 numbers, and is current as of October of 2024. For last month’s numbers, check out our previous infographic.
Or follow this link for all our CREB Infographics!
Click on the images for a larger view!
Download Printable Version – September 2024 CREB, City of Calgary Report Pages 1 and 2
Download Printable Version – September 2024 CREB, Calgary Region Report
Last Updated on October 9, 2024 by myRealPage
