INFOGRAPHICS: October 2020 RAE Edmonton Market Reports

Residential Unit Sales up 26.34% compared to October 2019.
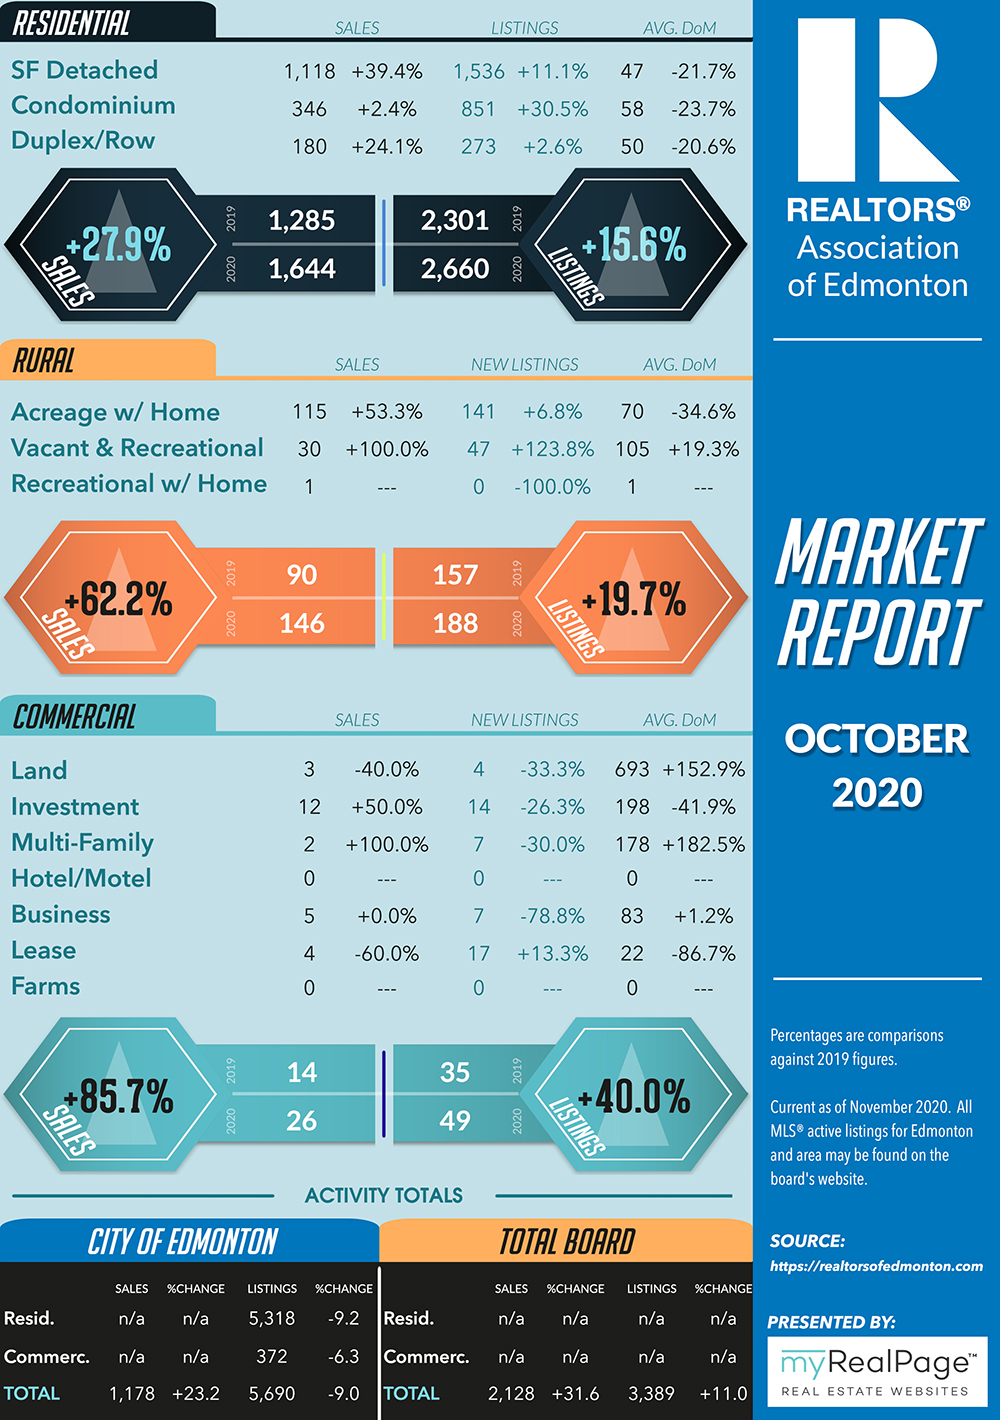
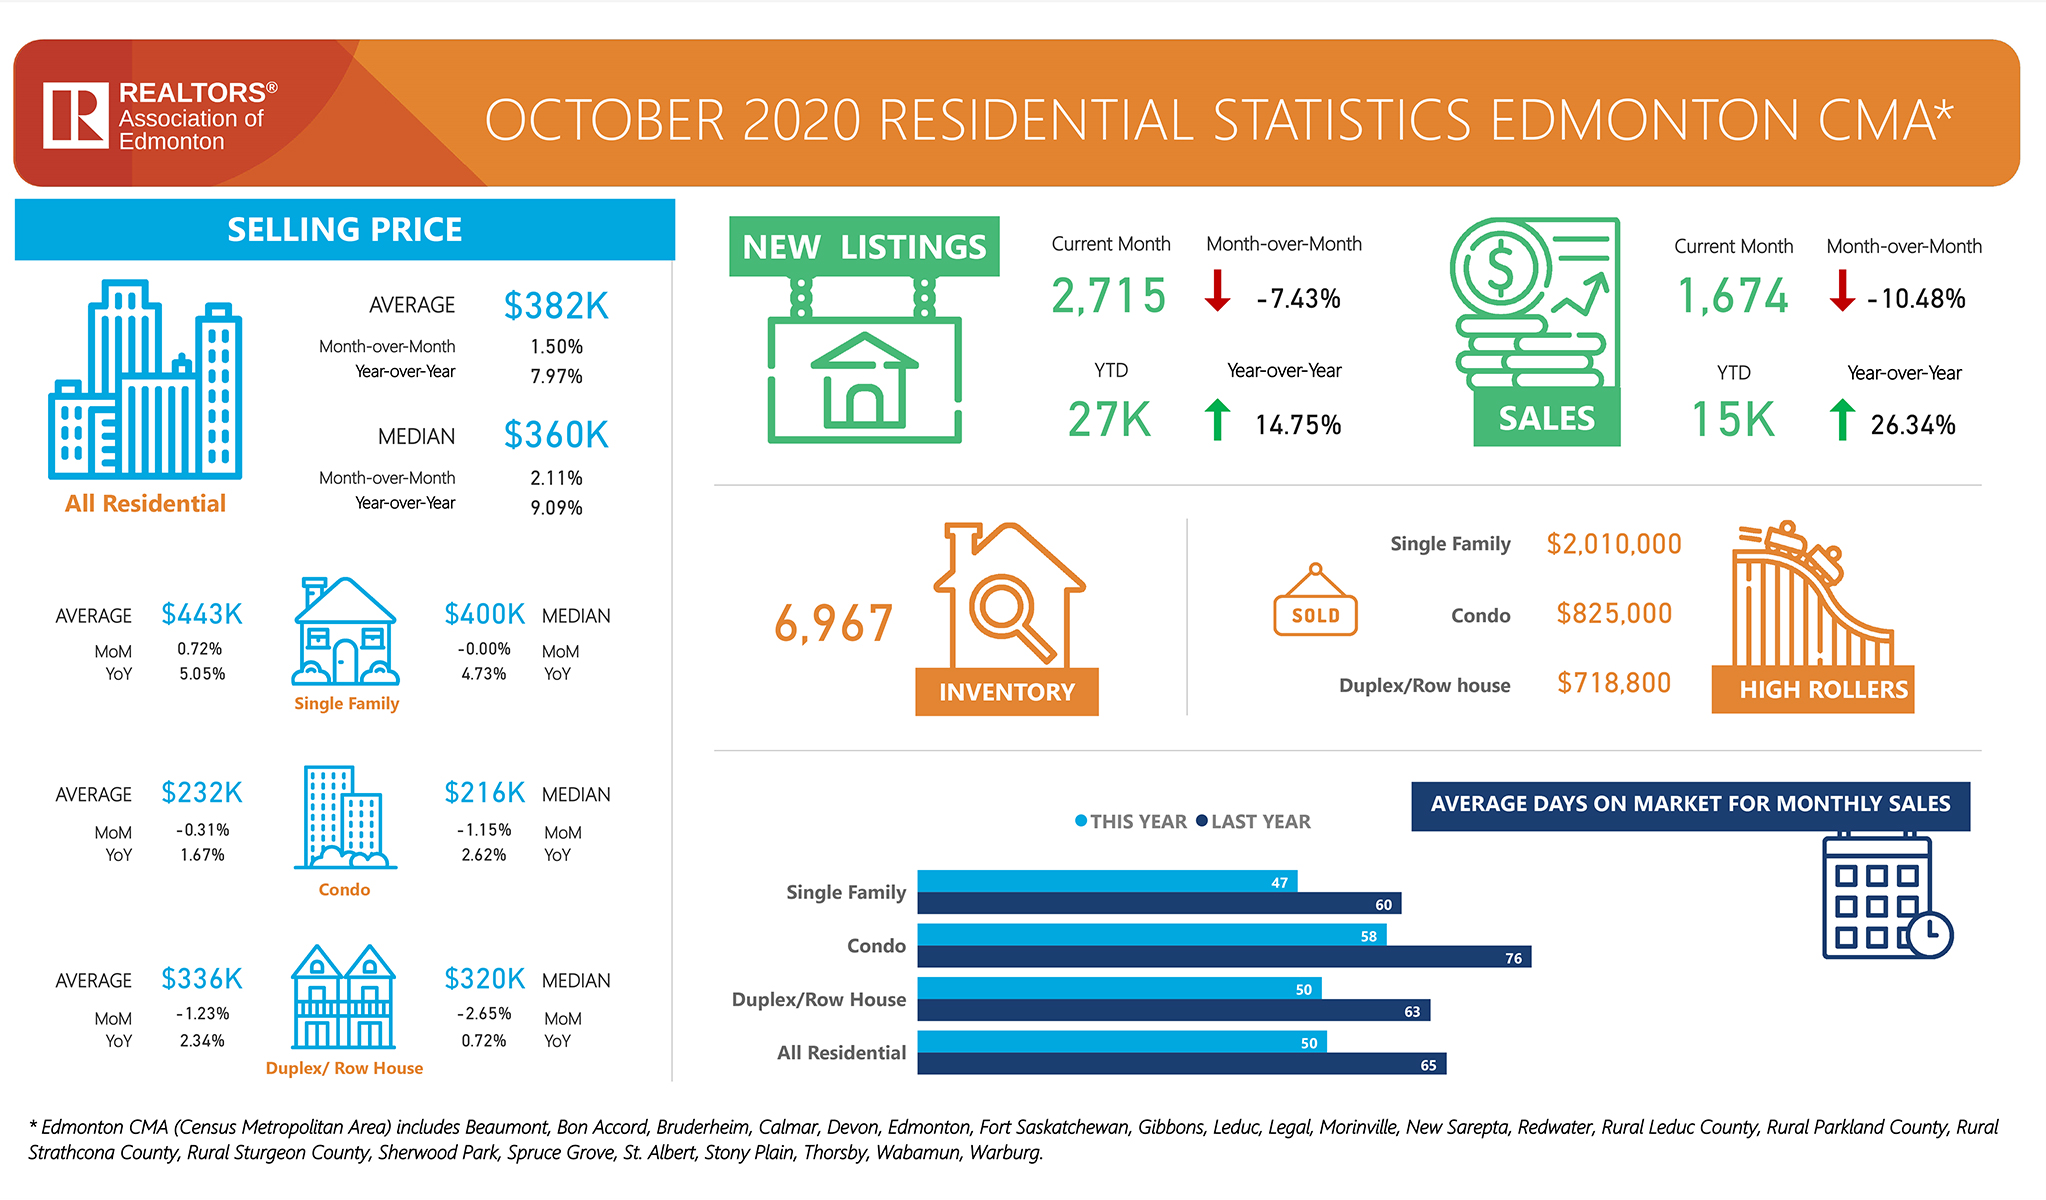
Total residential unit sales in the Edmonton Census Metropolitan Area (CMA) real estate market for October 2020 increased 26.34% compared to October 2019 and decreased 0.21% from September 2020. The number of new residential listings is up year over year, increasing 14.75% from October 2019. New residential listings are down month over month, decreasing 7.43% from September 2020. Overall inventory in the Edmonton CMA fell 12.10% from October of last year and decreased 3.88% from September 2020.
For the month of October, single family home unit sales are up 38.02% from October 2019 and decreased 5.89% from September 2020 at 1,118. Condo unit sales increased 2.37% from October 2019 and decreased 13.28% from September 2020.
Read the full report on the RAE website.
The following data is a comparison between October 2019 and October 2020 numbers, and is current as of November 2020. For last month’s numbers, check out our previous RAE infographic!
You can also click here to view all our Edmonton inforgraphics.
Click on the images for a larger view! (Protip: Make sure to grab the printable PDF versions, too! It fits best when printed on A4-sized sheets, AND we’ve added an area on the sheet where you can attach your business card! 🙂 )
Download Printable Version – October 2020 RAE, Edmonton Report
-
- (Image from RAE website)
-

- (Image from RAE website)
Last Updated on July 25, 2022 by myRealPage
