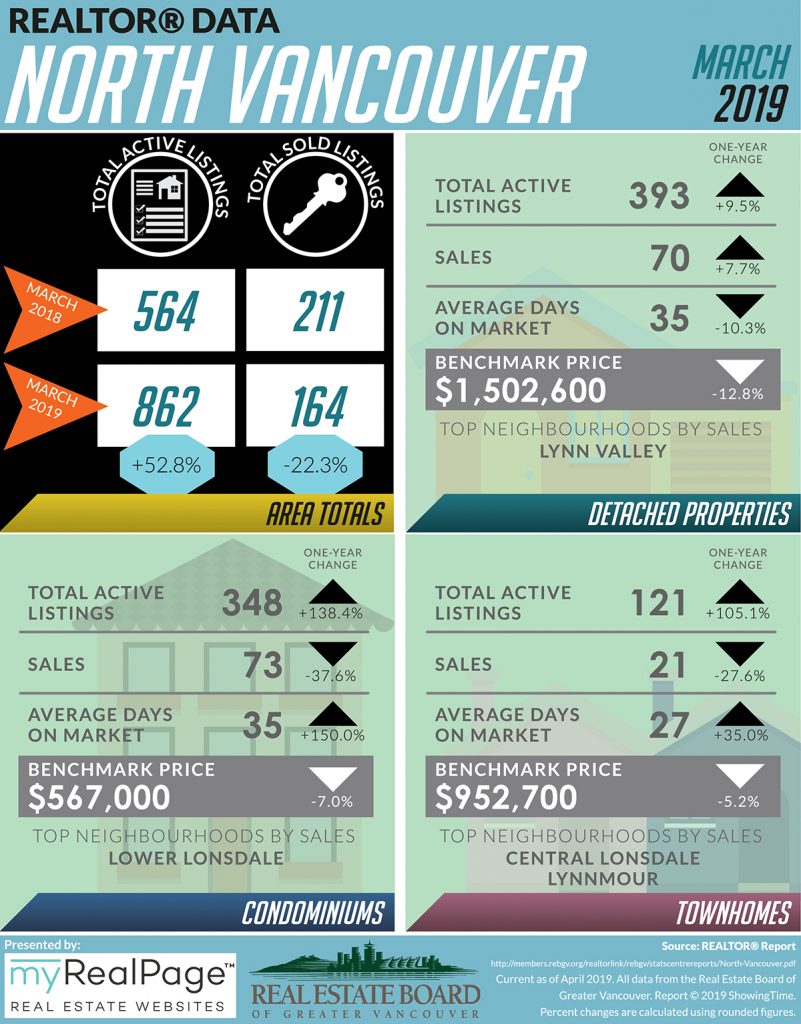
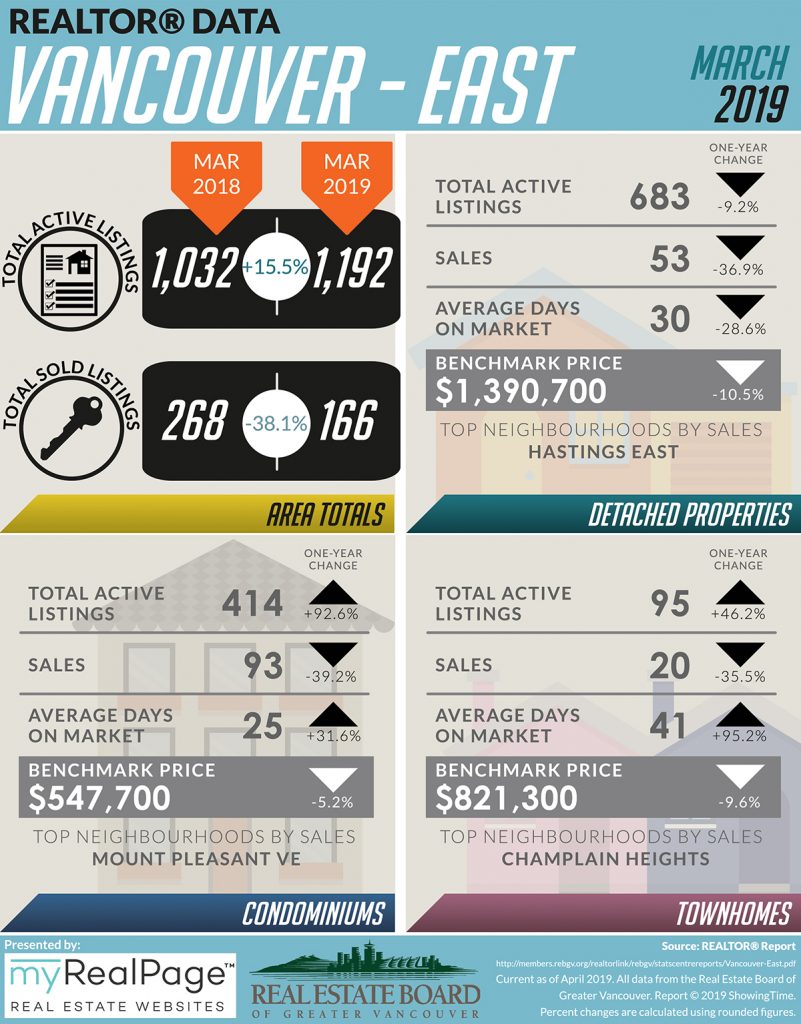
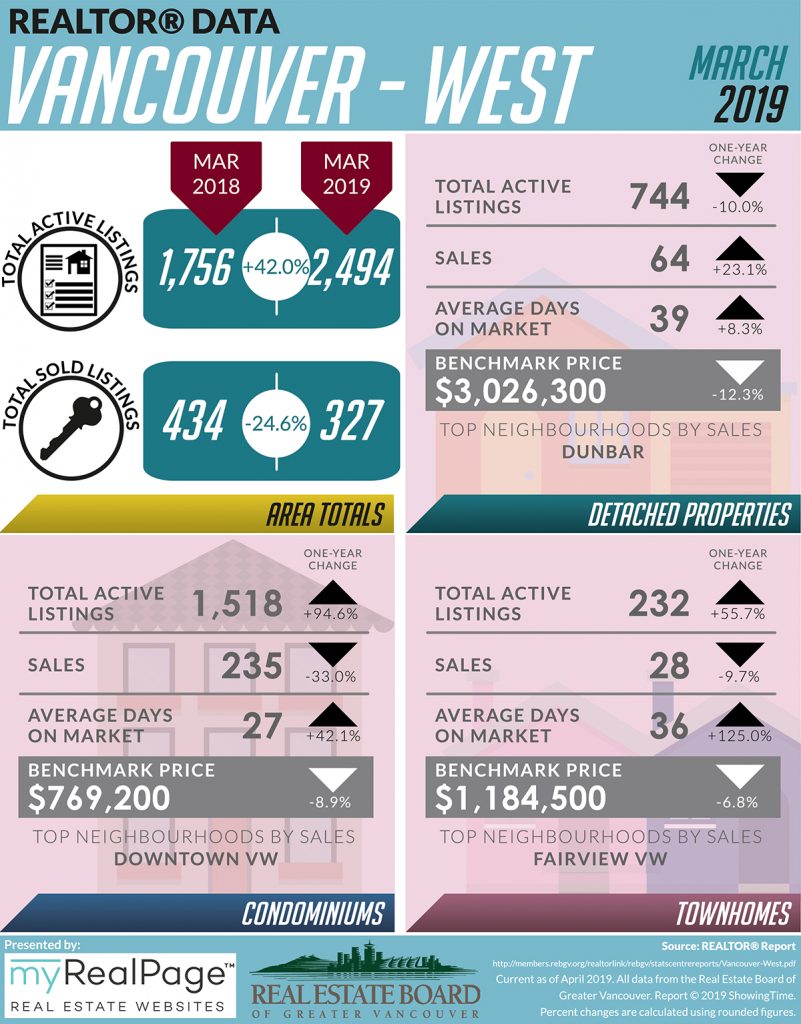
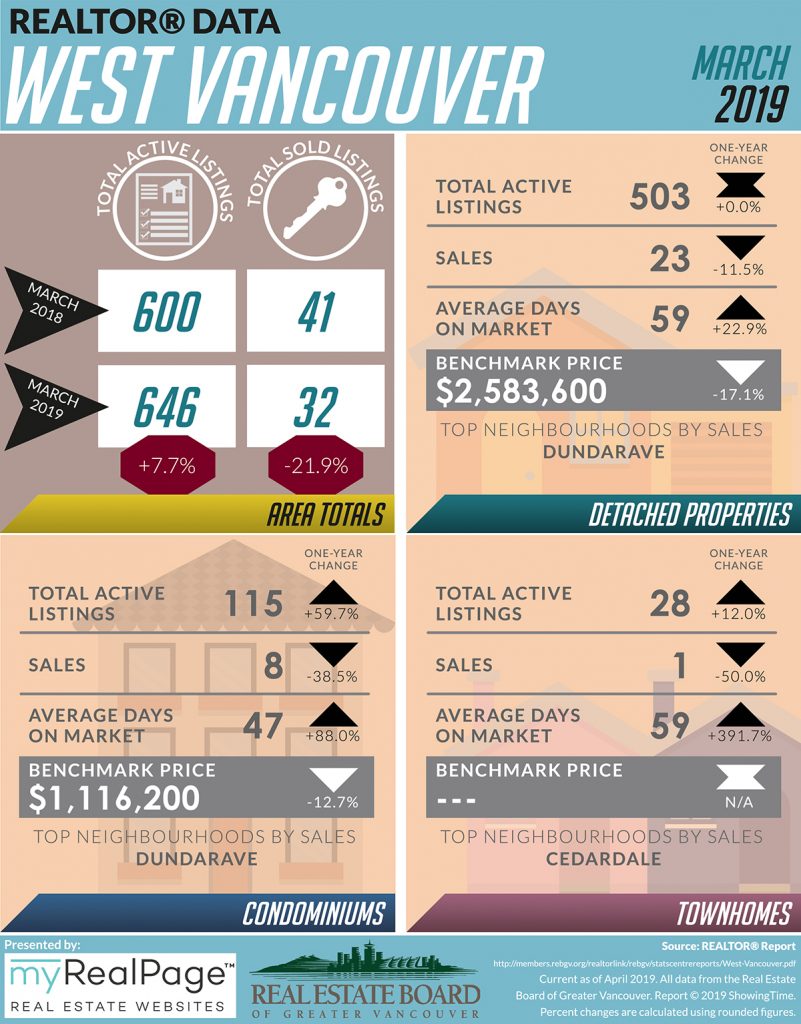
INFOGRAPHICS: March 2019 REBGV Greater Vancouver Market Reports

And in the blink of an eye, the first quarter of the year is behind us. Meanwhile, it’s once again time for our monthly market update for areas covered by the Real Estate Board of Greater Vancouver (REBGV)!
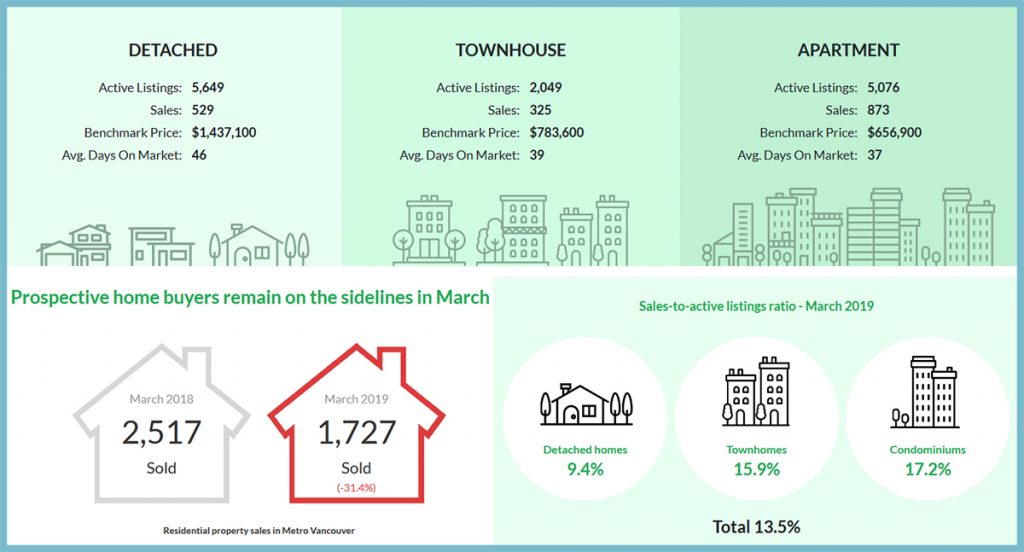
According to REBGV’s latest news release, Metro Vancouver home sales dipped to the lowest levels seen in March in more than three decades.
The board reports that residential home sales in the region totalled 1,727 in March 2019, a 31.4% decrease from the 2,517 sales recorded in March 2018, and a 16.4% increase from the 1,484 homes sold in February 2019.
As noted by REBGV president Ashley Smith,
“Housing demand today isn’t aligning with our growing economy and low unemployment rates. The market trends we’re seeing are largely policy induced.
For three years, governments at all levels have imposed new taxes and borrowing requirements on to the housing market.
What policymakers are failing to recognize is that demand-side measures don’t eliminate demand, they sideline potential home buyers in the short term. That demand is ultimately satisfied down the line because shelter needs don’t go away. Using public policy to delay local demand in the housing market just feeds disruptive cycles that have been so well-documented in our region.”
Generally, analysts say downward pressure on home prices occurs when the ratio dips below 12% for a sustained period, while home prices often experience upward pressure when it surpasses 20% over several months.
The following data is a comparison between March 2018 and March 2019 numbers, and is current as of April 2019. For last month’s update, you can check out our previous post for February 2019 data.
Or follow this link for all our REBGV Infographics!
These infographics cover current trends in North Vancouver, West Vancouver, Vancouver East, and Vancouver West.
Click on the images for a larger view!
(Protip: Make sure to grab the printable PDF versions, too! It fits best when printed on A4-sized sheets, AND we’ve added an area on the sheet where you can attach your business card! 🙂 )
Download Printable Version – REBGV March 2019 Data Infographics
(Image from: rebgv.org)
Last Updated on July 25, 2022 by myRealPage


