INFOGRAPHICS: July 2019 VIREB Vancouver Island Market Reports

It’s early August and it’s once again time for our monthly market updates for areas covered by the Vancouver Island Real Estate Board (VIREB)!
As noted in their most recent media release, housing sales within VIREB has been holding steady for the month of July, and in some areas, it has even been described as brisk.
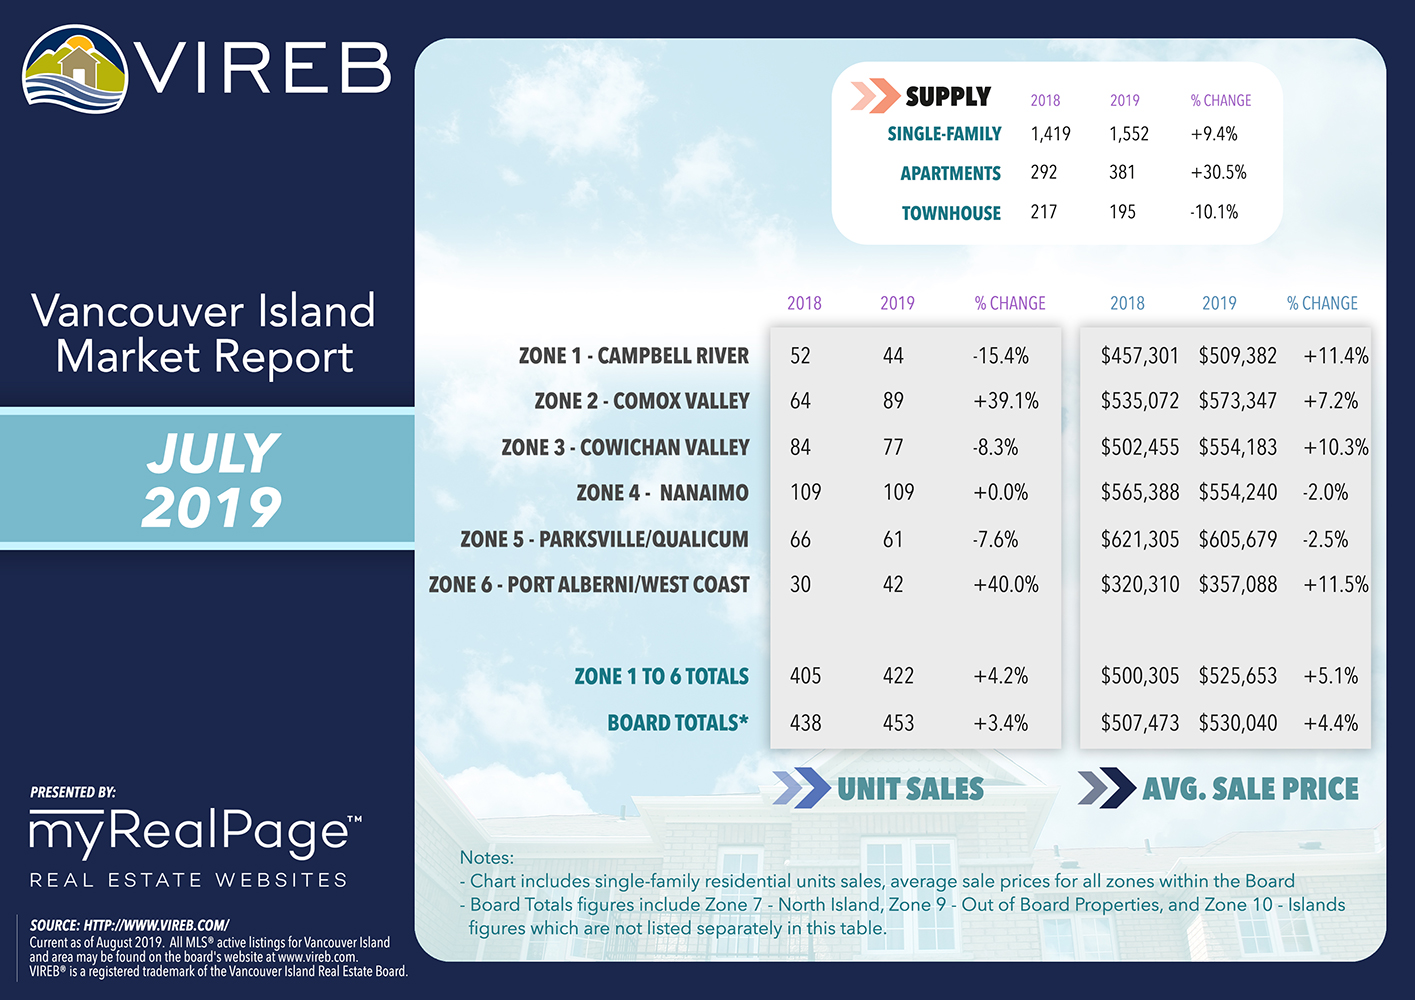
Sales of single-family homes in July board-wide rose by three% year over year and were 12% higher than in June. Last month, 453 single-family homes sold on the MLS compared to 406 the previous month and 438 in July 2018. Sales of apartments dropped by 14% year over year while townhouse sales increased by 22%.
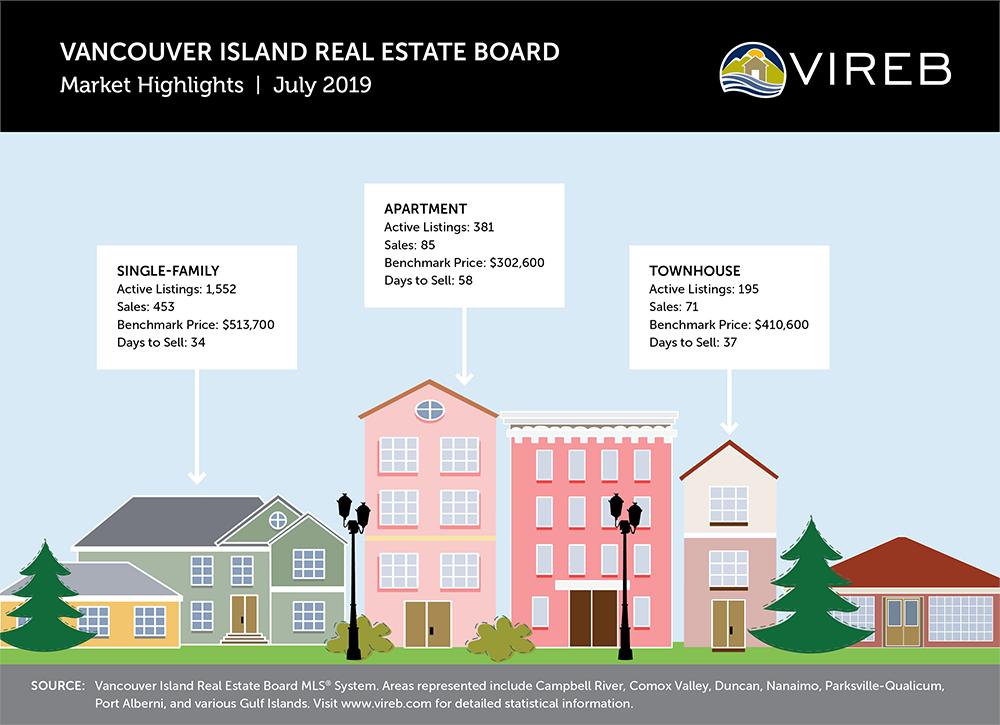
While there has been a positive trend, it is certainly less robust than they were in 2016, 2017, and 2018. Weaker housing demand has contributed to an increase in total active residential listings across the province. In the VIREB area, inventory of single-family homes in July rose by 9% from one year ago (1,419 to 1,552). Active listings of apartments climbed by 30% (292 to 381) year over year but townhouse inventory decreased by 10% (217 to 195).
Prices in the VIREB area are still rising, but they are softening compared to the price increases posted during our long-running sellers’ market. The benchmark price of a single-family home was $513,700 in July, a 3% increase from one year ago and slightly lower than in June. In the apartment category, the year-over-year benchmark price rose by 5%, climbing to $302,600, but was slightly lower than in June. The benchmark price of a townhouse rose by 2%, hitting $410,600 last month, the same price as in June.
Trend-wise, VIREB’s housing market has transitioned from one favouring sellers to one that is balanced. Kevin Reid, 2019 President-Elect, reports that sellers now recognize that the market has shifted and are pricing their homes accordingly.
However, he notes that the release of home assessments has caused some confusion among homeowners, who are not always aware the assessed value reflects trends that are several months behind the current market value, which is frequently lower.
The following data is a comparison between July 2018 and July 2019 numbers, and is current as of August 2019. Click here to check out last month’s infographics.
You can also view all our VIREB infographics by clicking here.
Click on the images for a larger view!
(Protip: Make sure to grab the printable PDF versions, too! It fits best when printed on A4-sized sheets, AND we’ve added an area on the sheet where you can attach your business card! 🙂 )
Download Printable Version – July 2019 VIREB Market Report
(Image Source: VIREB Twitter)
Last Updated on July 25, 2022 by myRealPage
