INFOGRAPHICS: June 2019 VIREB Vancouver Island Market Reports

We’ve reached the second half of the year, and it is once again time for our monthly market updates for areas covered by the Vancouver Island Real Estate Board (VIREB)!
As noted in their latest market update, it appears that a weak housing market continues to persist within the VIREB.
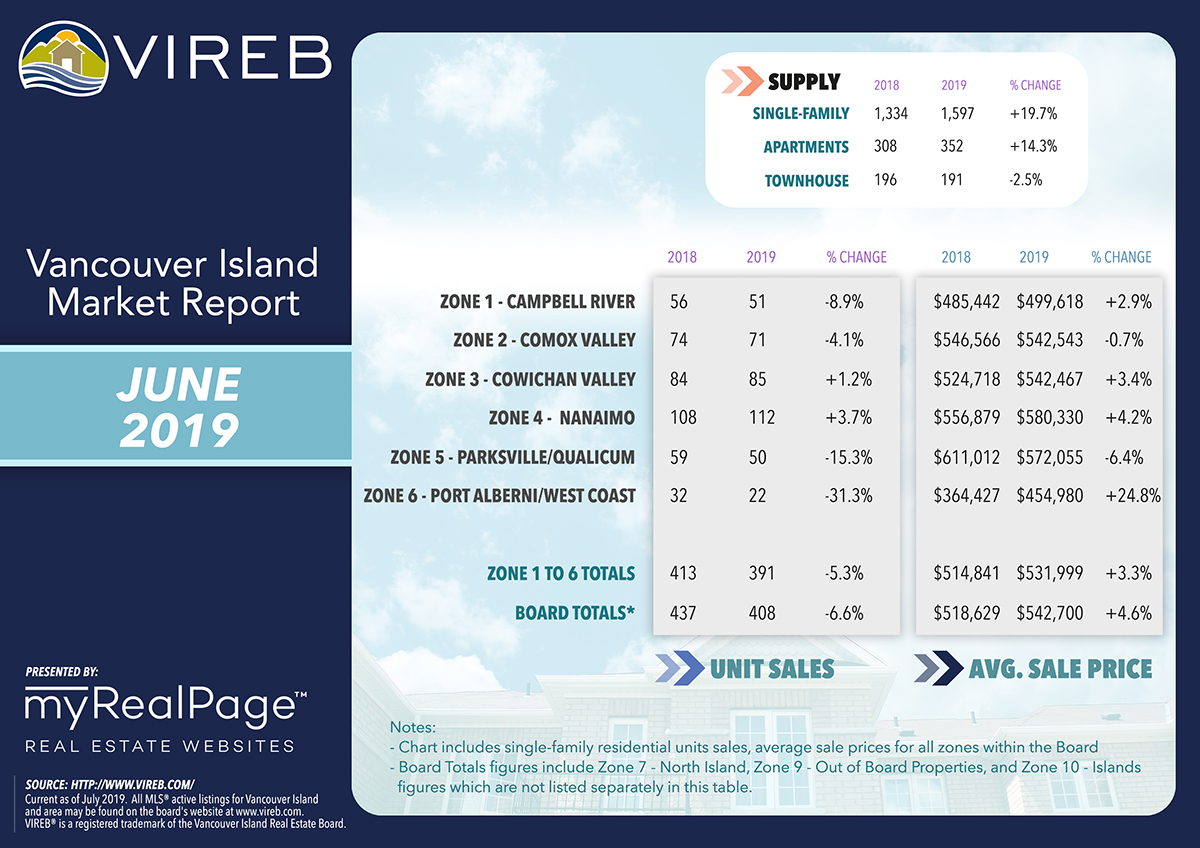
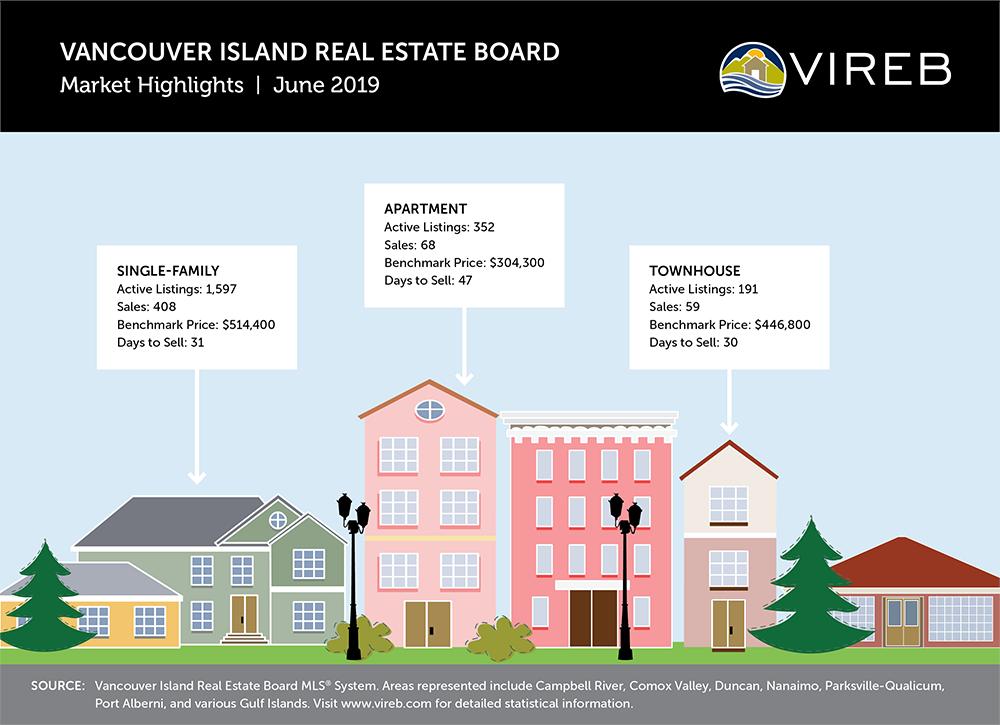
Sales of single-family homes in June board-wide dipped by 7% year over year and were 11% lower than in May. Last month, 408 single-family homes sold on the Multiple Listing Service® (MLS®) System compared to 458 the previous month and 437 in June 2018. Sales of apartments dropped by 29% year over year while townhouse sales were down by 32% from one year ago.
The mortgage stress test (Guideline B-20) continues to hurt housing sales throughout British Columbia, including Vancouver Island. Although the B.C. economy continues to be highly supportive of housing demand, the negative shock to affordability and purchasing power created by the stress test is making it extremely difficult for some buyers, particularly millennials, to enter the housing market. Even when prospective buyers can afford monthly mortgage payments, they are unable to qualify because Guideline B-20 has eroded their purchasing power by as much as 20%.
Weak housing demand has also contributed to an increase in total active residential listings across the province. In the VIREB area, inventory of single-family homes in June rose by 20%. Active listings of apartments climbed by 14% year over year, while townhouse inventory decreased by 3%.
Trend-wise, VIREB’s housing market has transitioned from one favouring sellers to one that is balanced.
According to Kaye Broens, 2019 President, buyers are very price conscious and are pursuing their home purchases cautiously, while sellers are finally realizing that they need to price their homes competitively to garner interest and a sale.
The following data is a comparison between June 2018 and June 2019 numbers, and is current as of July 2019. Click here to check out last month’s infographics.
You can also view all our VIREB infographics by clicking here.
Click on the images for a larger view!
(Protip: Make sure to grab the printable PDF versions, too! It fits best when printed on A4-sized sheets, AND we’ve added an area on the sheet where you can attach your business card! 🙂 )
Download Printable Version – June 2019 VIREB Market Report
(Image Source: VIREB Twitter)
Last Updated on July 25, 2022 by myRealPage
