INFOGRAPHICS: May 2019 VIREB Vancouver Island Market Reports

It’s another new month, and it is once again time for our monthly market updates for areas covered by the Vancouver Island Real Estate Board (VIREB)!
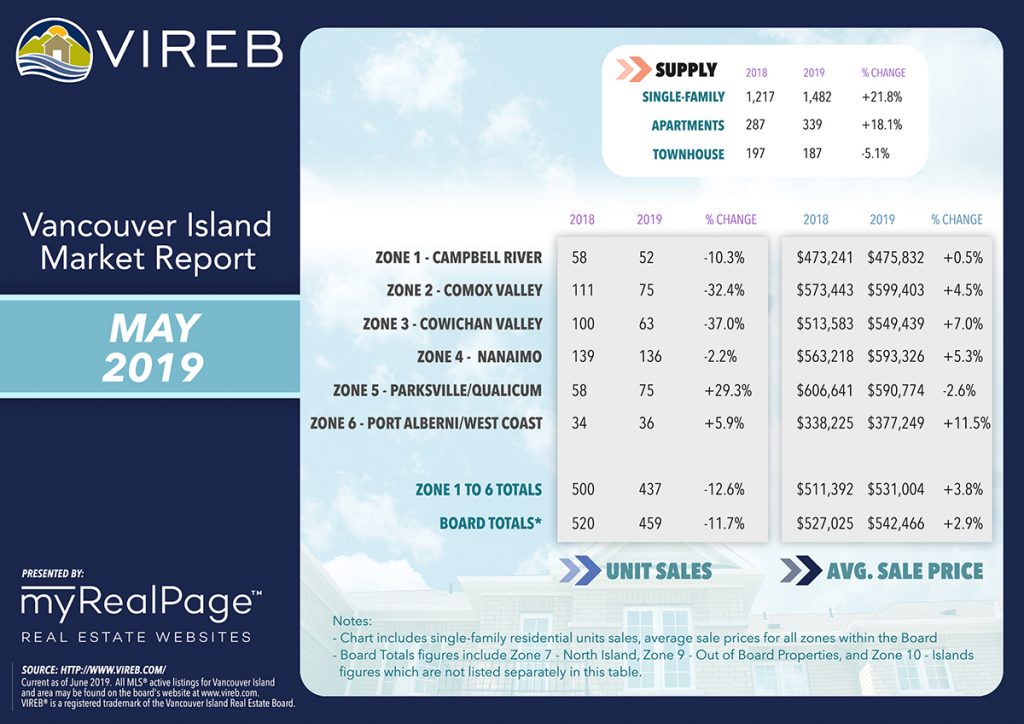
In their most recent update, it looks like the sluggish spring housing market continues for VIREB as sales of single-family homes in May board-wide dipped by 12% year over year.
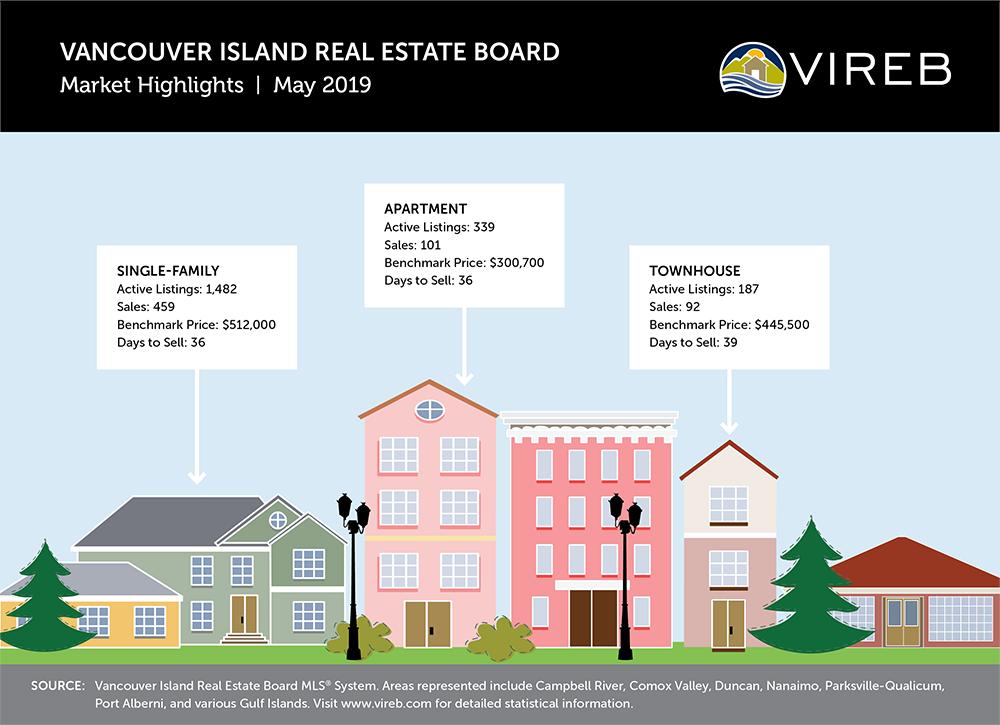
In May 2019, 459 single-family homes sold on the Multiple Listing Service® (MLS®) System compared to 412 the previous month and 519 in May 2018. Sales of apartments dipped by 7% year over year. Meanwhile, townhouse sales increased by 19%.
The British Columbia Real Estate Association reports that on a seasonally adjusted basis, sales in the VIREB area are close to 2014 levels, and current market conditions are expected to continue into the fall.
Weak housing demand has also contributed to an increase in total active residential listings across the province. In the VIREB area, inventory of single-family homes in May rose by 22% from one year ago (1,217 to 1,482). Active listings of apartments climbed by 18% (287 to 339) year over year, while townhouse inventory decreased by 5% (197 to 187). Despite decreased demand, prices in the VIREB area are still rising, although those increases are softening.
Trend-wise, VIREB’s housing market has transitioned from one favouring sellers to one that is balanced.
The following data is a comparison between May 2018 and May 2019 numbers, and is current as of June 2019. Click here to check out last month’s infographics.
You can also view all our VIREB infographics by clicking here.
Click on the images for a larger view!
(Protip: Make sure to grab the printable PDF versions, too! It fits best when printed on A4-sized sheets, AND we’ve added an area on the sheet where you can attach your business card! 🙂 )
Download Printable Version – May 2019 VIREB Market Report

(Image Source: VIREB Twitter)
Last Updated on July 25, 2022 by myRealPage


