INFOGRAPHICS: September 2019 VIREB Vancouver Island Market Reports

It’s Autumn, temperatures and leaves are falling, and the Vancouver Island market is also seeing some movements. It’s time for our monthly market updates for areas covered by the Vancouver Island Real Estate Board (VIREB)!
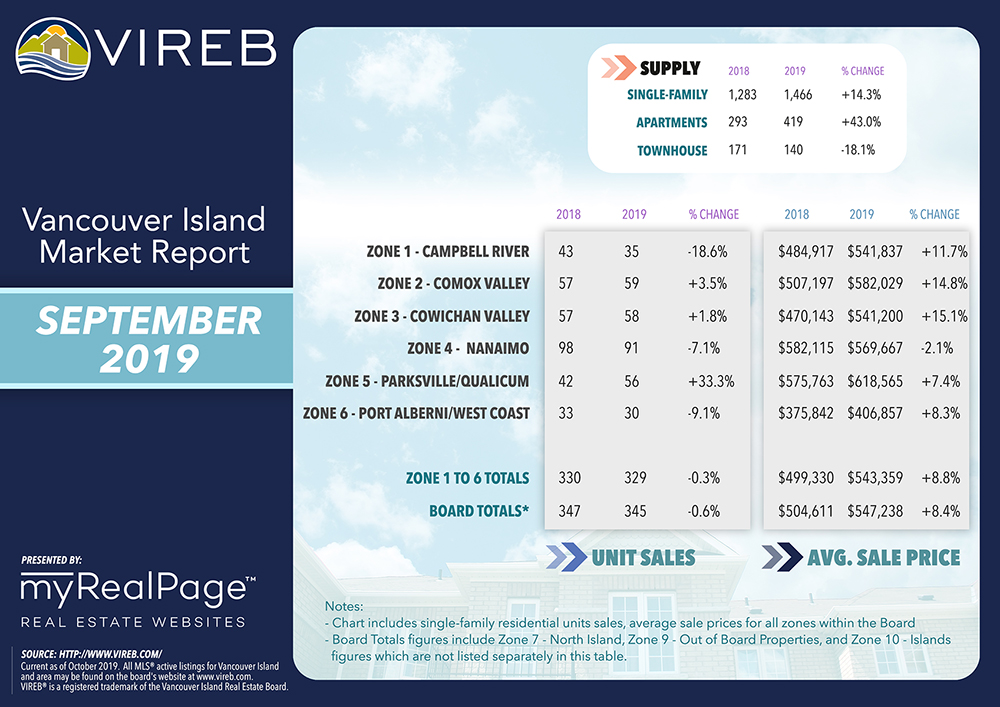
As per their most recent media update, sales of single-family homes in September were virtually flat year-over-year, but dipped by 16% from August. However, apartment and townhouse sales rose by 15% and 11% year-over-year, respectively.
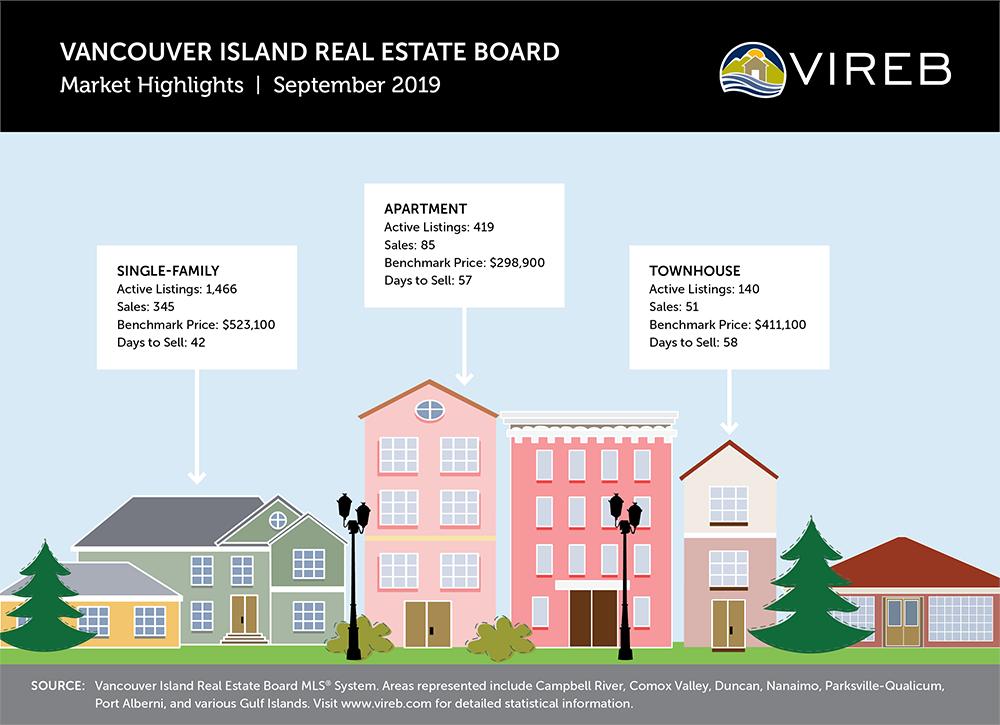
Last month, 345 single-family homes sold on the Multiple Listing Service® (MLS®) System compared to 413 the previous month and 347 in September 2018. In the apartment category, 85 units sold last month, while 51 townhouses changed hands in September.
In the VIREB area, inventory of single-family homes in September rose by 14% from one year ago (1,283 to 1,466). Active listings of apartments increased by 43% (293 to 419) year-over-year while townhouse inventory dropped by 18% (171 to 140).
The September statistics indicate that some buyers are turning to multi-family properties, but it is too early to say whether this is an anomaly or the beginning of a trend. As for the reasons behind this shift away from single-family homes, it could be a combination of factors, including affordability, Guideline B-20, and the speculation tax in Nanaimo.
Trend-wise, VIREB’s housing market has transitioned from one favouring sellers to one that is balanced, and, in some areas, conditions are better for buyers. Kaye Broens, 2019 President, reports that sellers now recognize the market has changed and are pricing their homes accordingly. Although real estate is cyclical, the one factor that remains constant is that well-priced homes sell faster.
The following data is a comparison between September 2018 and September 2019 numbers, and is current as of October 2019. Click here to check out last month’s infographics.
You can also view all our VIREB infographics by clicking here.
Click on the images for a larger view!
(Protip: Make sure to grab the printable PDF versions, too! It fits best when printed on A4-sized sheets, AND we’ve added an area on the sheet where you can attach your business card! 🙂 )
Download Printable Version – September 2019 VIREB Market Report
(Image from VIREB Twitter)
Last Updated on July 25, 2022 by myRealPage
