INFOGRAPHICS: February 2022 TRREB Toronto Market Reports

Demand for ownership housing remains strong throughout the GTA
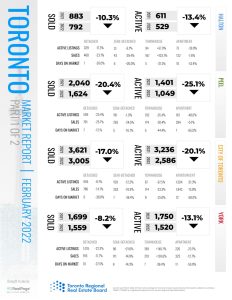
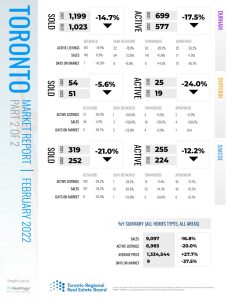
February home sales were down compared to the all-time record in 2021, but represented the second-best result for the month of February in history. New listings dropped, but by a marginally lesser annual rate than sales, pointing to a modest move to a slightly more balanced market. Competition between buyers, however, remained tight enough to support double-digit price growth year-over-year.
Greater Toronto Area (GTA) REALTORS® reported 9,097 sales through the Toronto Regional Real Estate Board’s (TRREB) MLS® System in February 2022, representing a 16.8 per cent decrease in the number of sales compared to February 2021. The supply of listings for low-rise home types (detached, semi-detached and townhouses) was also down year-over-year, but not by as much as sales. In the condominium apartment segment, particularly in Toronto, new listings were up in comparison to February 2021.
Read the full report on TRREB website!
The following data is a comparison between February 2022 and February 2021 numbers, and is current as of March 2022. For last month’s numbers, check out our previous infographic!
Or follow this link for all our TREB / TRREB Infographics!
Download Printable Version – February 2022 TRREB, Toronto Market Report Part 1
Download Printable Version – February 2022 TRREB, Toronto Market Report Part 2
Last Updated on July 25, 2022 by myRealPage


