INFOGRAPHICS: January 2026 CREB City And Region Market Reports

Slow start for high-density homes
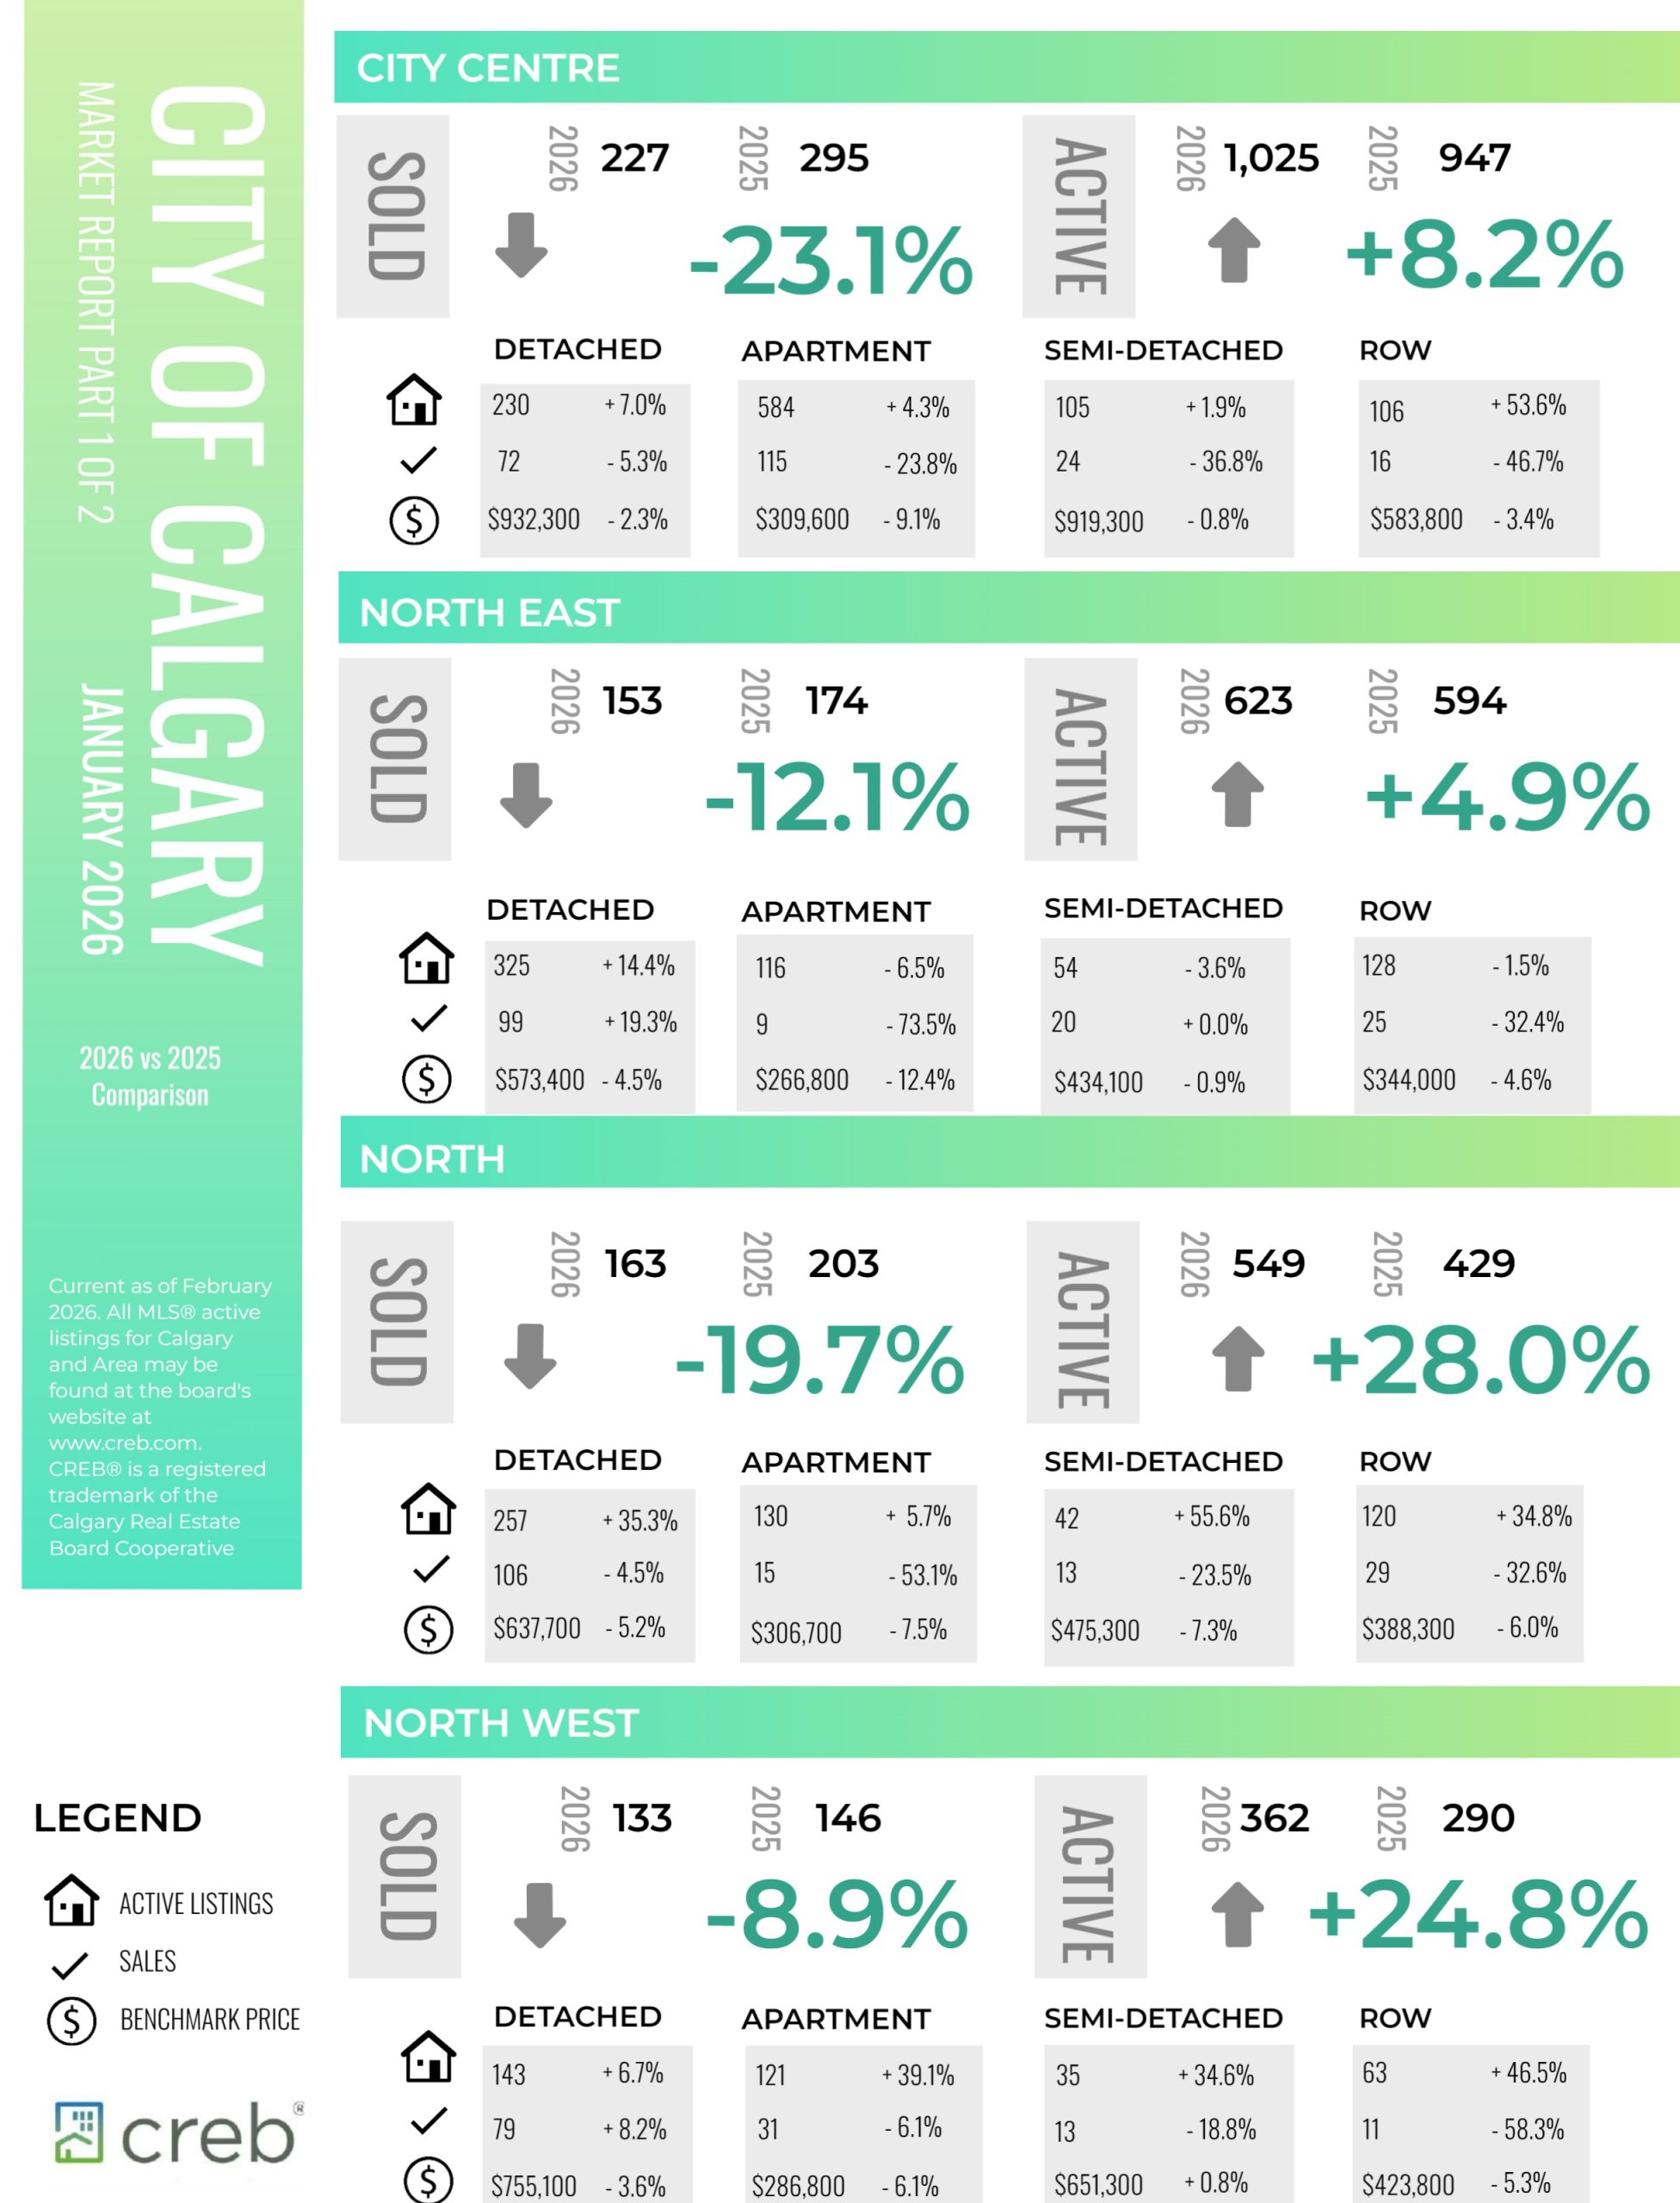
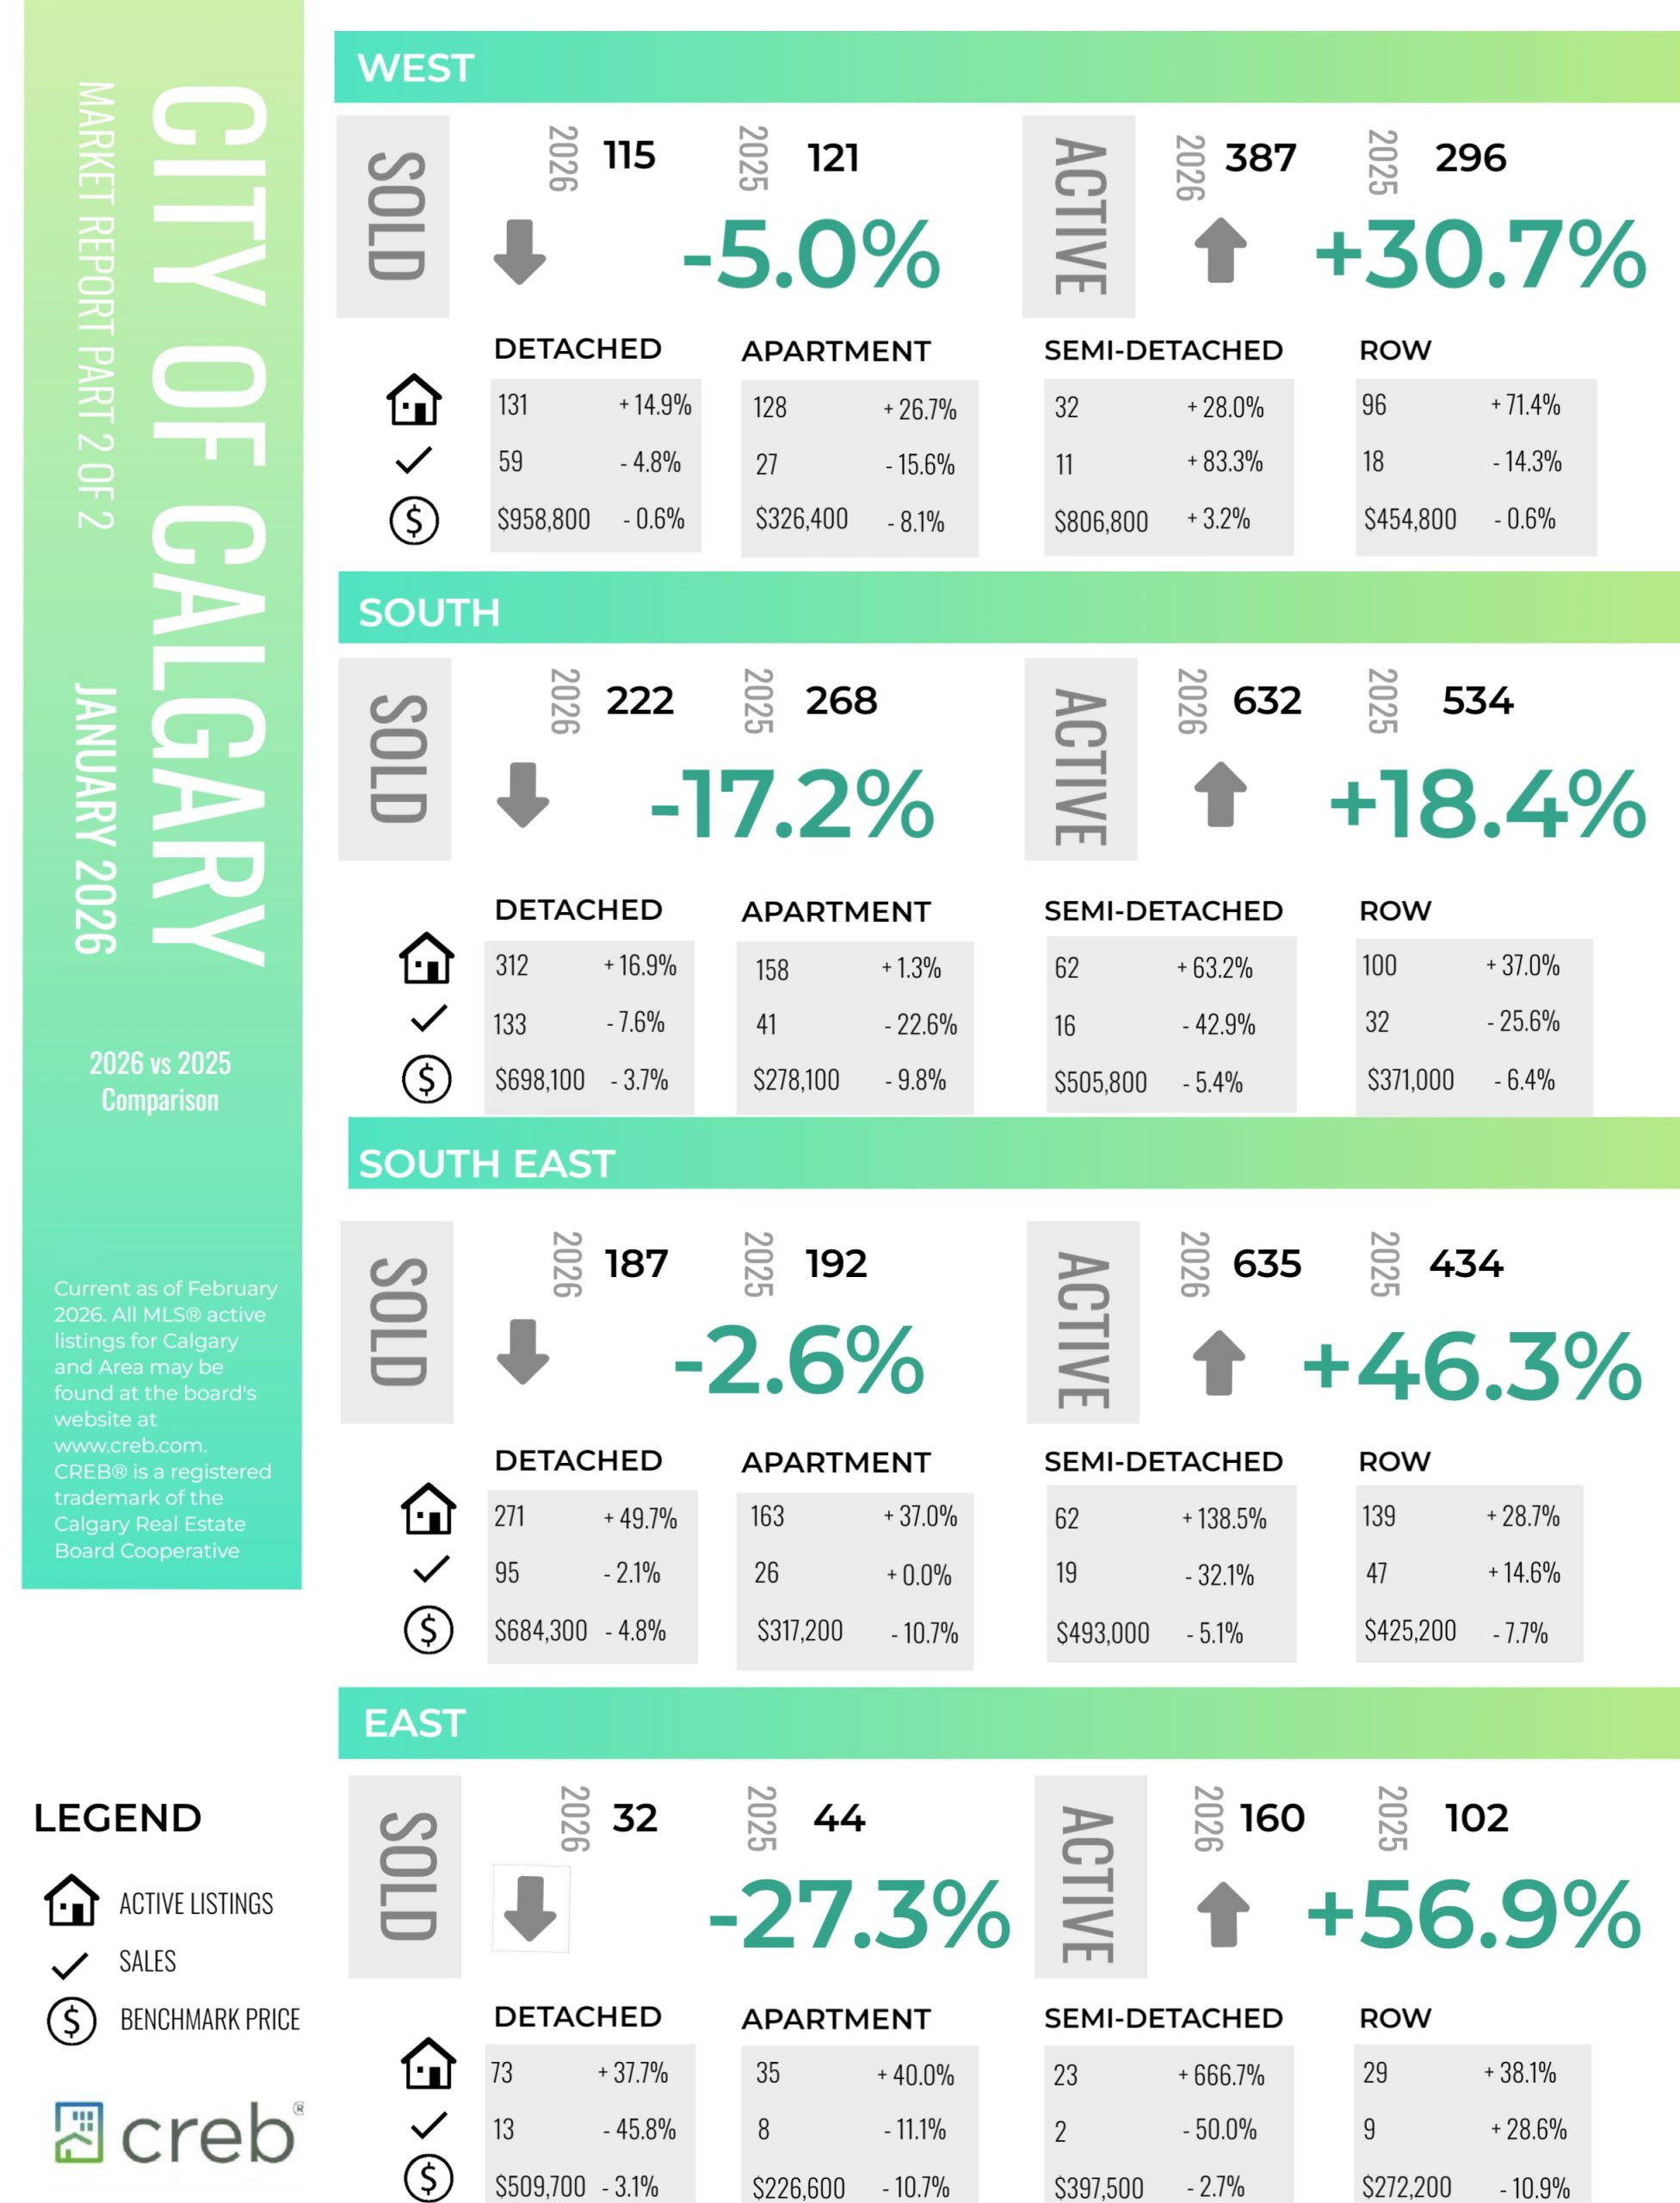
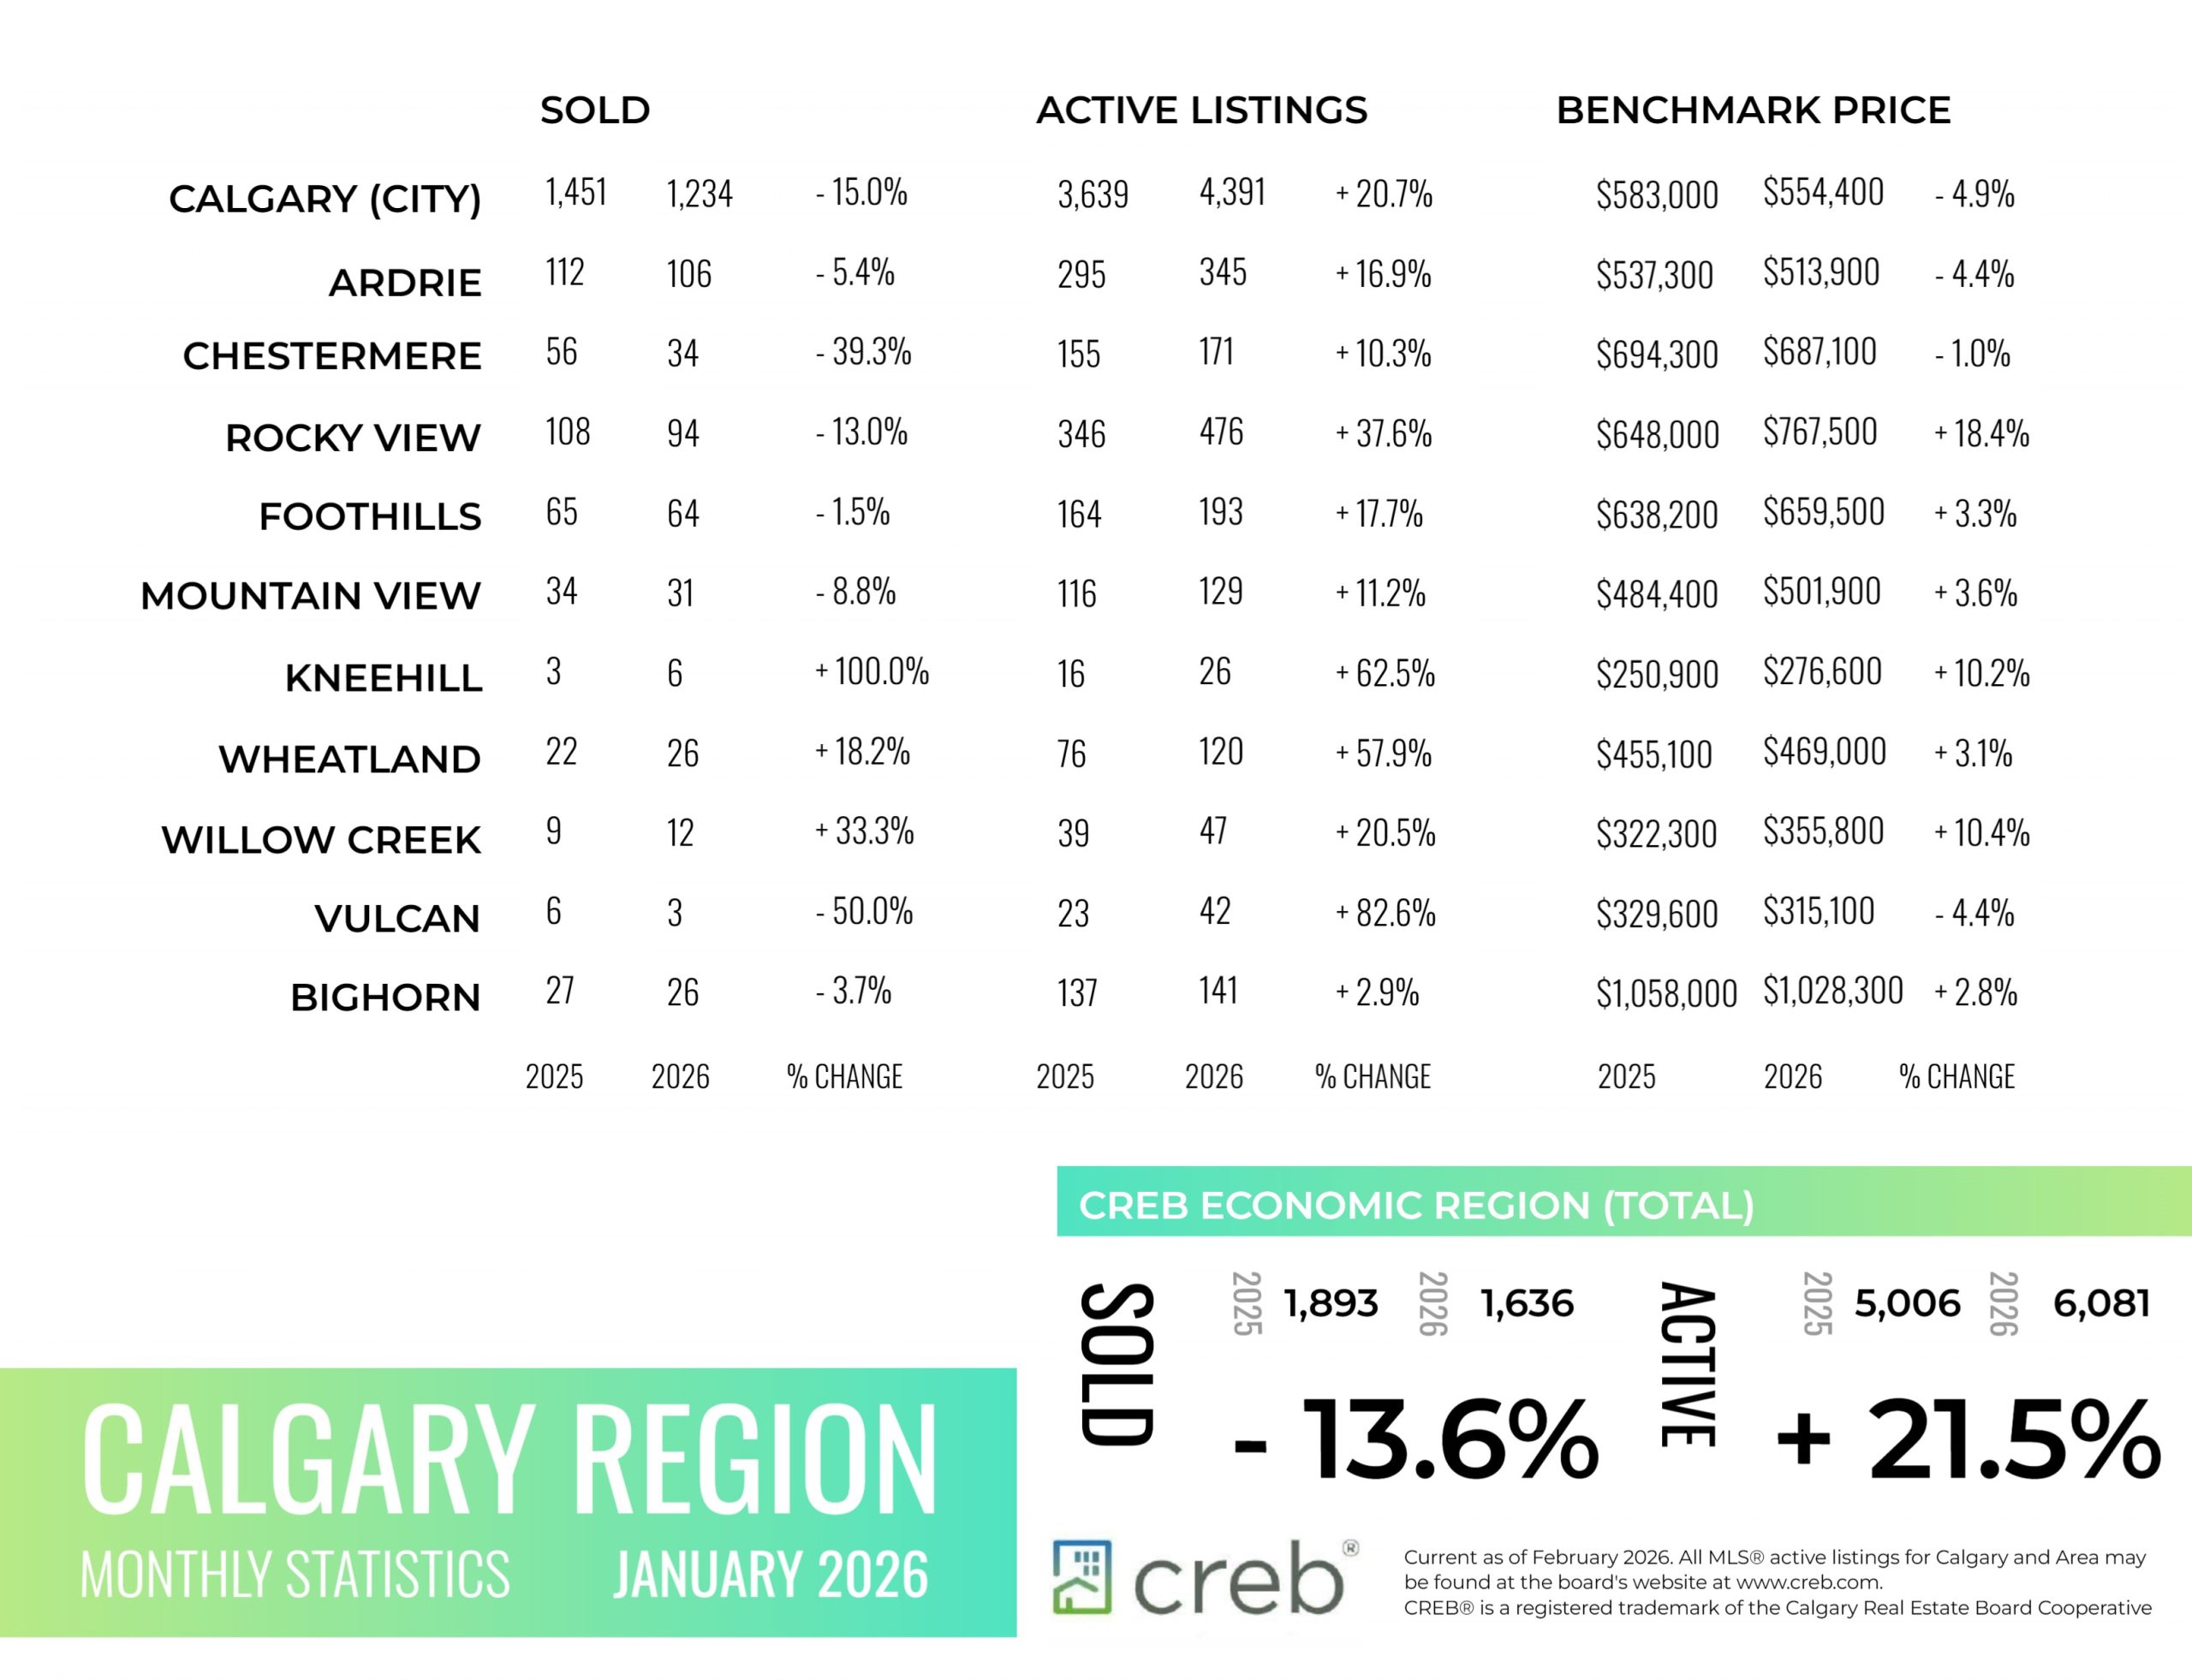
Calgary reported 1,234 sales in January, a year-over-year decline of 15 per cent, but in line with typical levels of activity for the month. While sales declined across all property types, the steepest declines occurred in higher-density homes.
“Following the typical December slowdown, potential buyers for high-density homes were more hesitant to return to the market in January, as increased supply choice across all aspects of the market has reduced the sense of urgency,” said Ann-Marie Lurie, CREB®’s Chief Economist. “At the same time, sellers were quick to bring their listings onto the market, causing the sales-to-new-listings ratio to drop to 44 per cent, mostly due to shifts in apartment and row-style homes. Overall, this is not entirely uncommon for January, as both buyers and sellers weigh their options ahead of the spring market.”
The rise in new listings compared to sales caused inventory levels to increase to 4,391 units, the highest January level since 2020. However, as with sales, conditions vary by property type, with row and apartment homes facing higher levels of inventory compared to long-term trends. The result is months of supply that ranges from under three months in the detached sector to five months for apartment-style homes.
Read the full report on the CREB website!
The following data is a comparison between January 2026 and January 2025 numbers, and is current as of February of 2026. For last month’s numbers, check out our previous infographic.
Or follow this link for all our CREB Infographics!
Click on the images for a larger view!
Download Printable Version – January 2026 CREB, City of Calgary Report Pages 1 and 2
Download Printable Version – January 2026 CREB, Calgary Region Report
Last Updated on February 5, 2026 by myRealPage
