INFOGRAPHICS: April 2026 CREB City And Region Market Reports

Balanced conditions in the city, except for apartment-style units
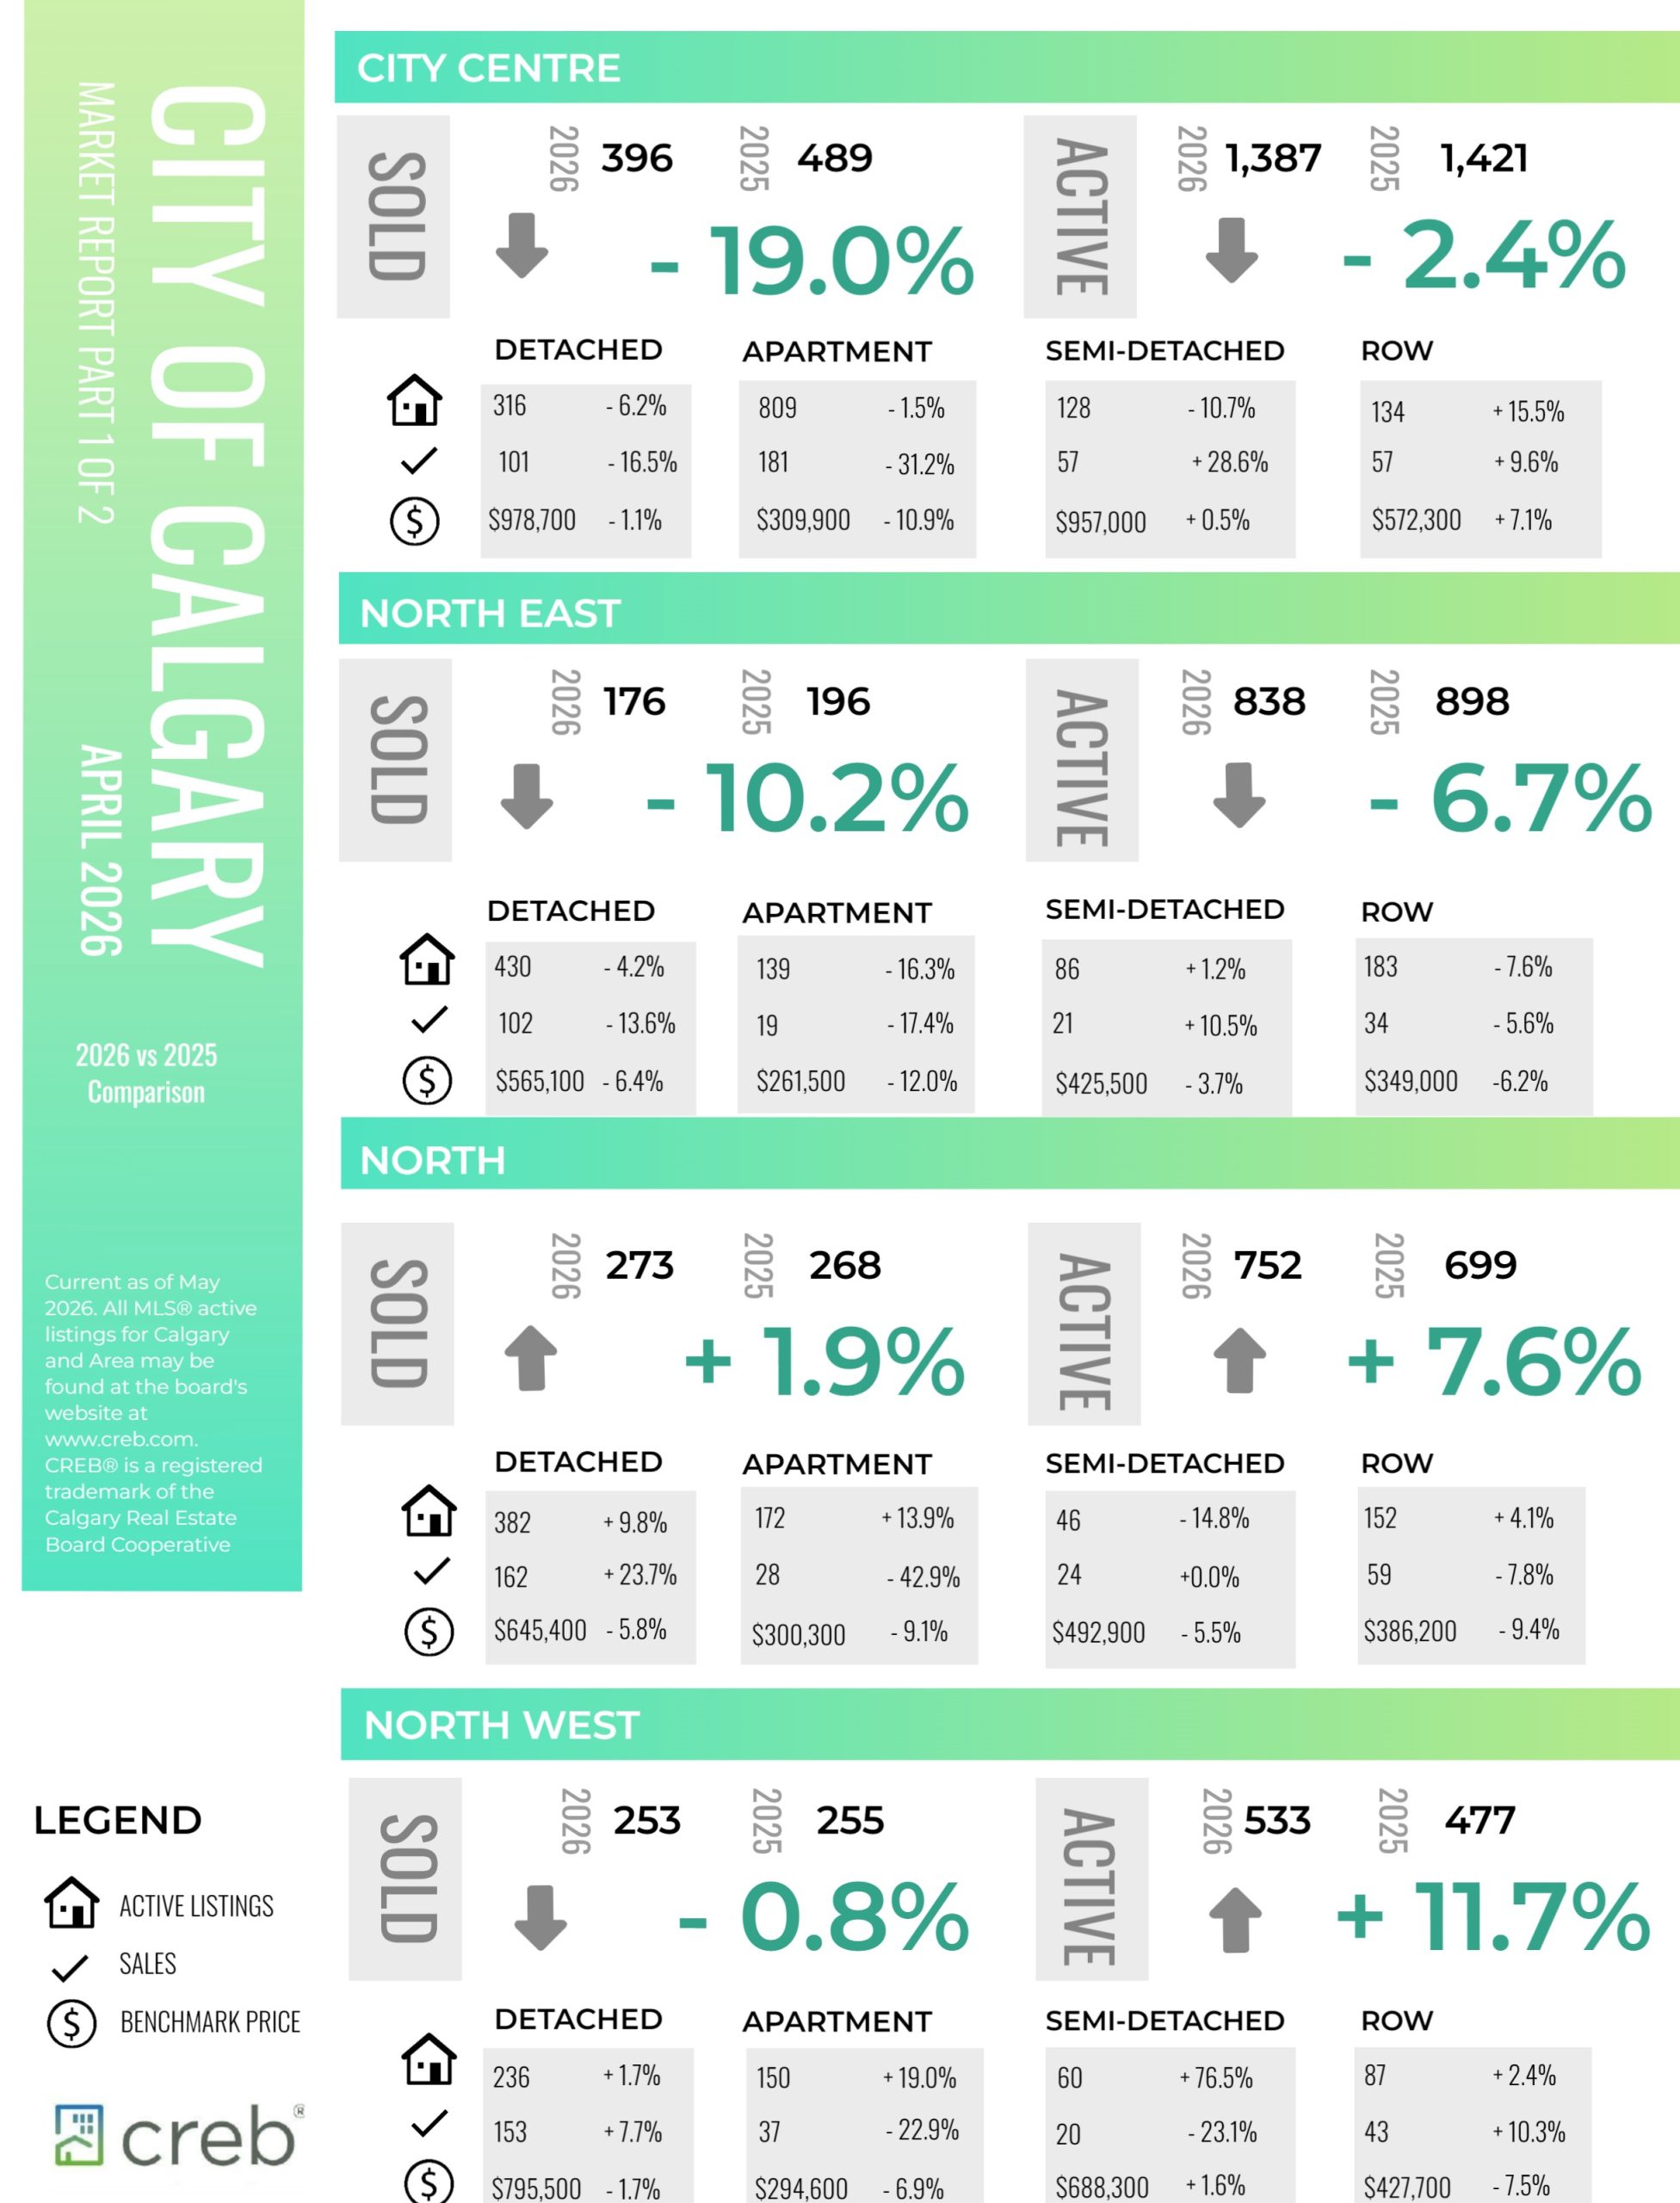
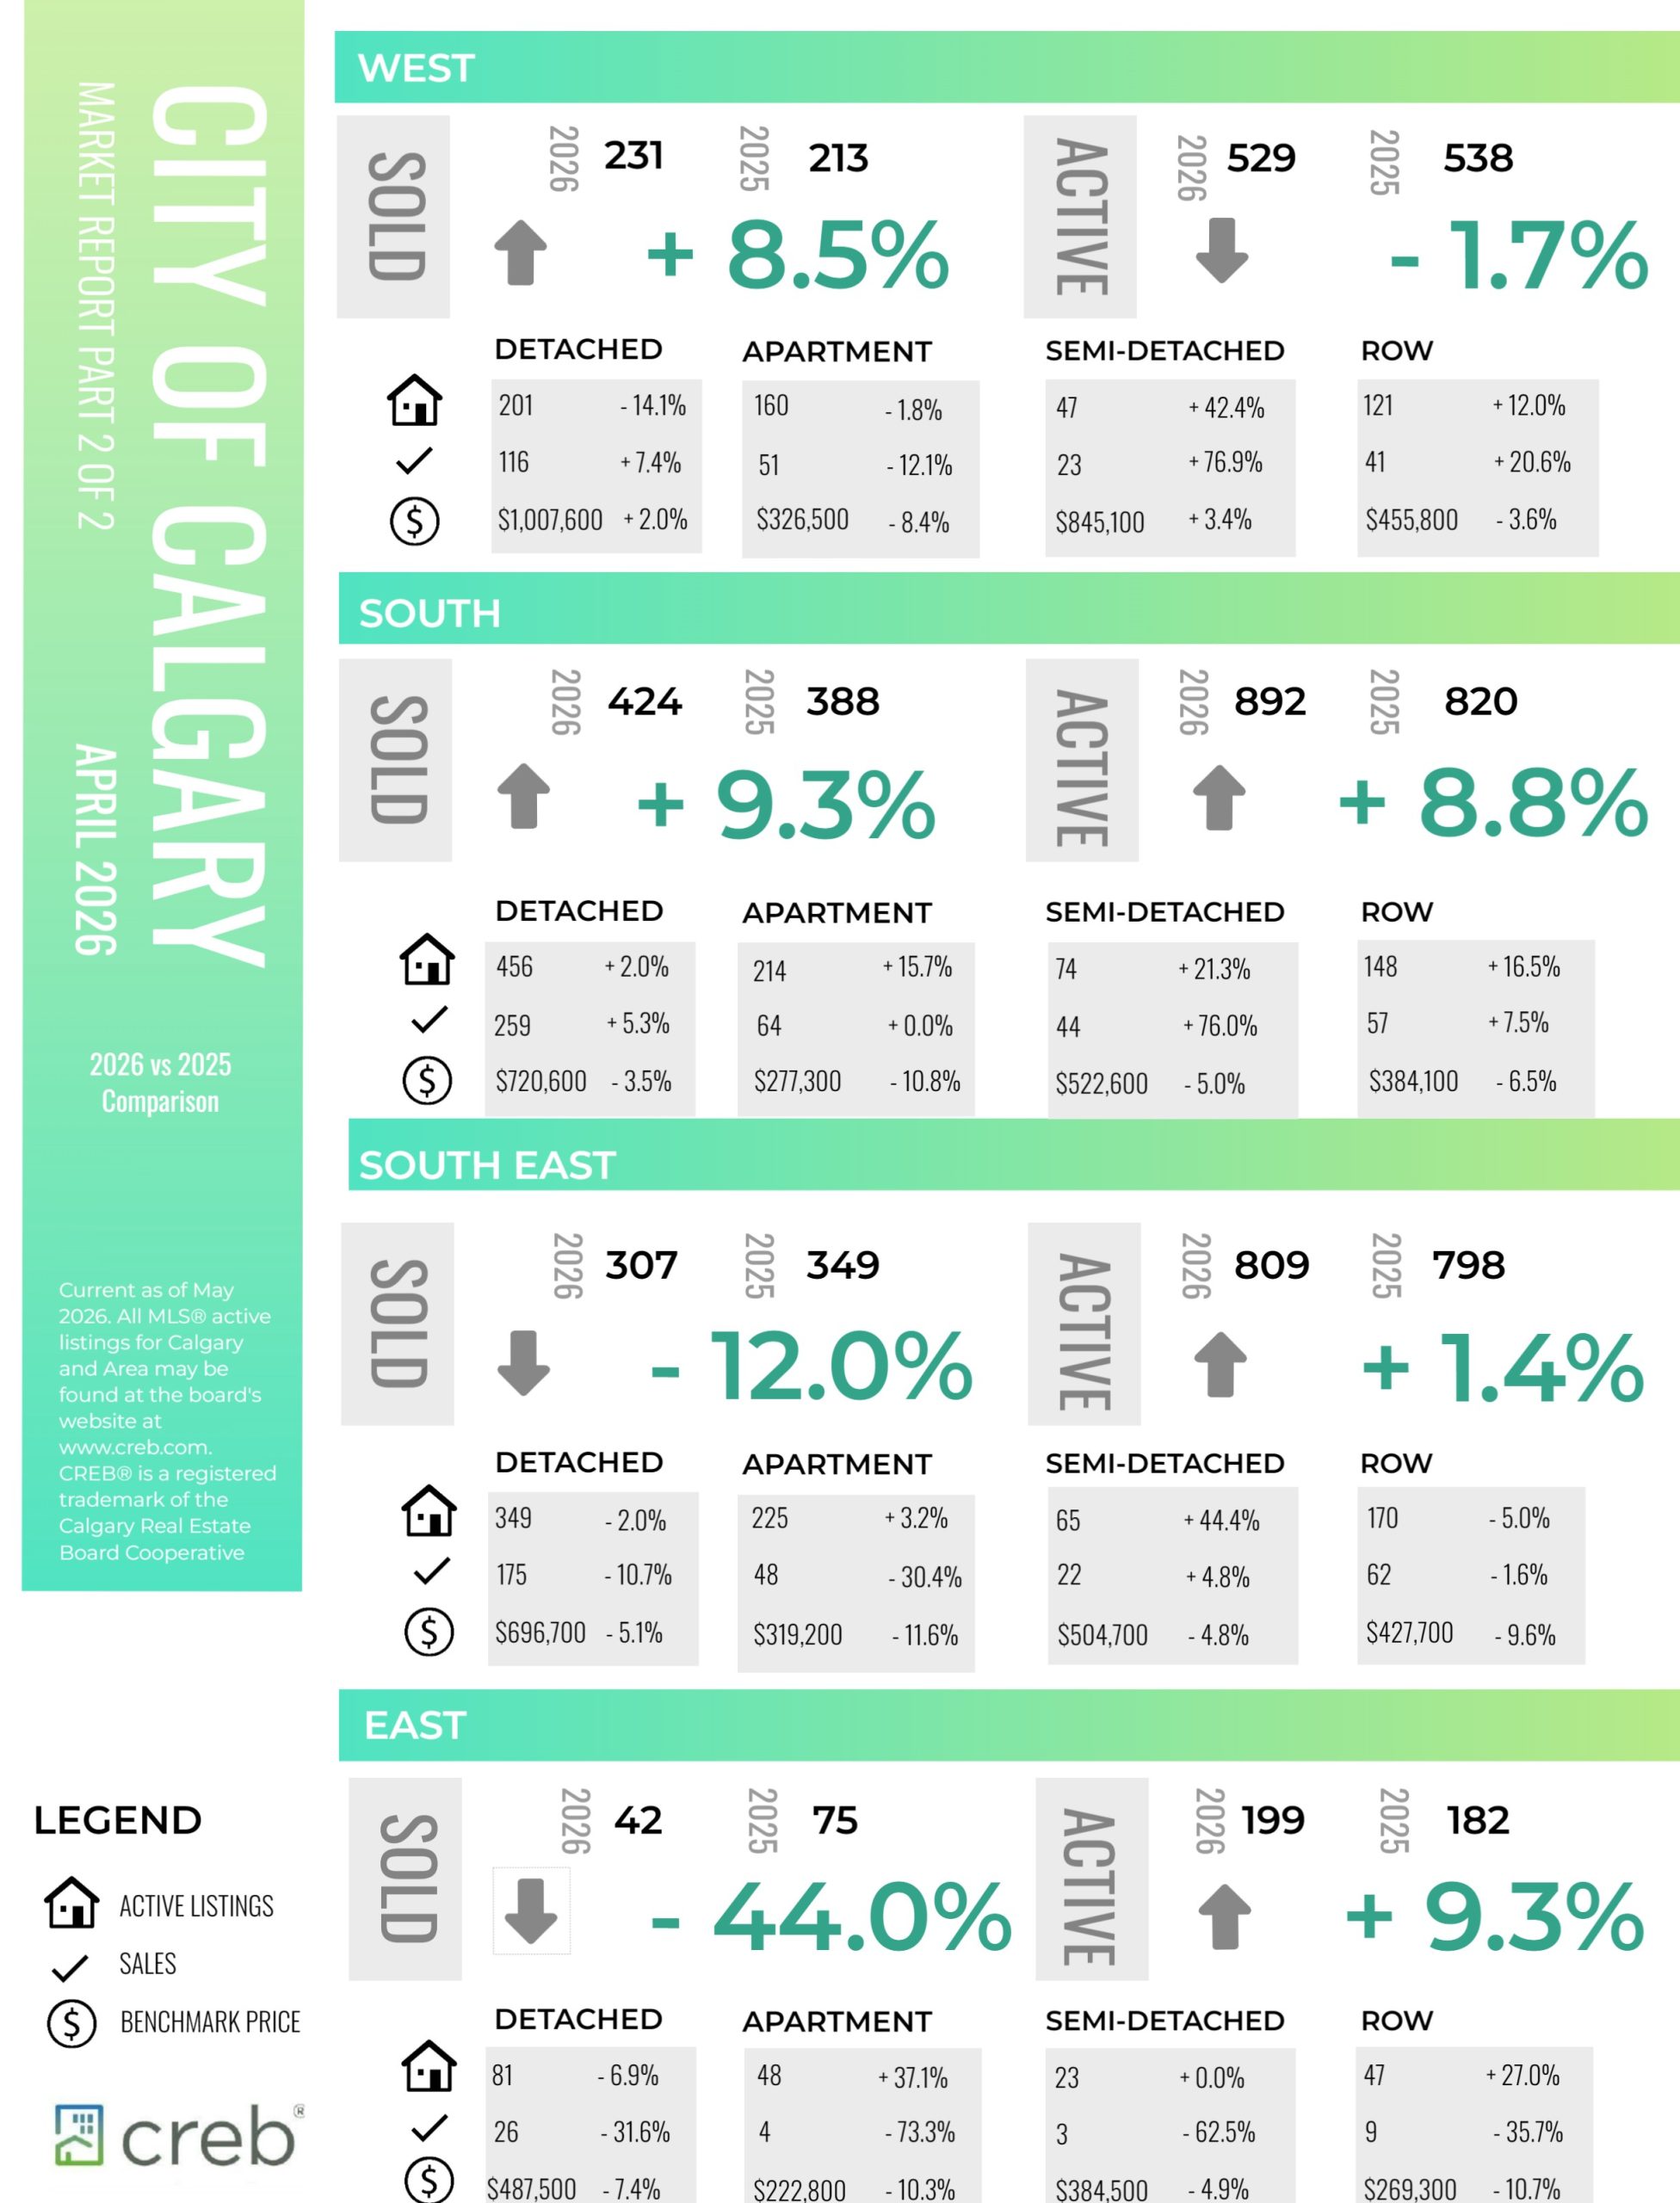
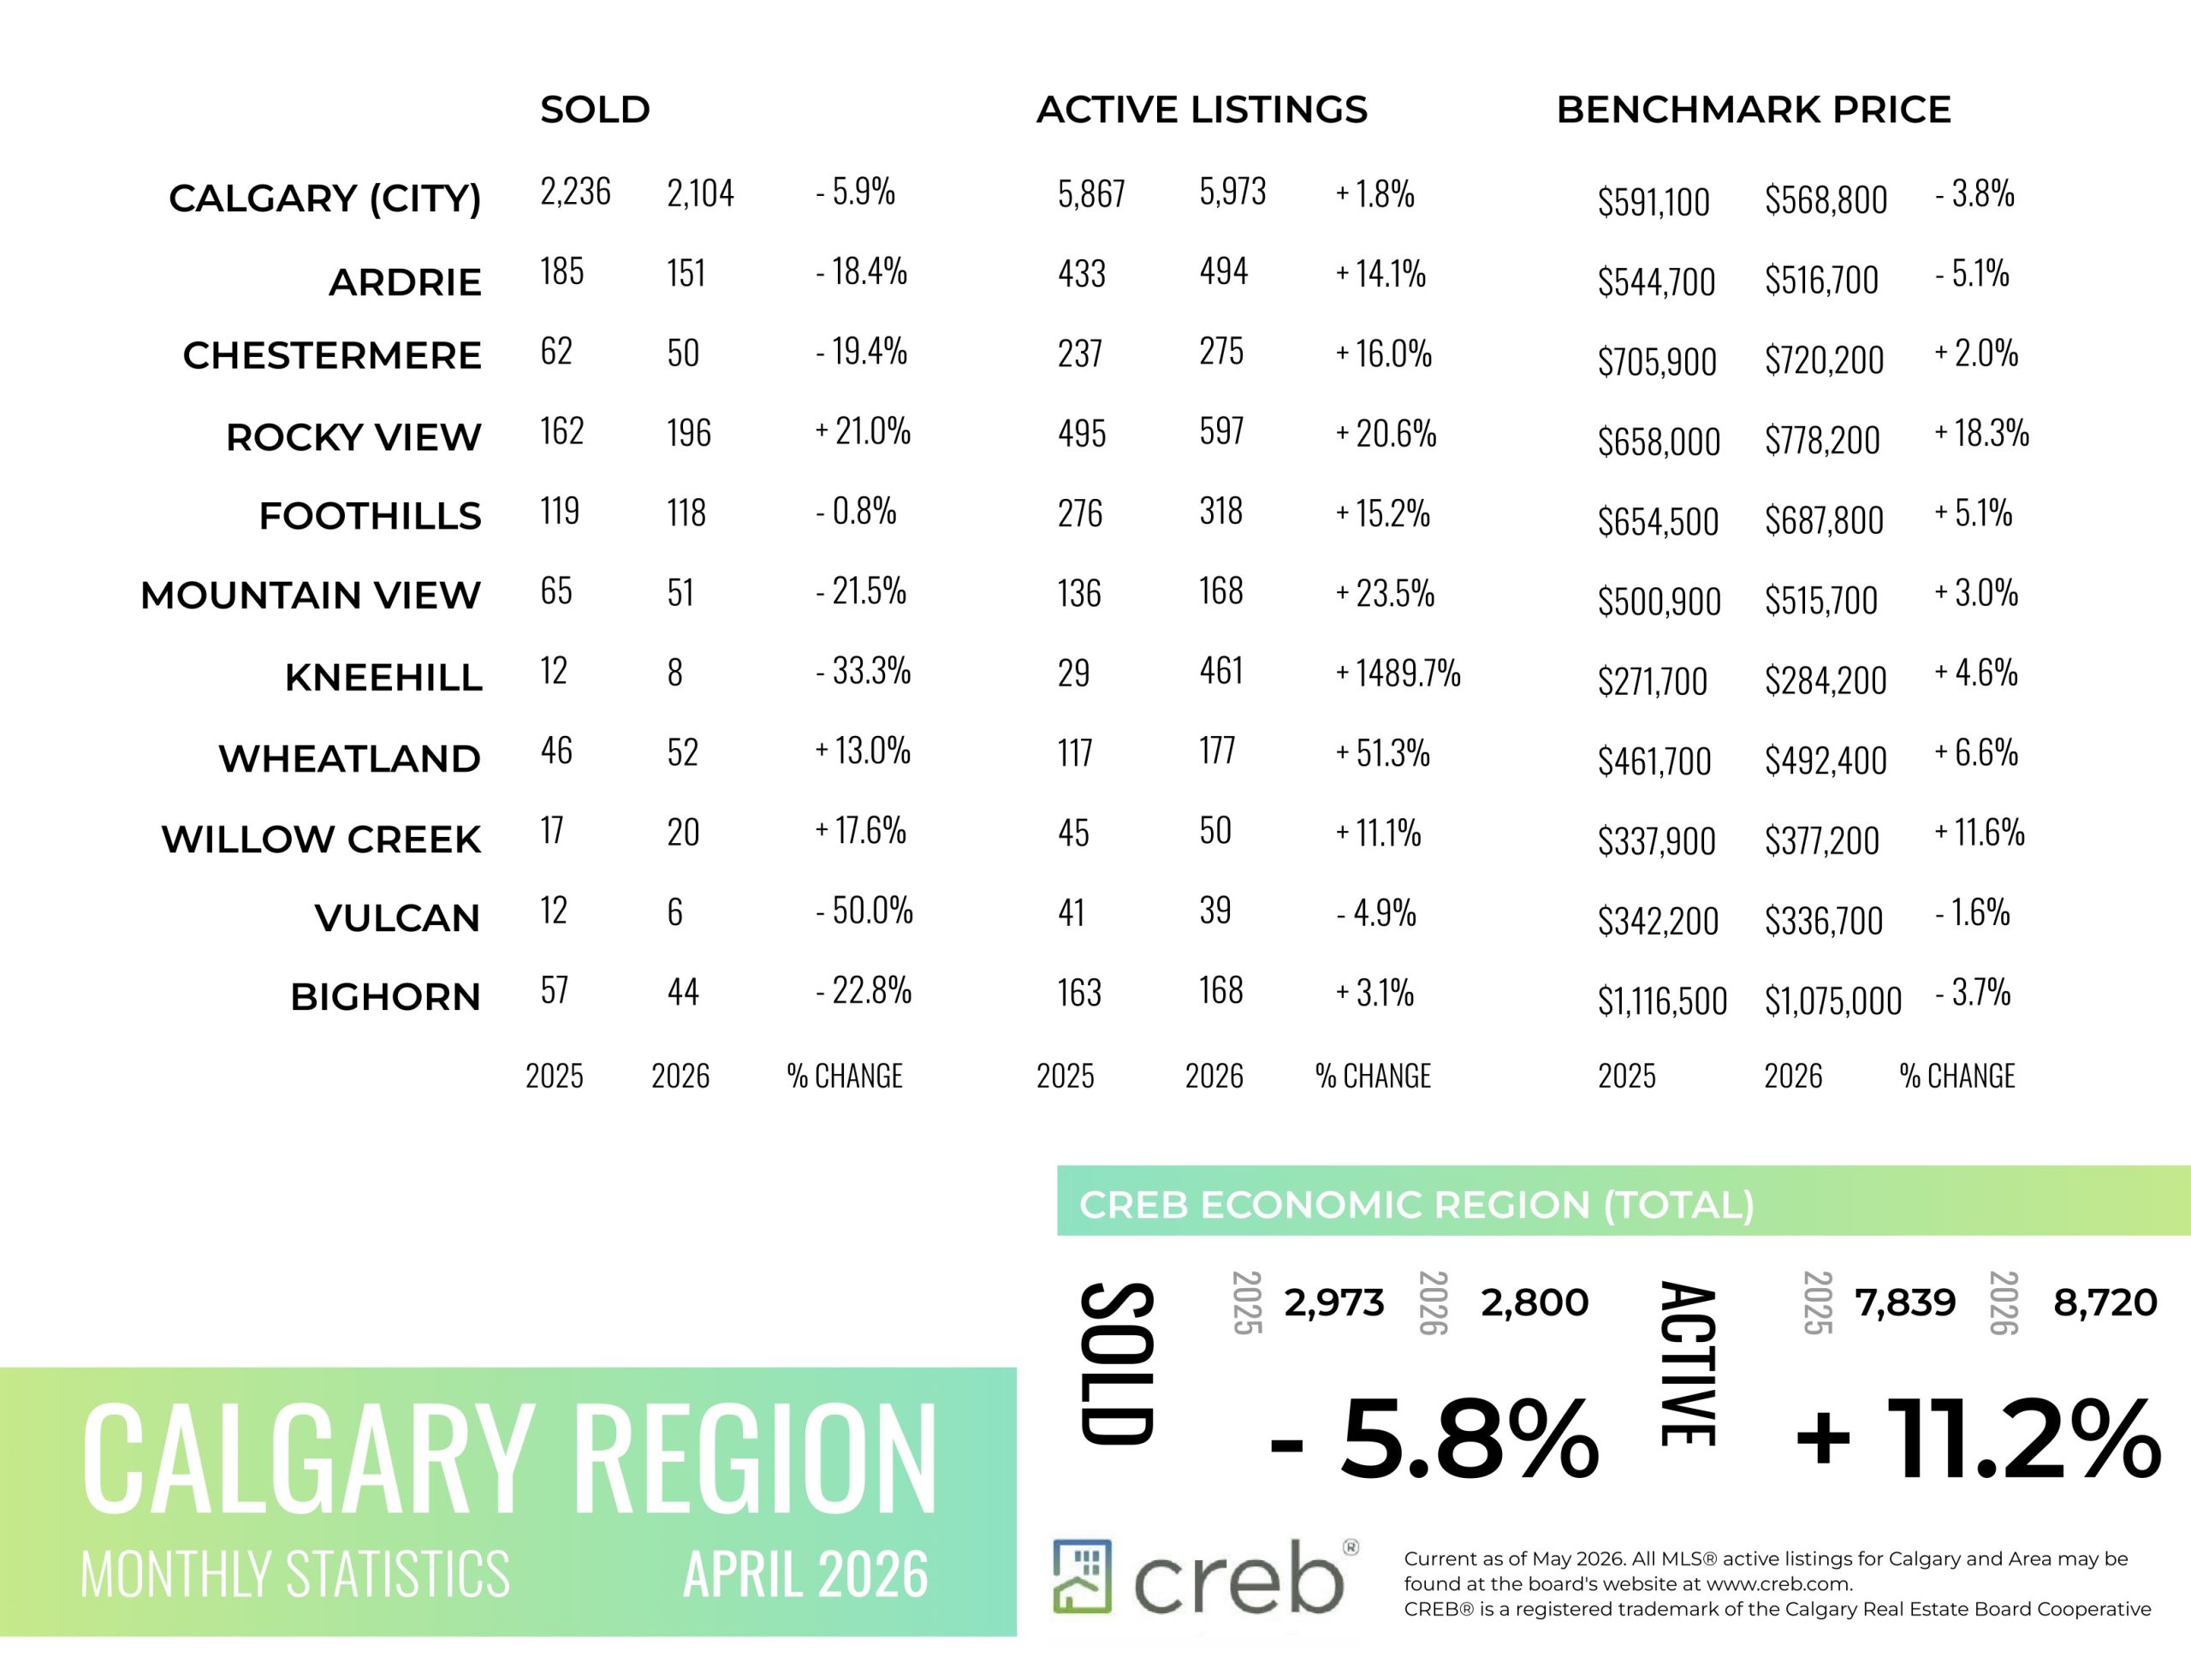
In line with seasonal expectations, both sales and inventory levels trended up relative to March’s activity. Despite this typical monthly rise, April sales totalled 2,104 units, six per cent lower than levels reported in 2025.
“Sales were expected to ease this year as our market transitioned away from strong demand that was driven by previously rapid migration growth. Improved supply choice across the entire housing spectrum has reduced the urgency among potential purchasers, helping our market shift away from seller’s market conditions to more balanced conditions,” said Ann-Marie Lurie, CREB®’s Chief Economist. “However, the trend of limited supply choice in the detached market continues, while conditions favour the buyer in the apartment condominium market.”
With 3,829 new listings in April, the sales-to-new-listings ratio remained at 55 per cent, supporting a modest monthly gain in supply. Inventory levels reached 5,973 units, nearly two per cent higher than levels reported last April. Overall, the months of supply remained just below three, representing relatively balanced conditions. However, this ranged from just over two months for detached homes to over four months for apartment-style homes.
The unadjusted total residential benchmark price trended up compared with March, reaching $568,800. The monthly gain was mostly associated with seasonal improvements, which is expected heading into the spring market. Monthly gains were higher in the detached and semi-detached segments. Overall, compared with the previous year, prices
remain three per cent lower, with modest year-over-year declines in the detached and semi-detached sector, while declines neared nine per cent for apartment-style units.
So far in 2026, conditions have varied, ranging from seller’s market conditions and price growth for detached homes in some parts of the city to buyer’s market conditions and price adjustments in the apartment condominium sector.
Read the full report on the CREB website!
The following data is a comparison between April 2026 and April 2025 numbers, and is current as of May 0f 2026. For last month’s numbers, check out our previous infographic.
Or follow this link for all our CREB Infographics!
Click on the images for a larger view!
Download Printable Version – April 2026 CREB, City of Calgary Report Pages 1 and 2
Download Printable Version – April 2026 CREB, Calgary Region Report
Last Updated on May 6, 2026 by myRealPage
