INFOGRAPHICS: May 2026 GVR Greater Vancouver Market Reports

Apartment sales lag, other housing segments steady
Led by slow sales in the apartment segment, home sales registered on the MLS® in Metro Vancouver were down nearly four per cent in May compared to last year.
The Greater Vancouver REALTORS® (GVR) reports that residential sales in the region totalled 2,150 in May 2026, a 3.5 per cent decrease from the 2,228 sales recorded in May 2025. This was 26.6 per cent below the 10-year seasonal average (2,930).
“While attached sales held relatively steady and detached sales edged up roughly one per cent in May, apartment sales were down about seven per cent year-over-year, which weighed down the overall sales total. Even then, apartment sales were not down uniformly across all regions – some of the larger areas such as North and East Vancouver saw increases relative to last year.” said Andrew Lis, GVR chief economist and vice-president data analytics
Read the full report on the REBGV website!
The following data is a comparison between May 2026 and May 2025 numbers, and is current as of June of 2026. For last month’s update, you can check out our previous post!
Or follow this link for all our GVR Infographics!
These infographics cover current trends in several areas within the Greater Vancouver region. Click on the images for a larger view!
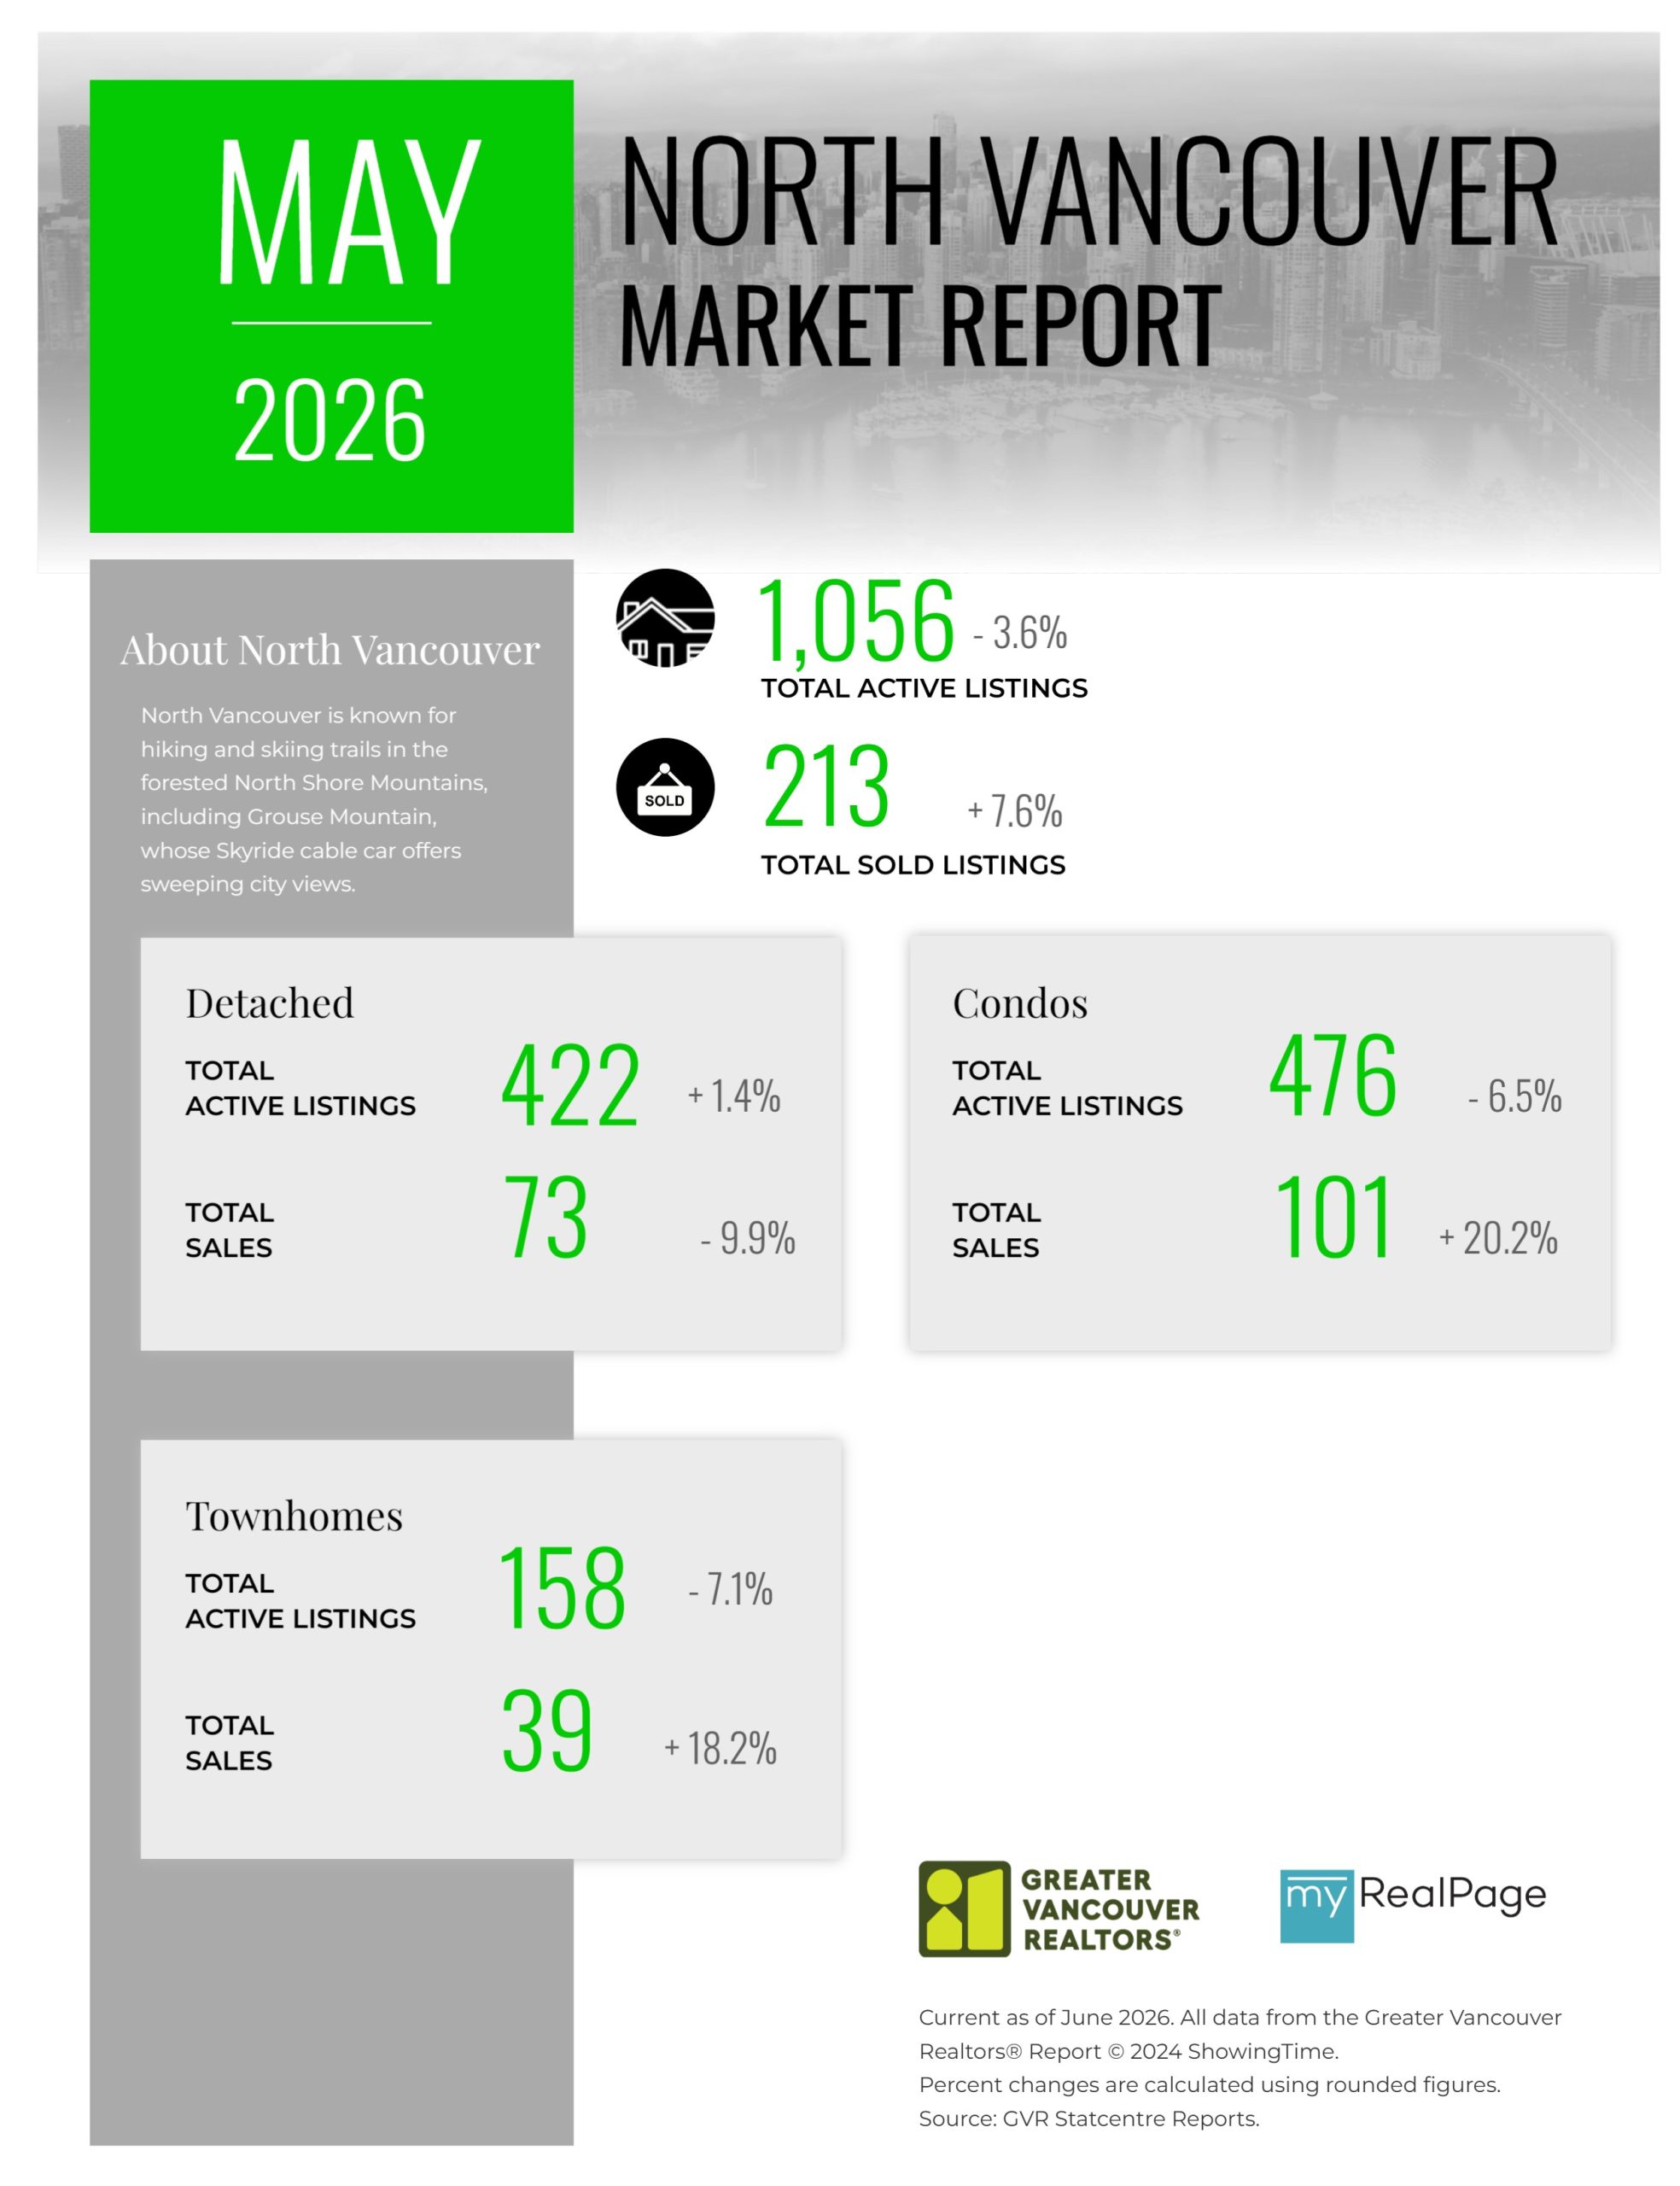
Printable Version – GVR May 2026 Data Infographic Report North Vancouver
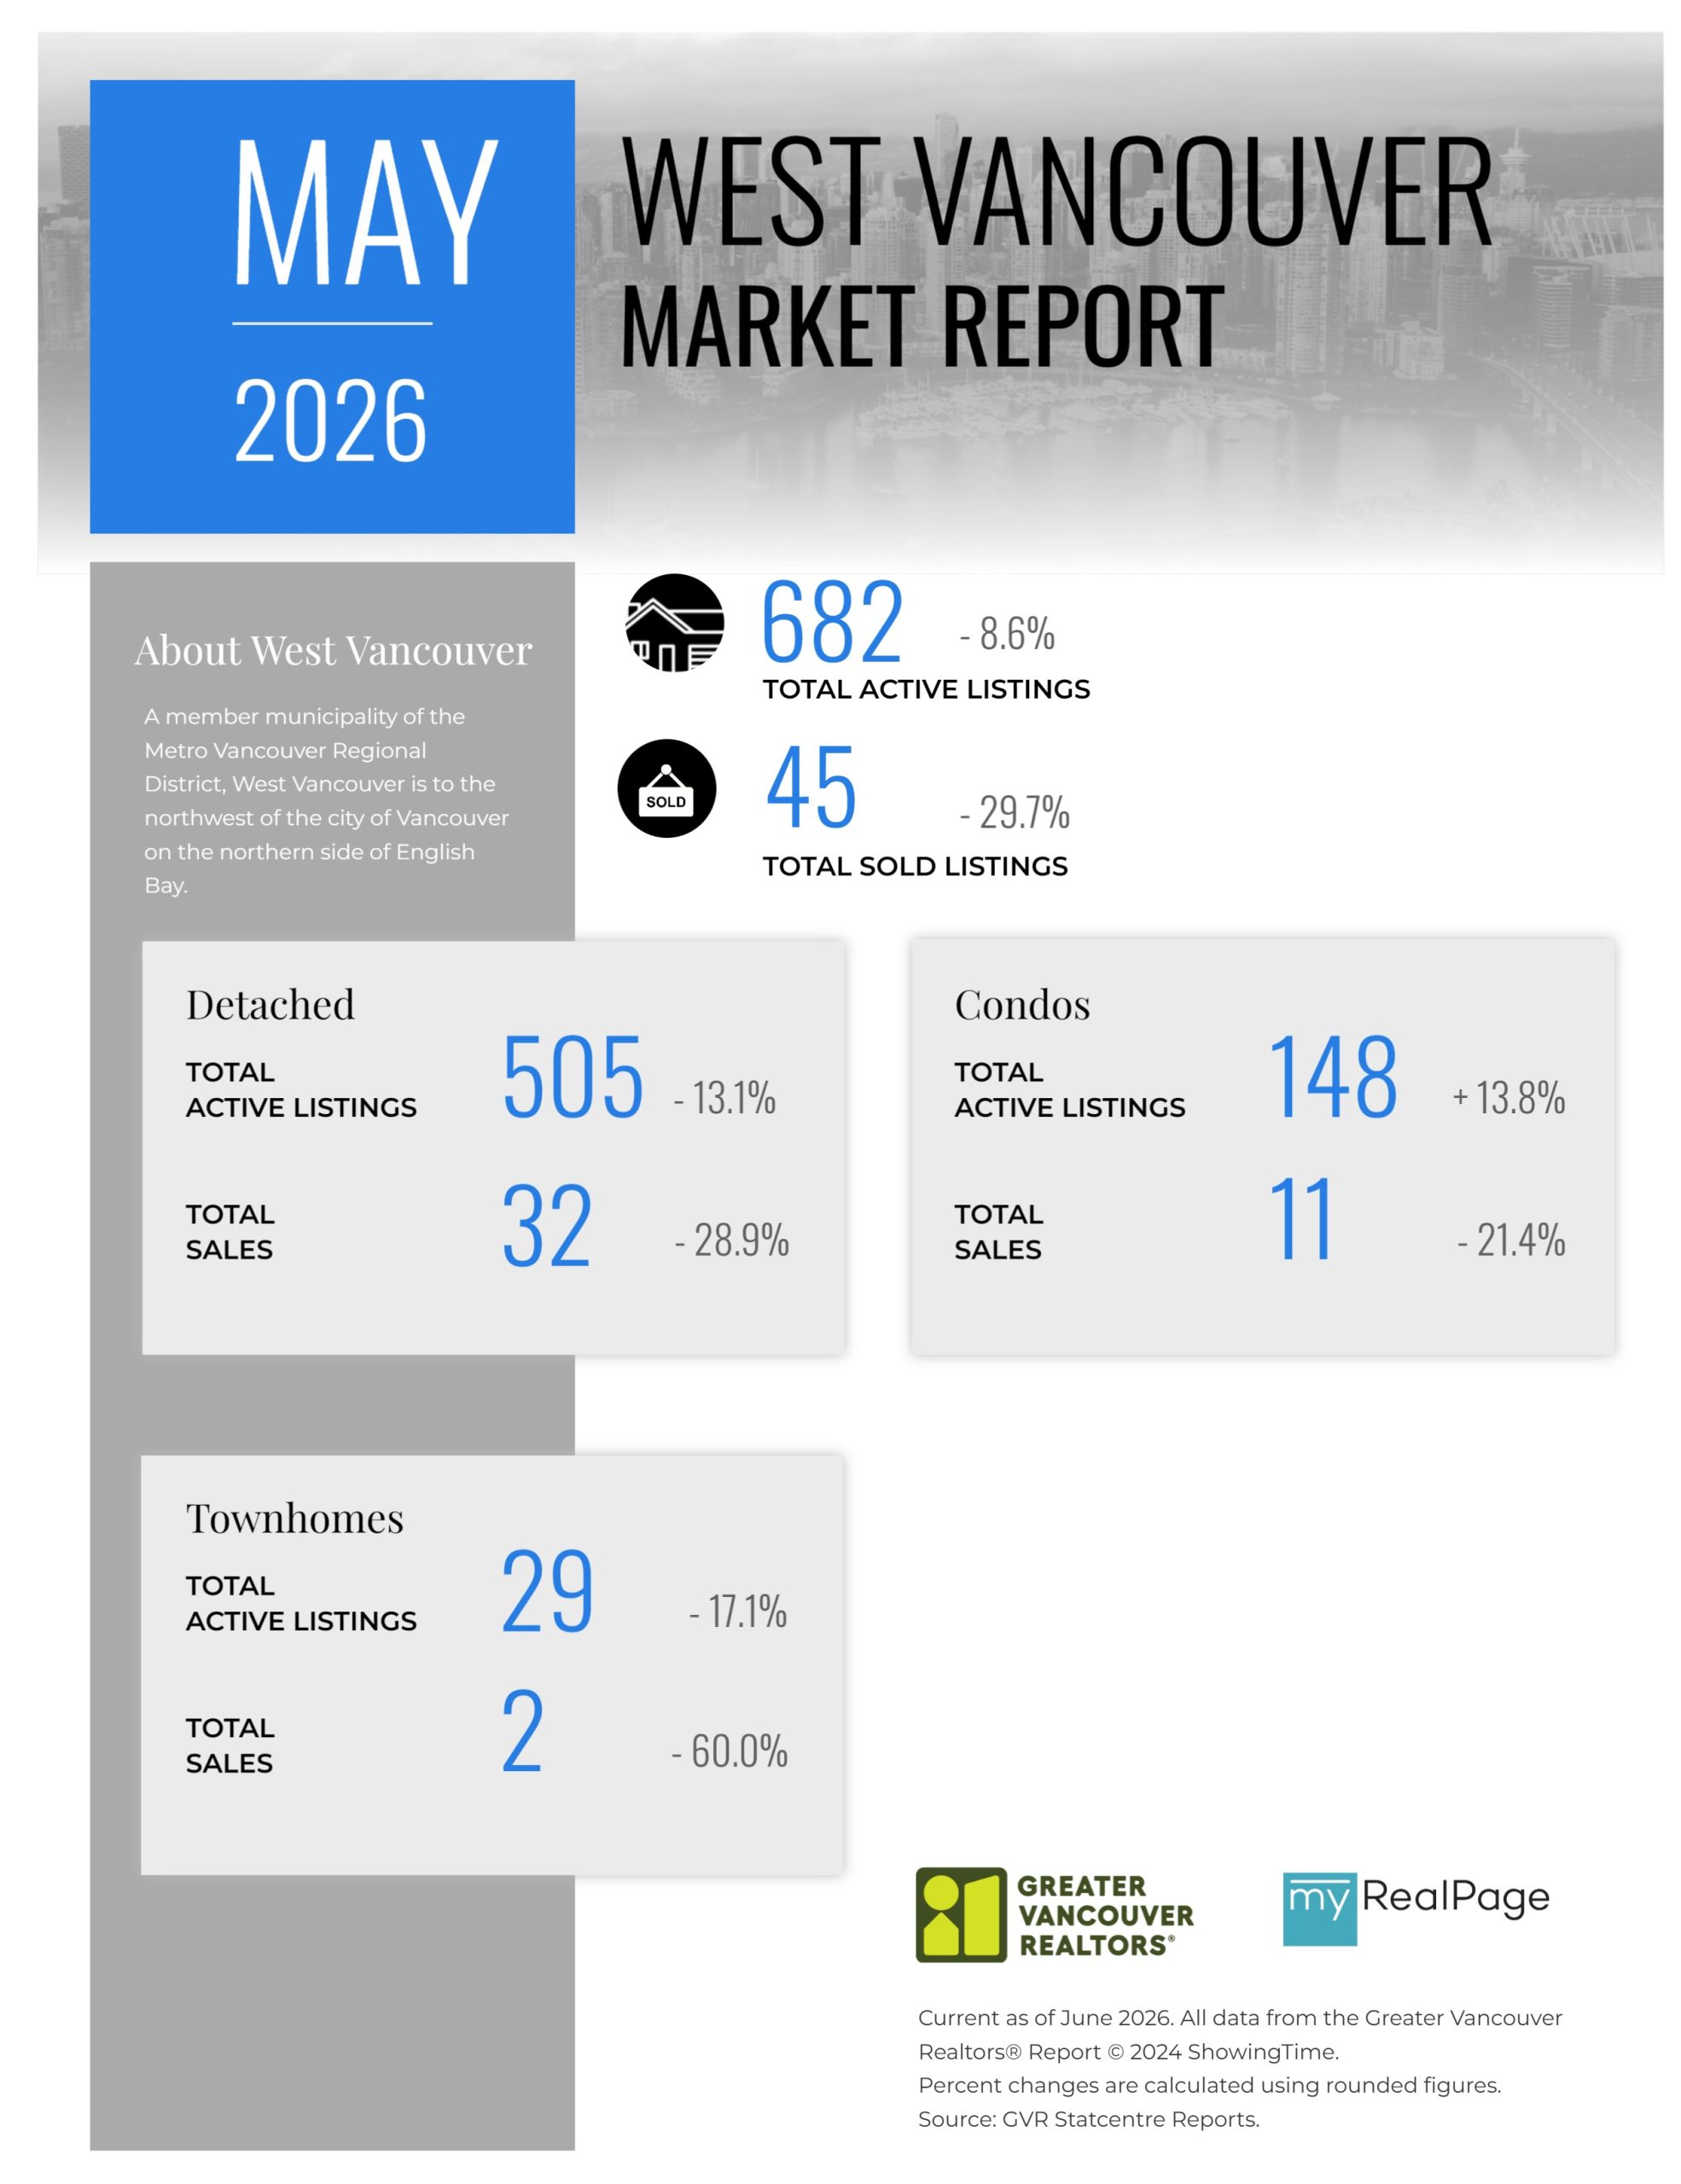
Printable Version – GVR May 2026 Data Infographics Report West Vancouver
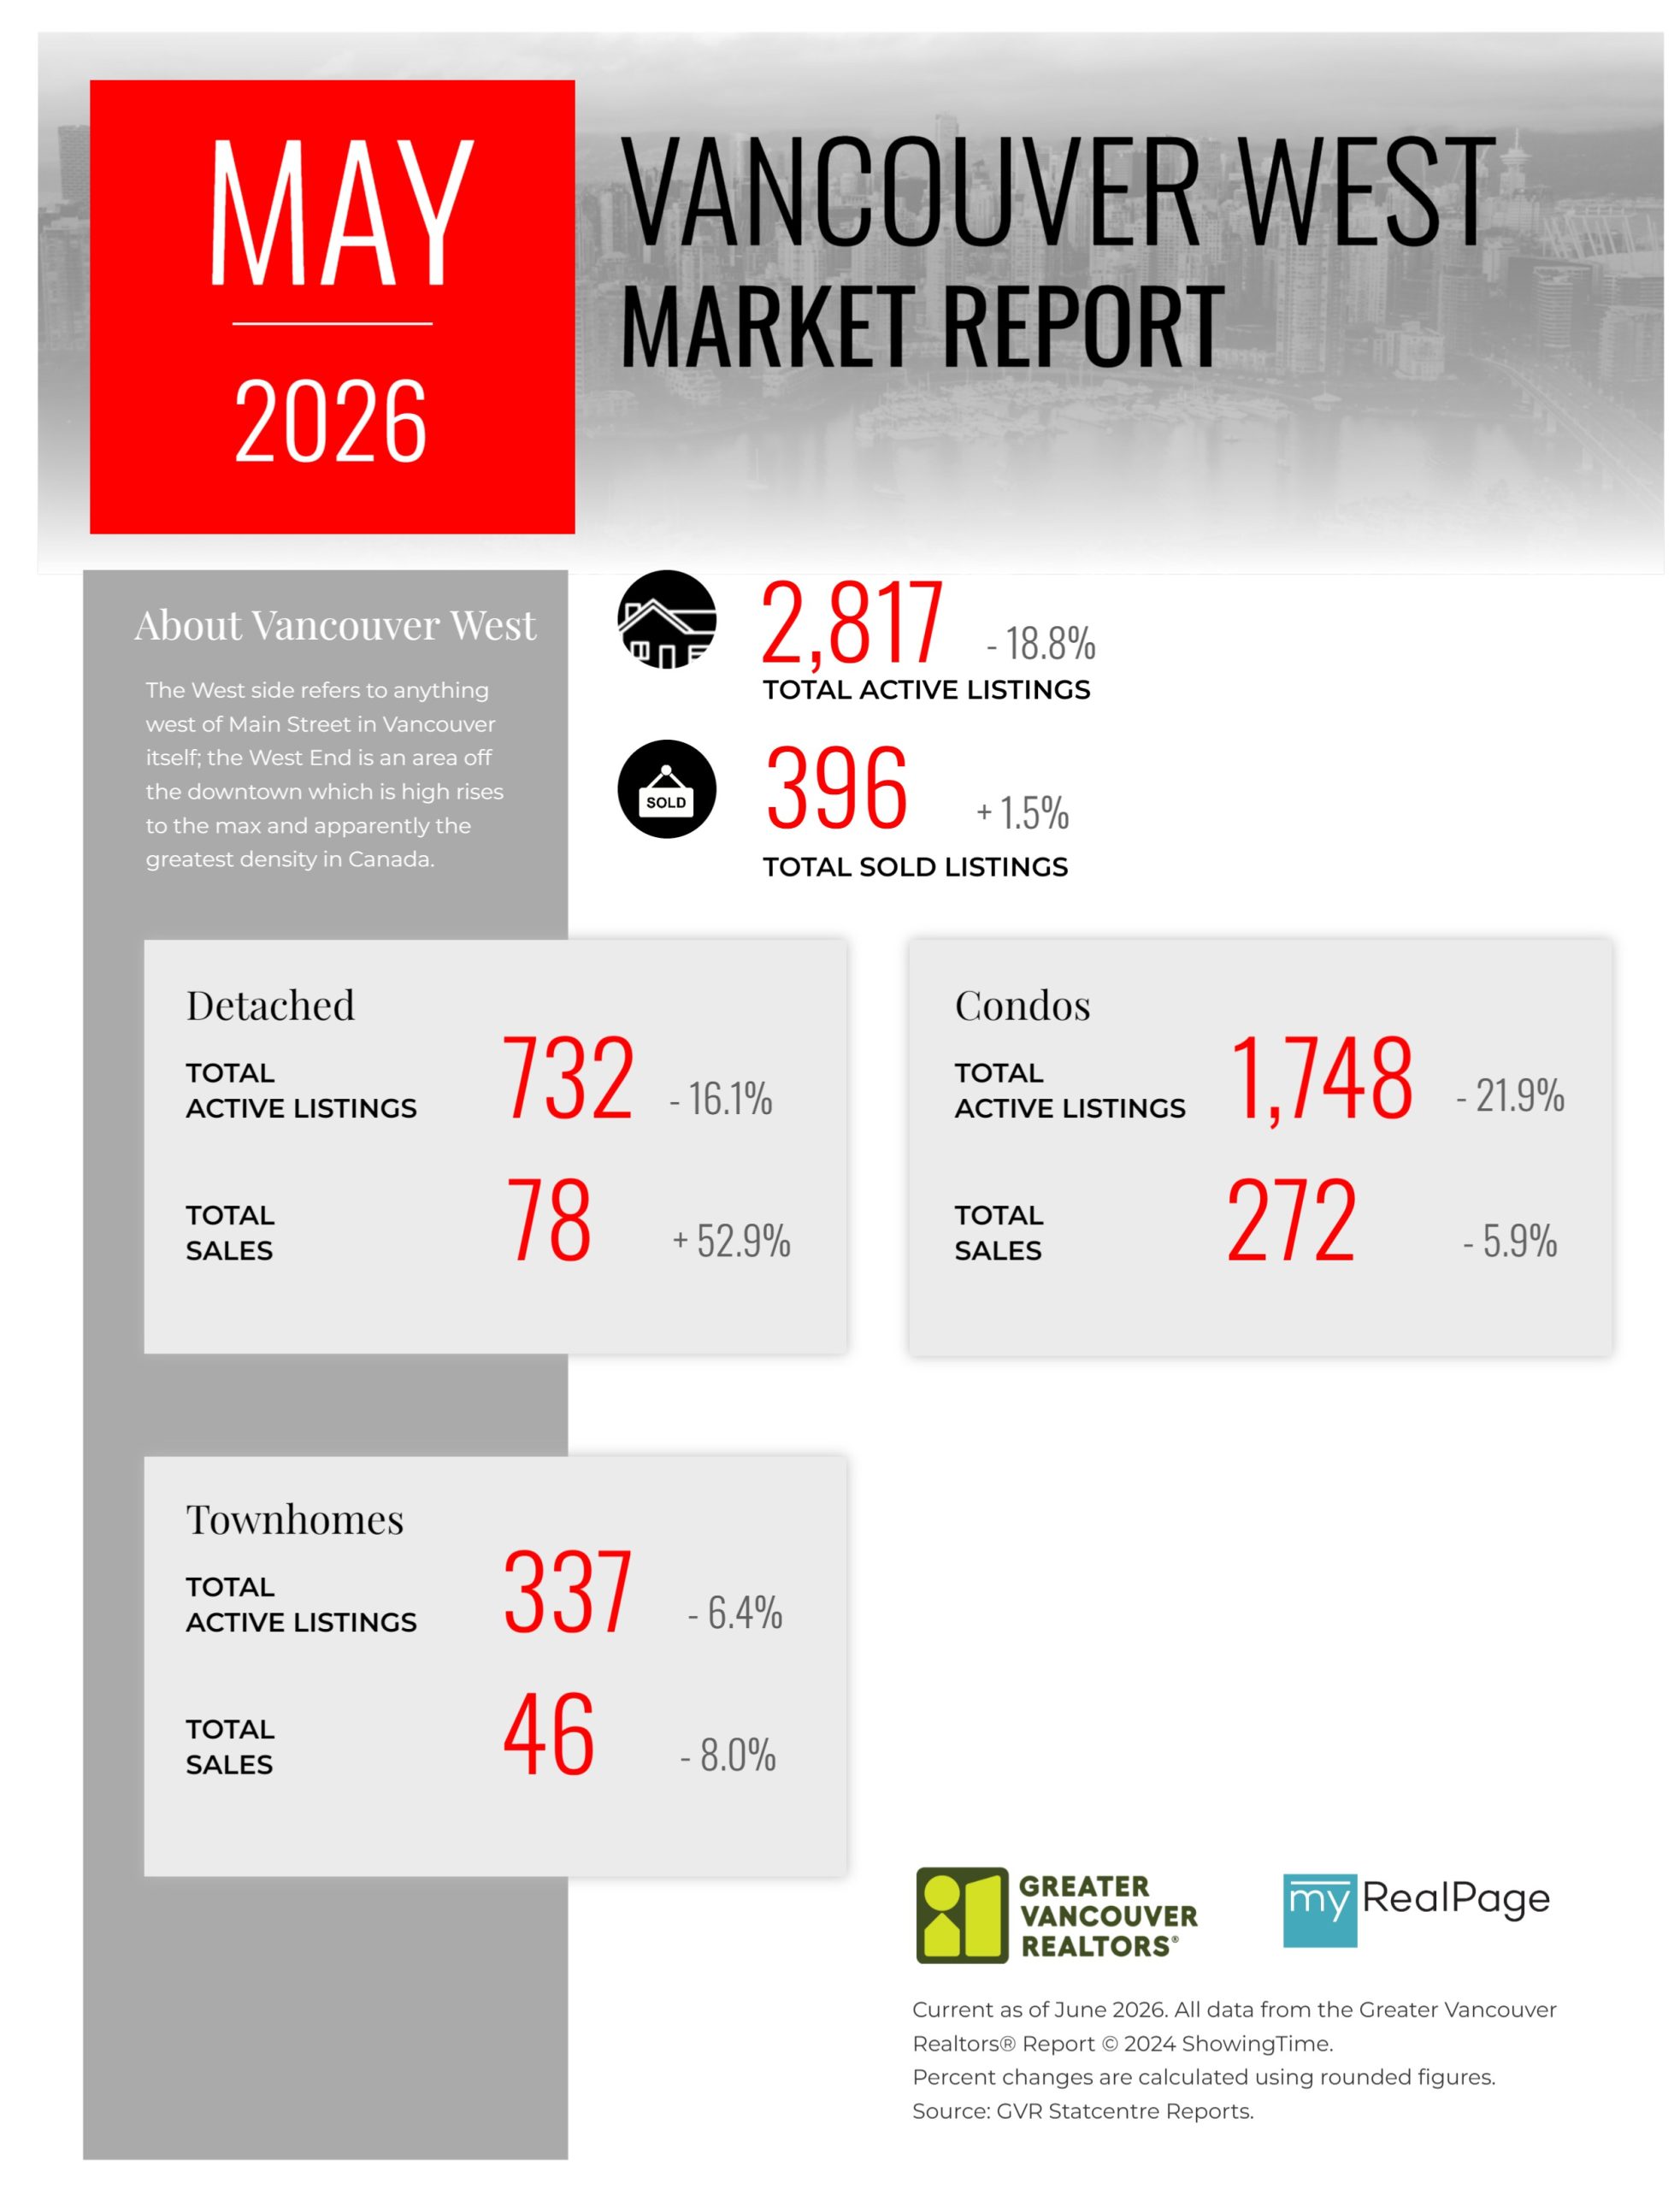
Printable Version – GVR May 2026 Data Infographics Report Vancouver West
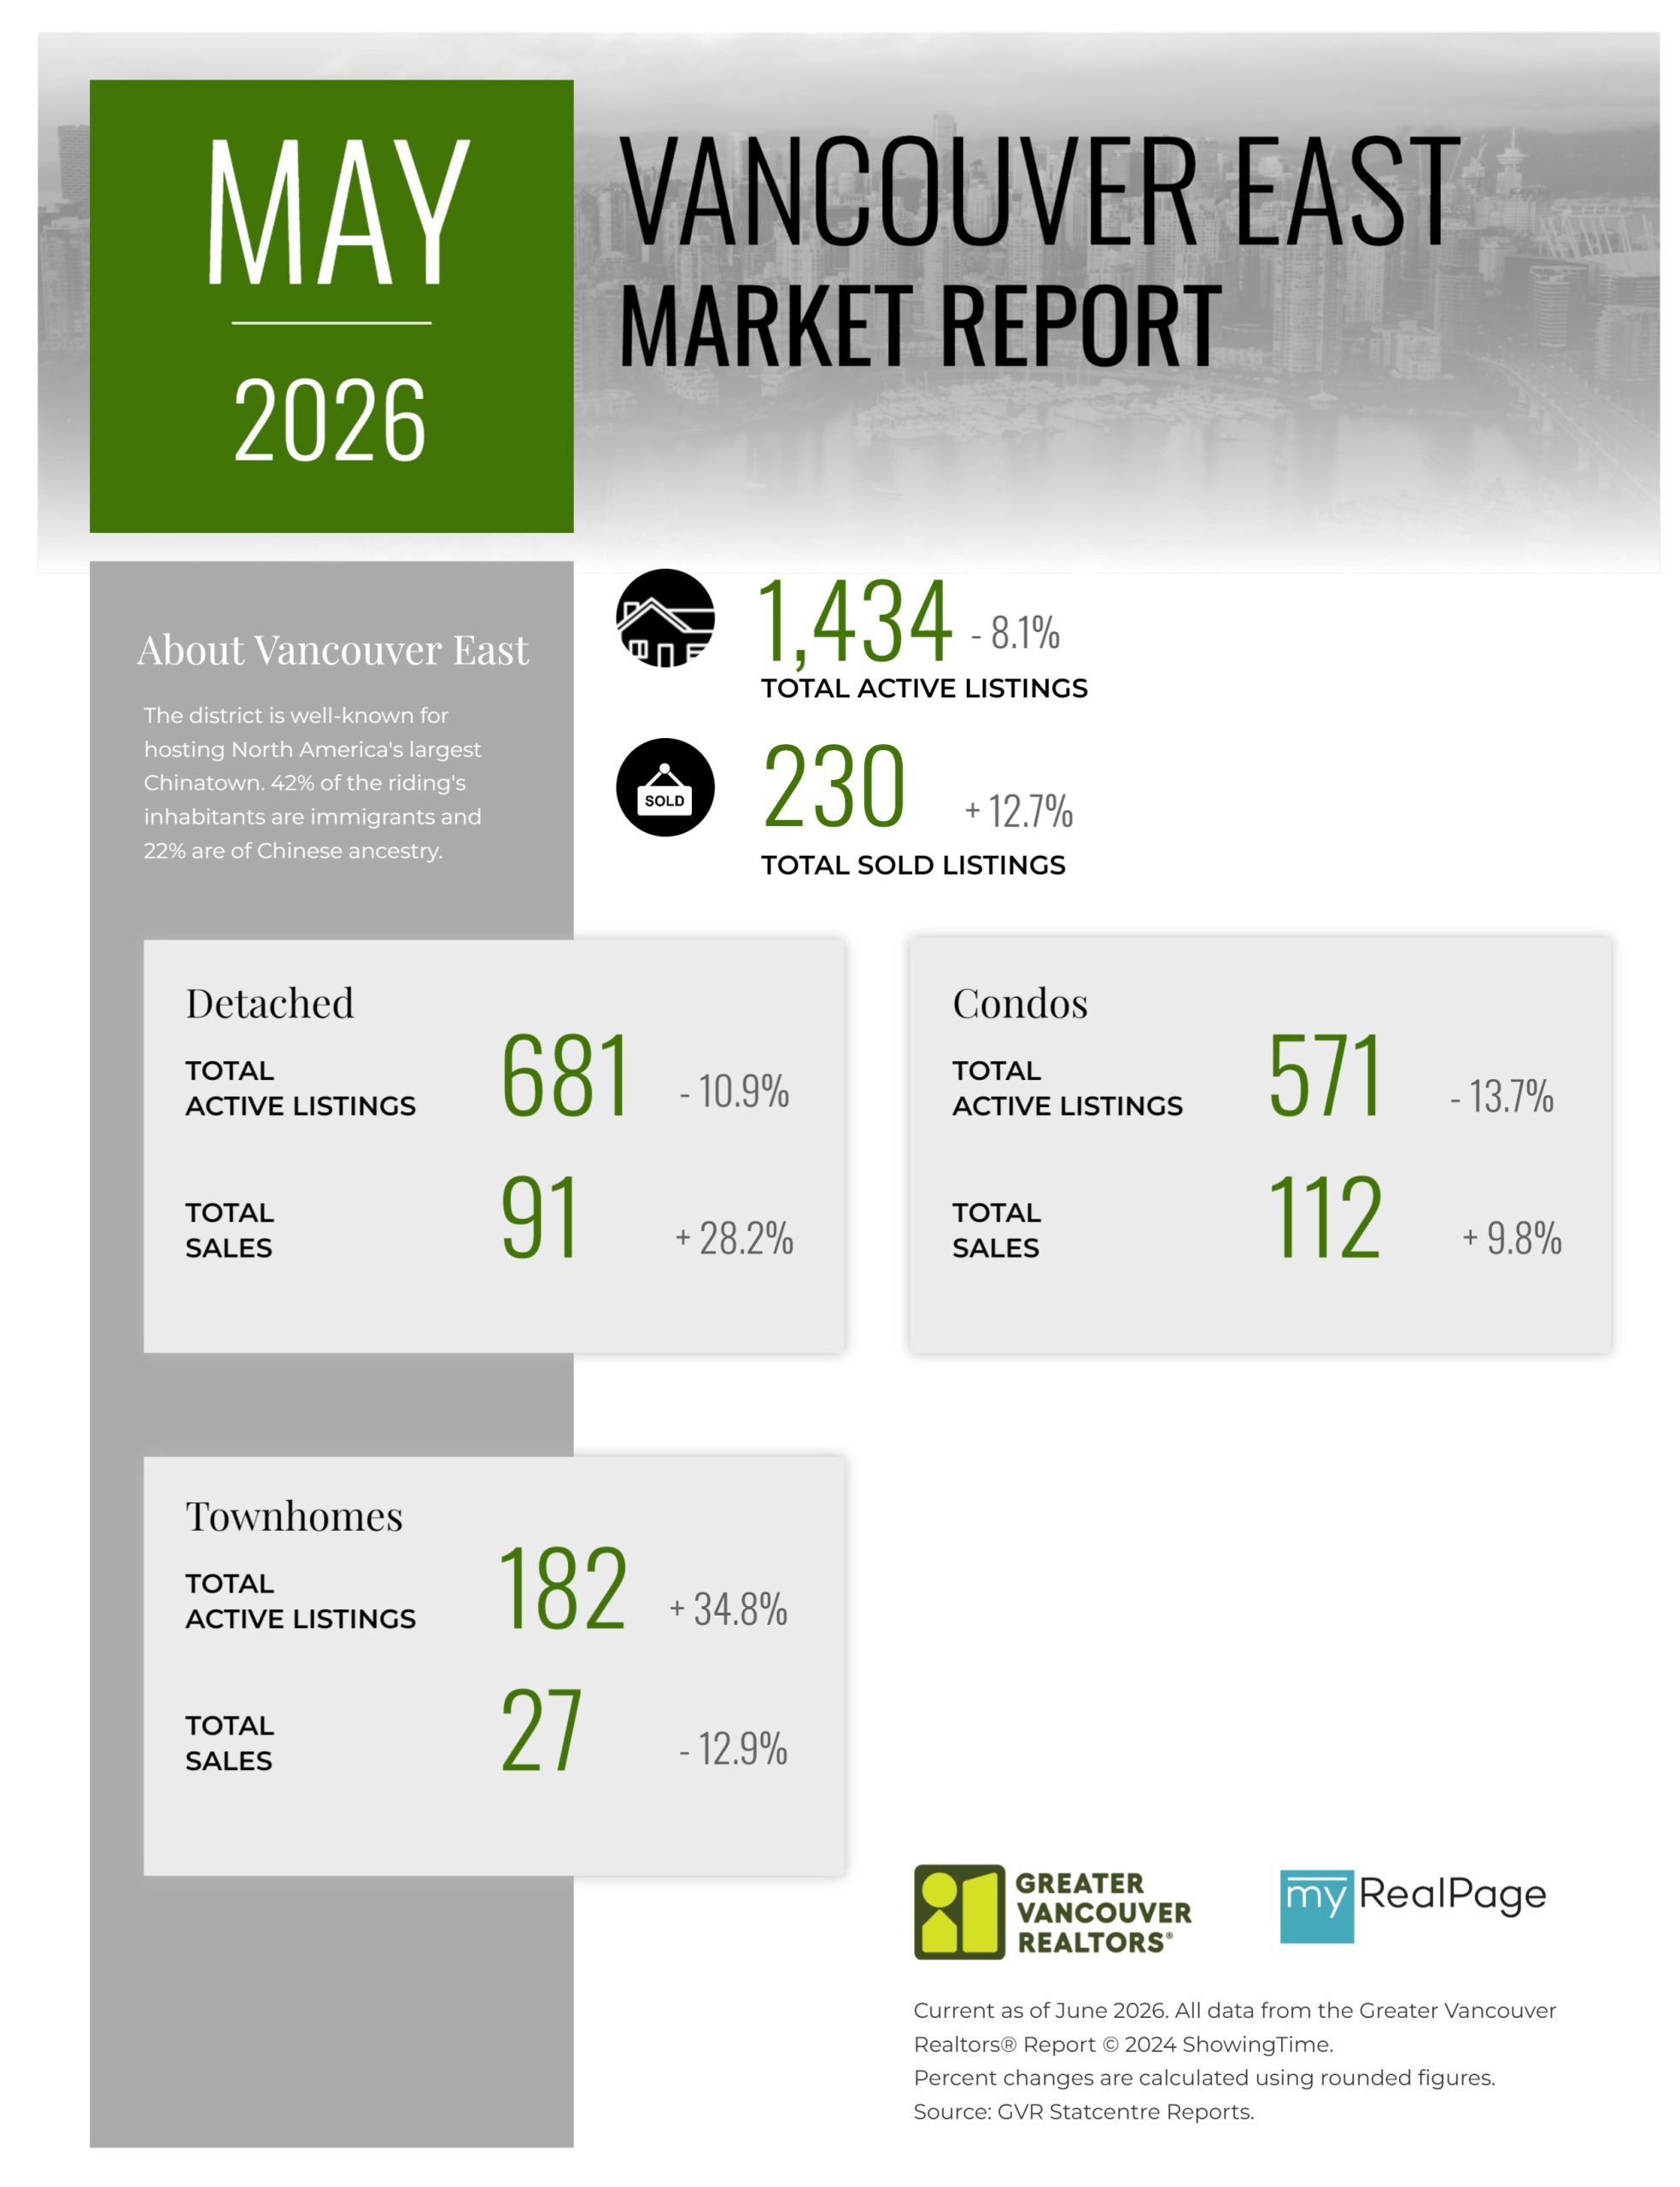
Printable Version – GVR May 2026 Data Infographics Report Vancouver East
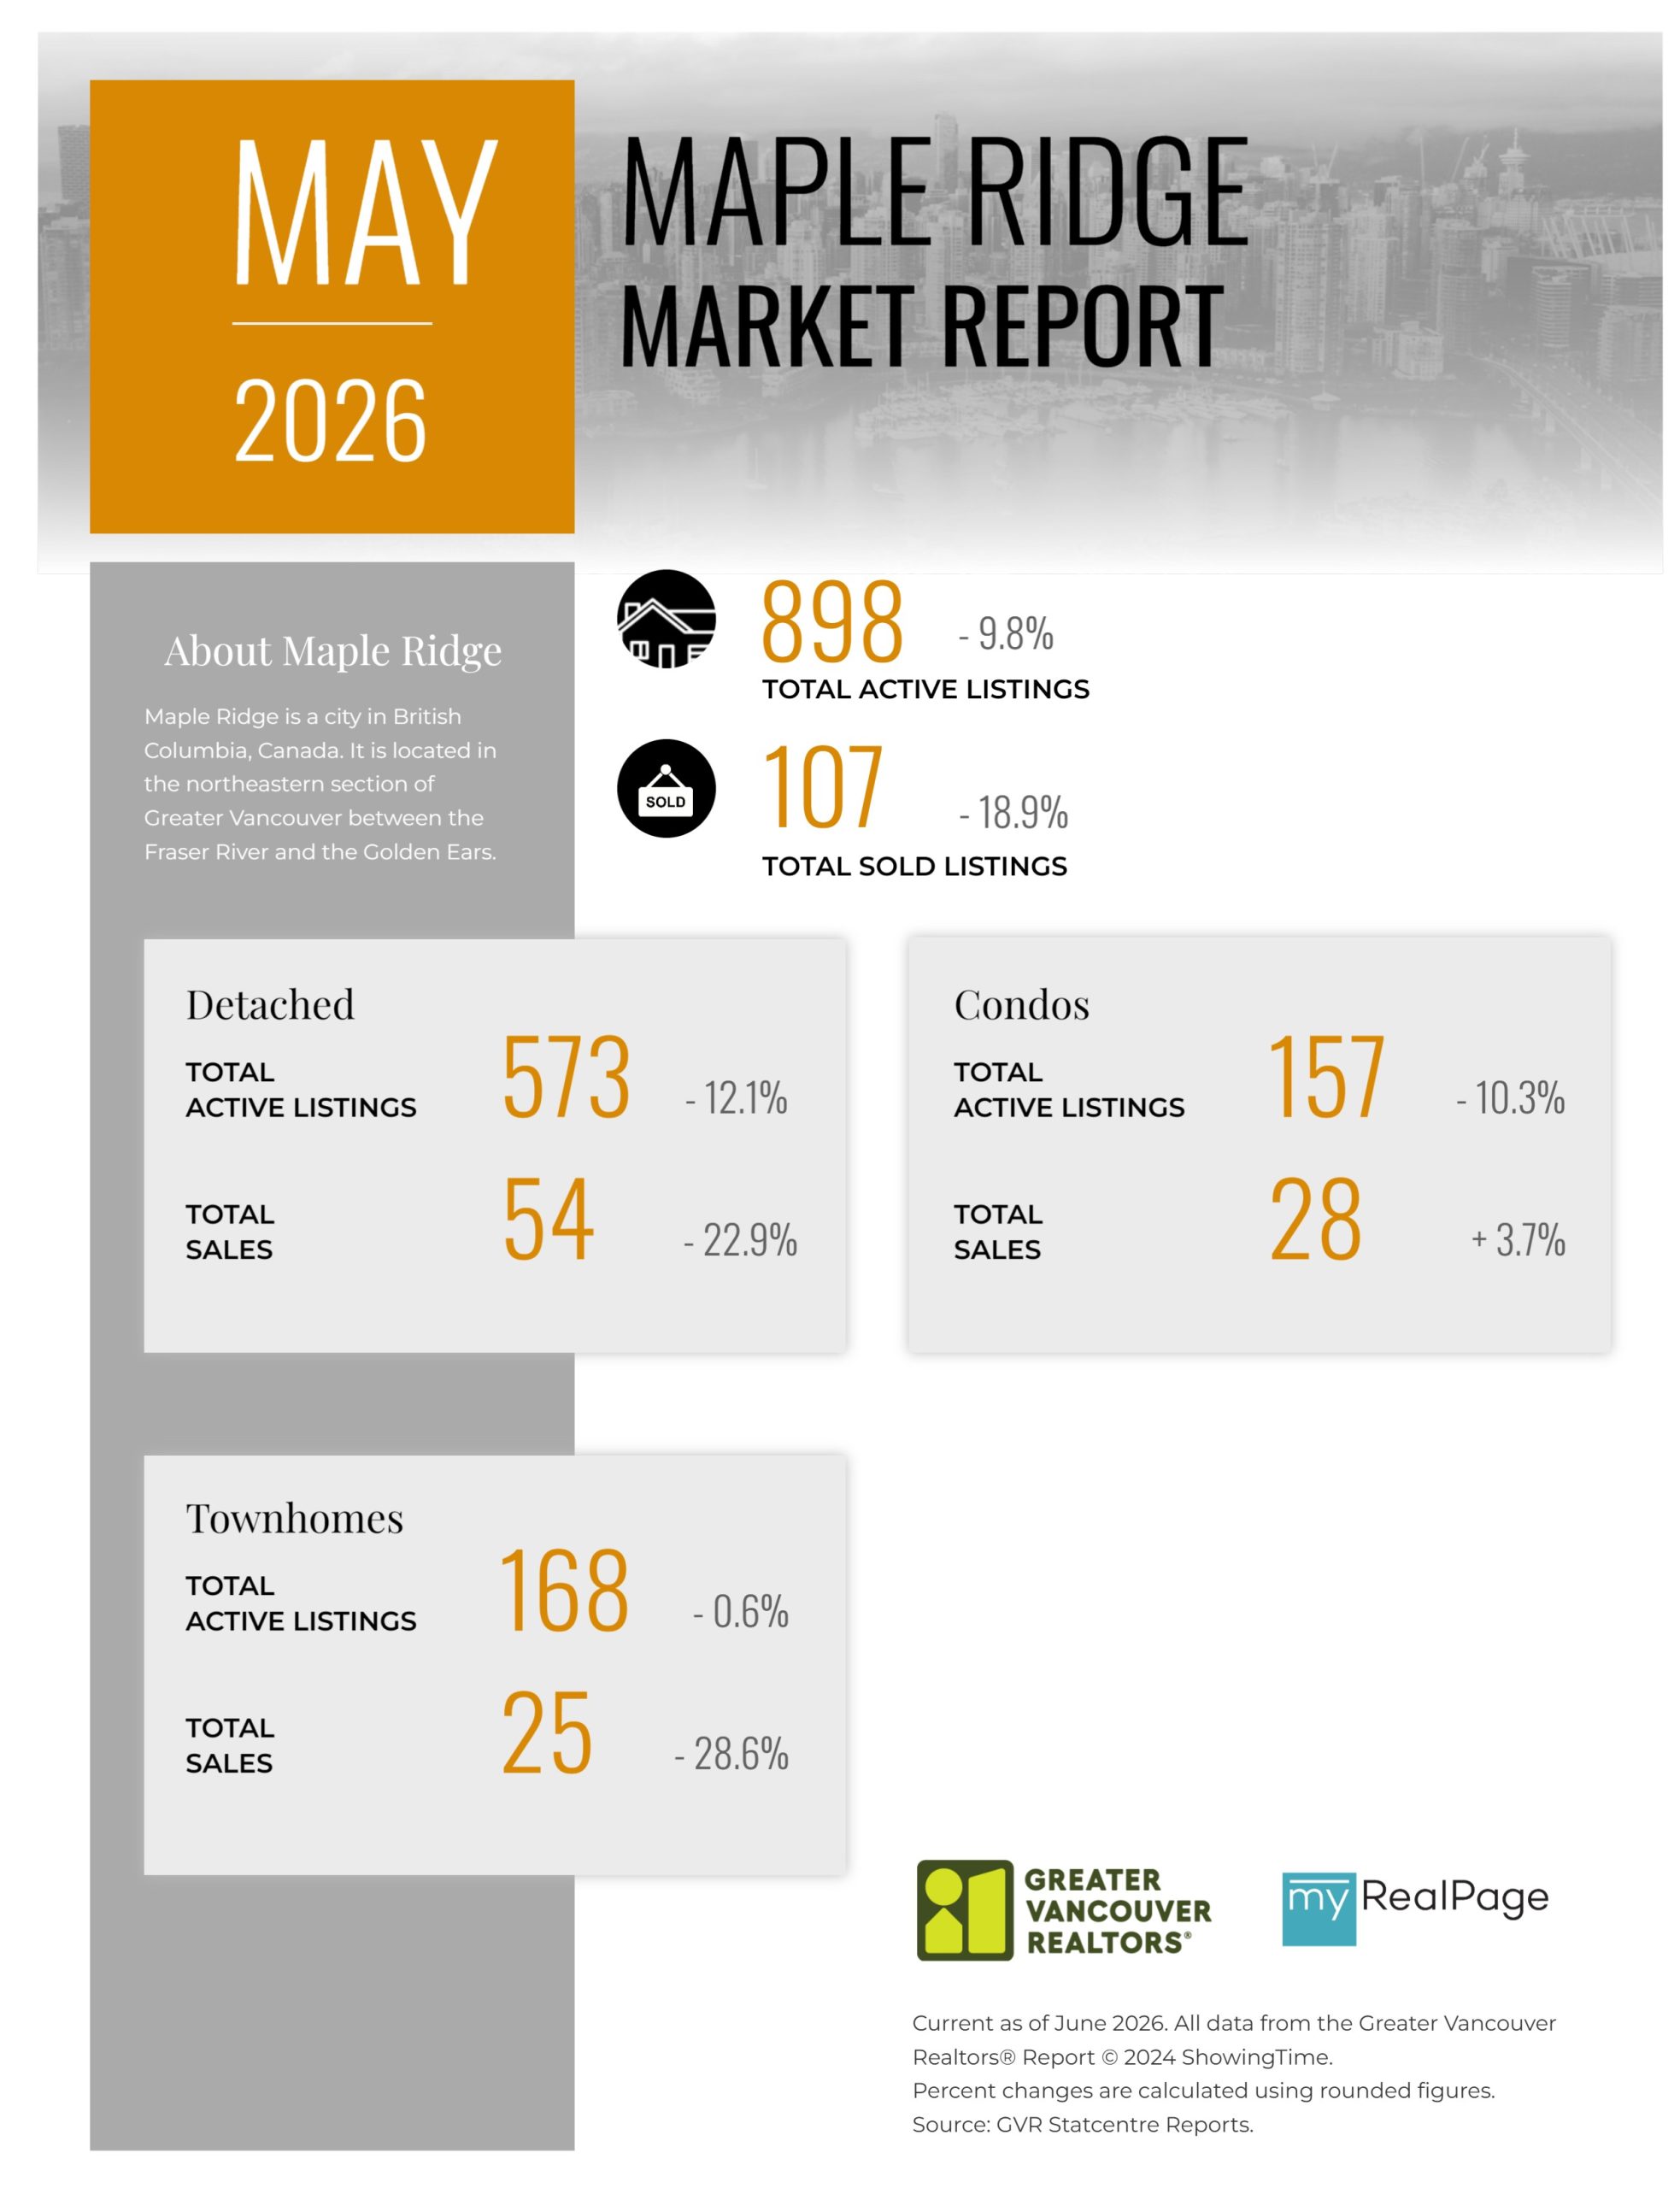
Printable Version – GVR May 2026 Data Infographic Report Maple Ridge
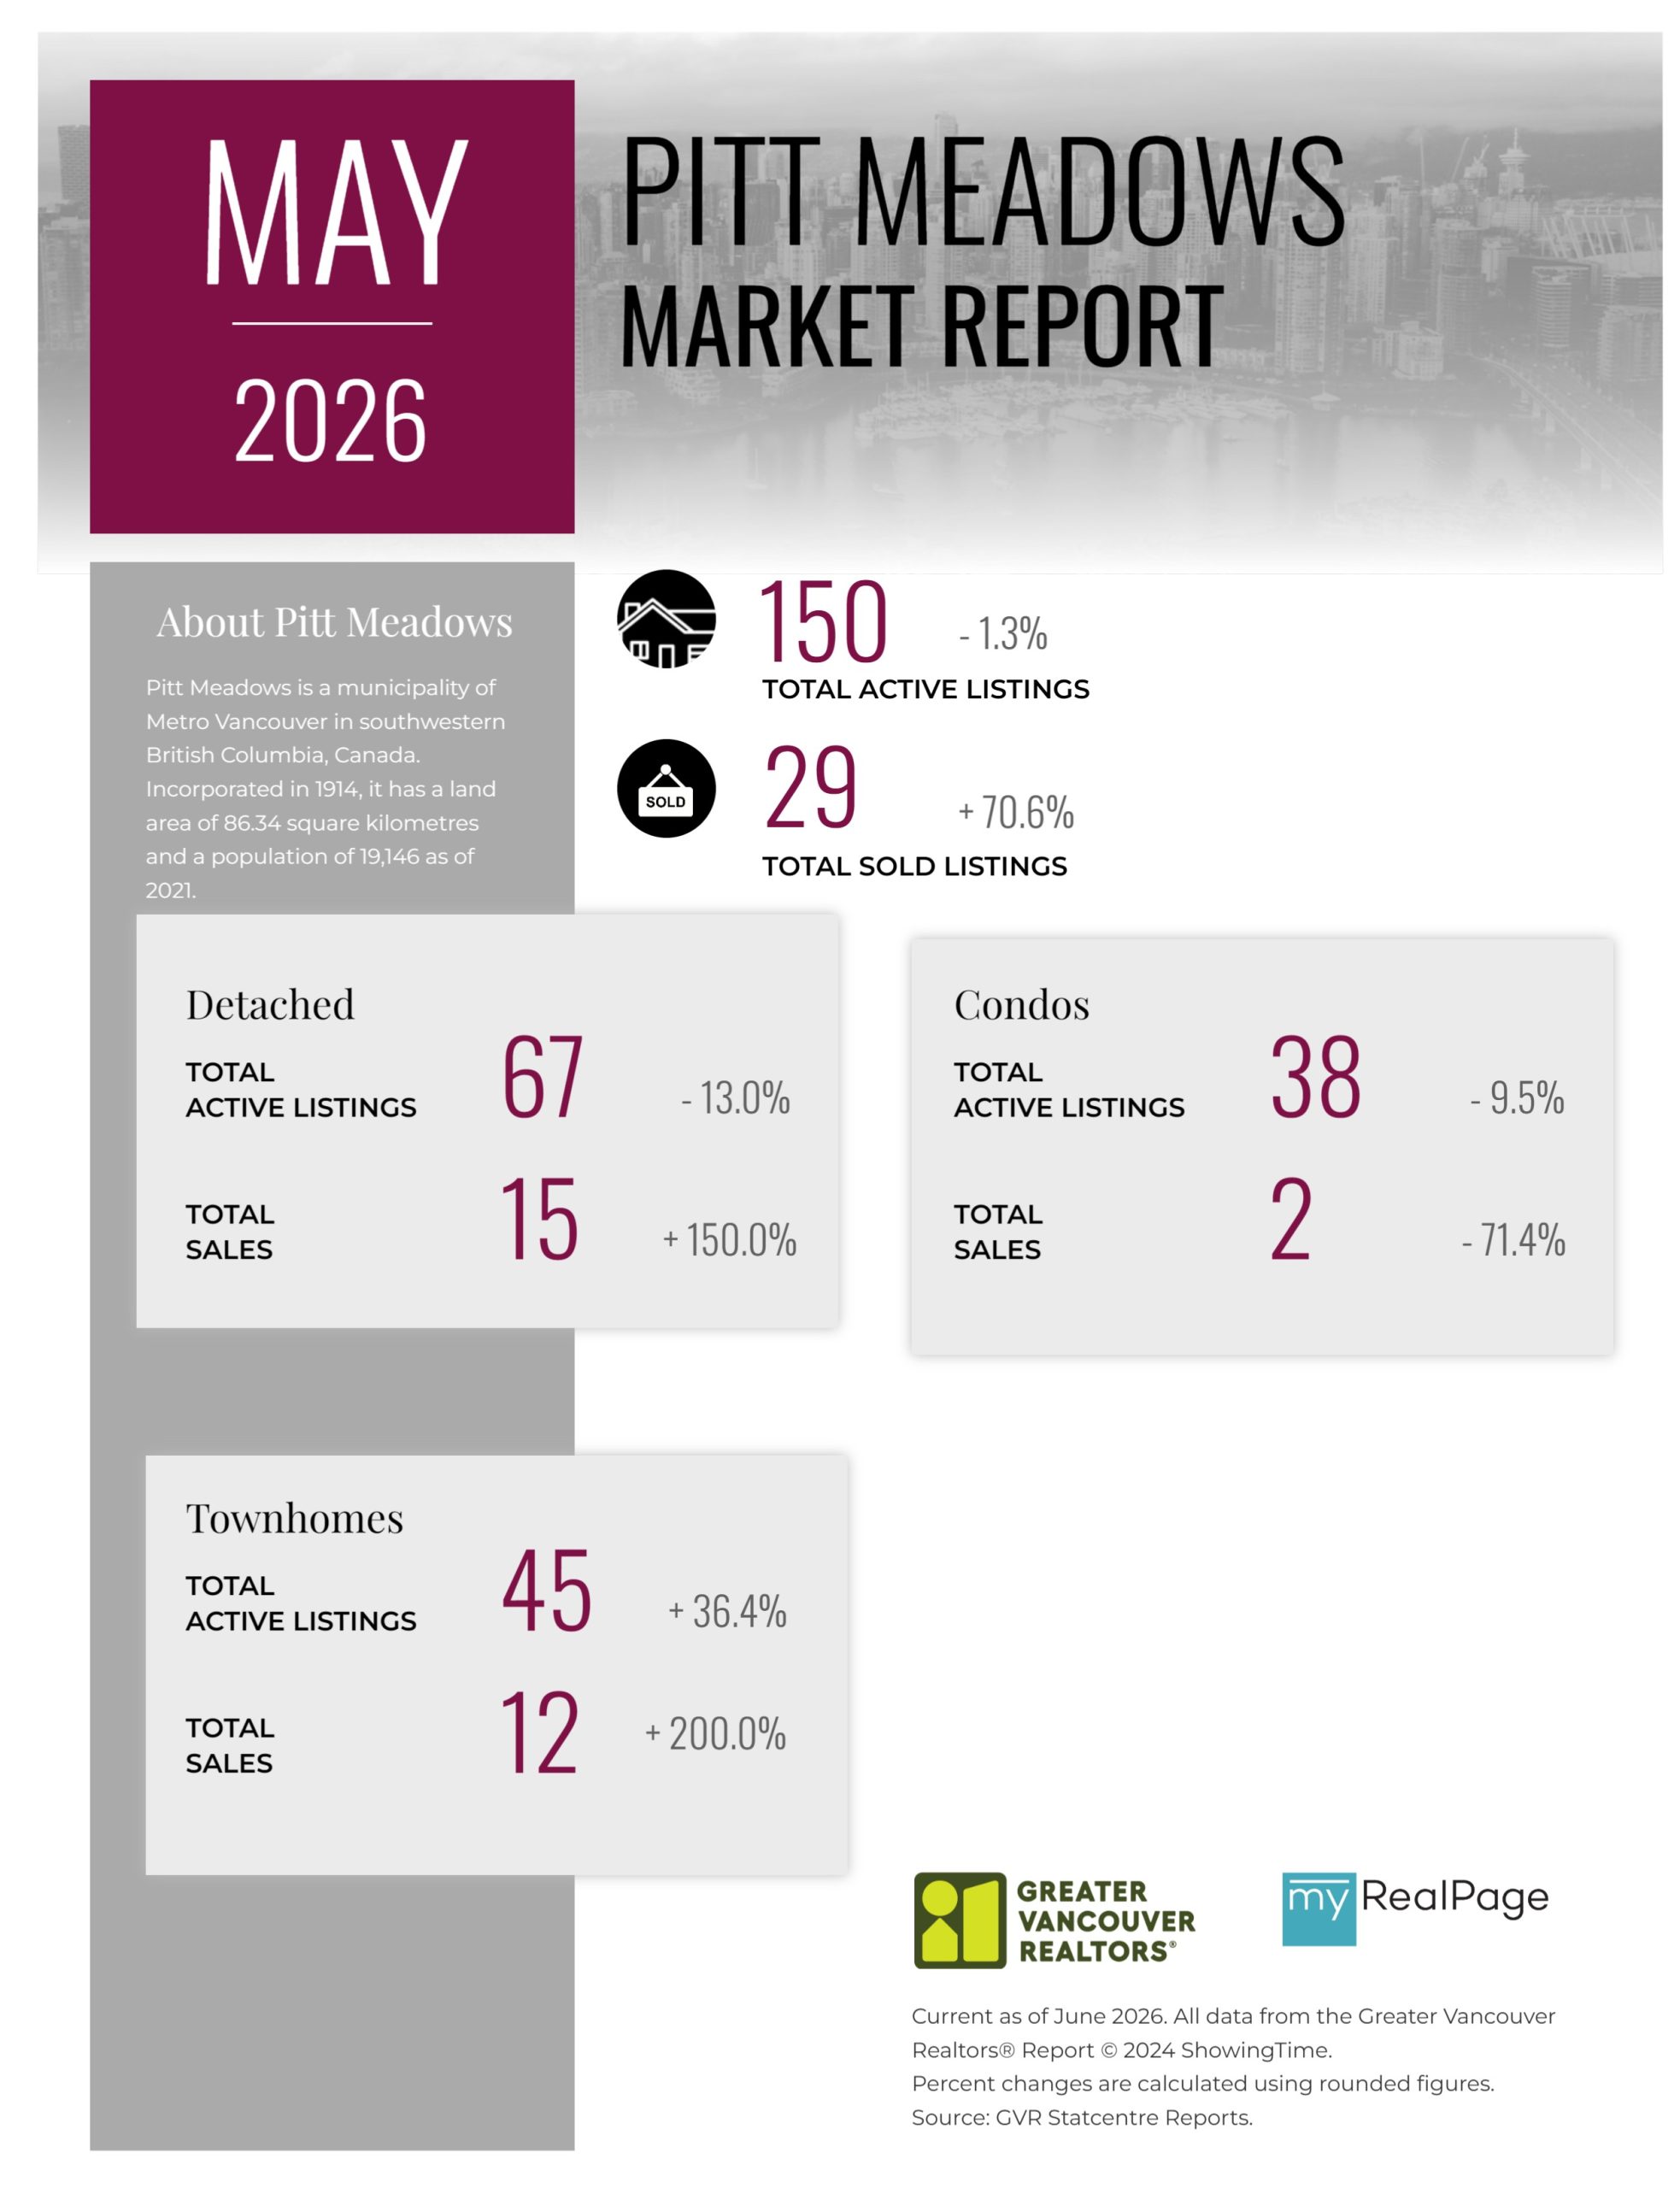
Printable Version – GVR May 2026 Data Infographics Report Pitt Meadows
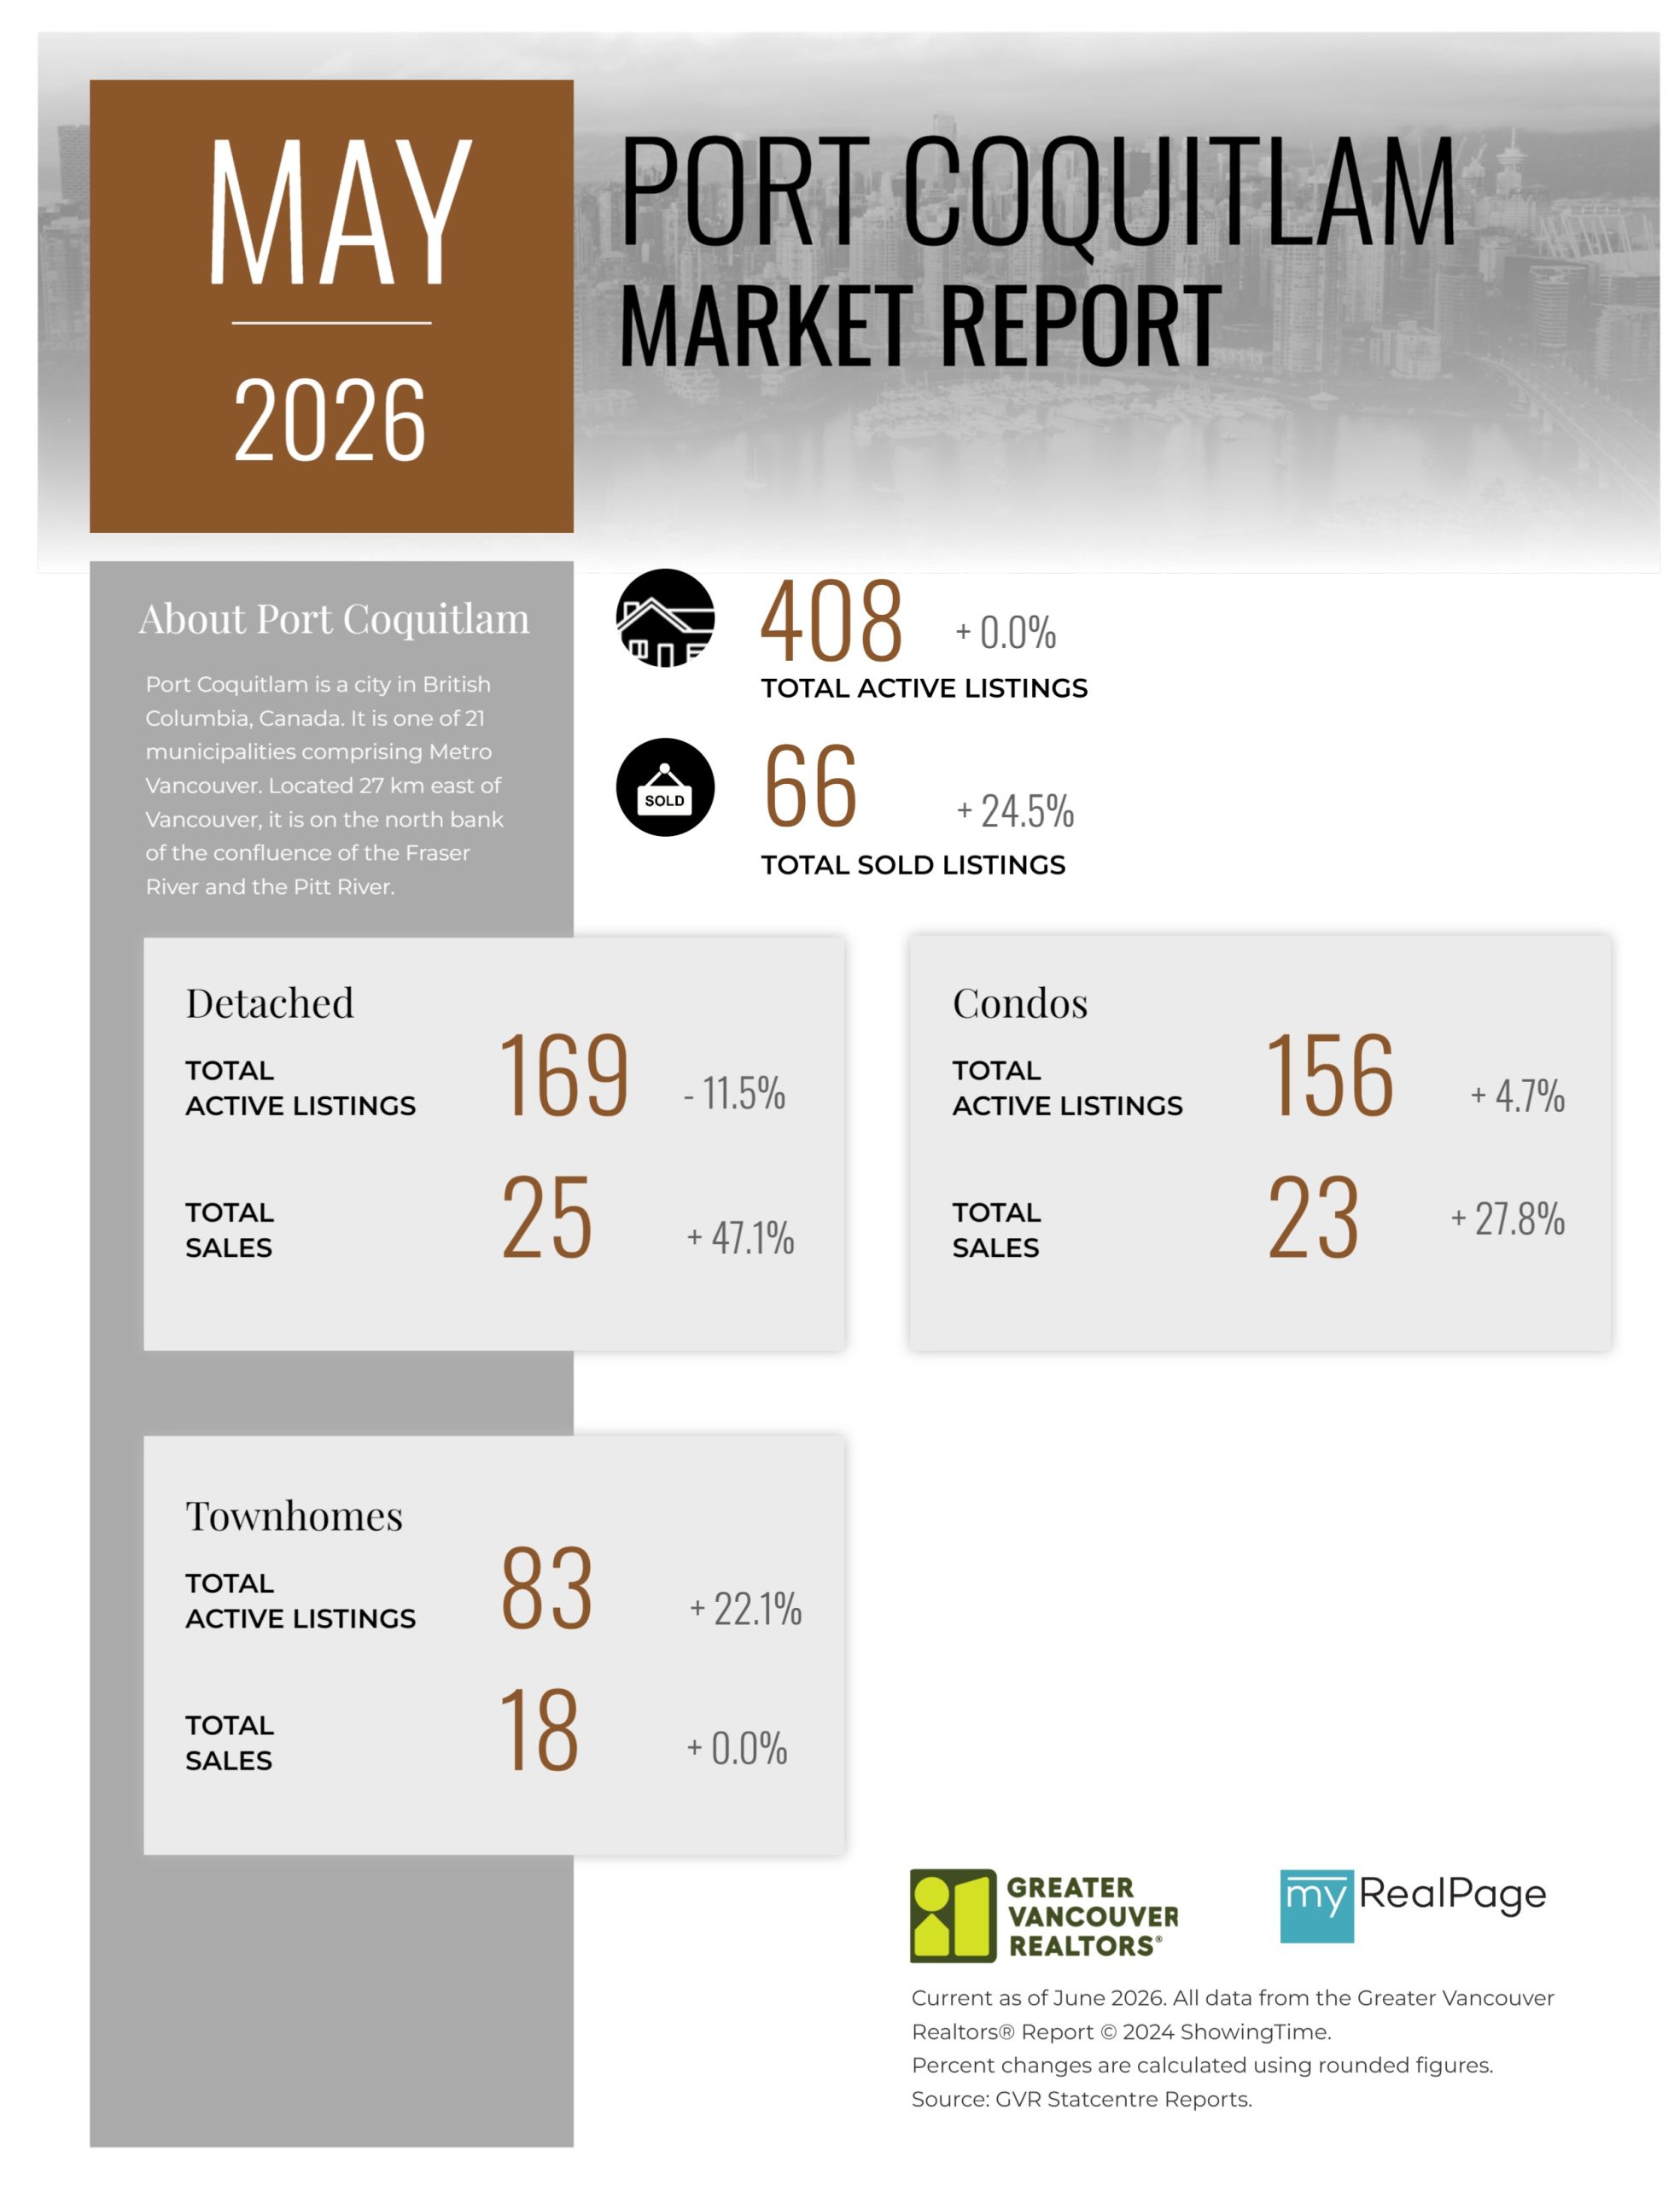
Printable Version – GVR May 2026 Data Infographics Report Port Coquitlam
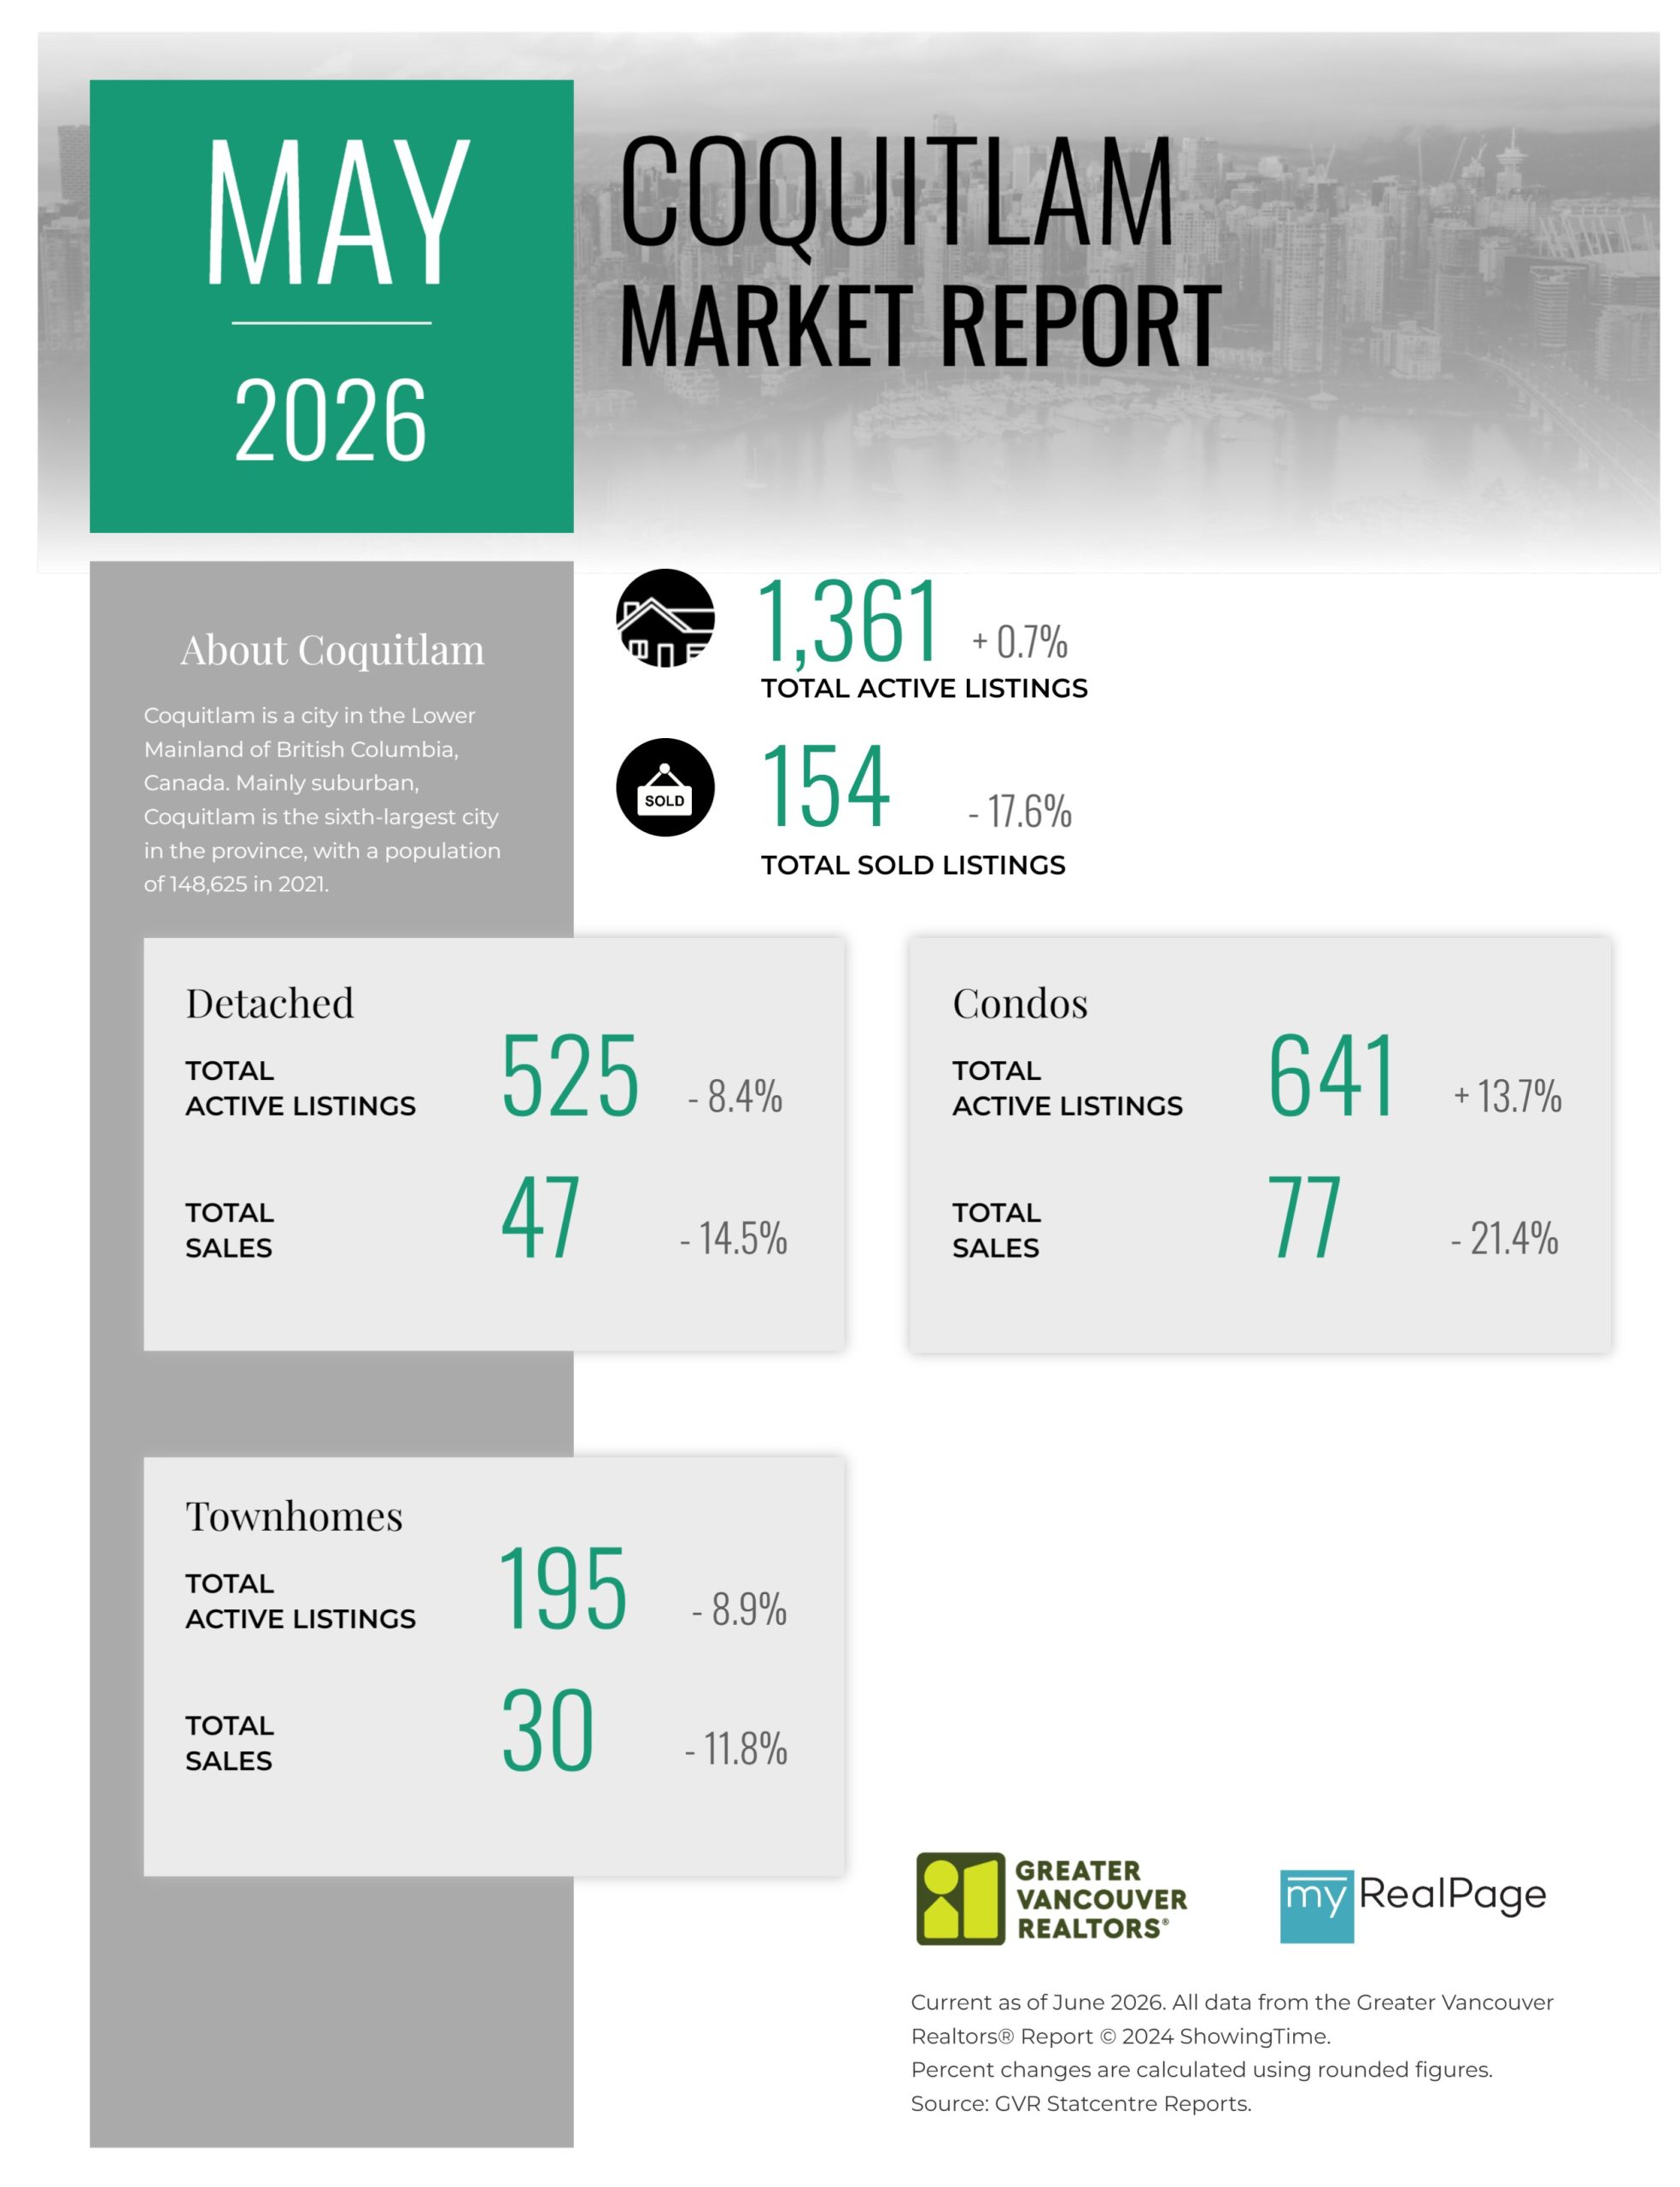
Printable Version – GVR May 2026 Data Infographics Report Coquitlam
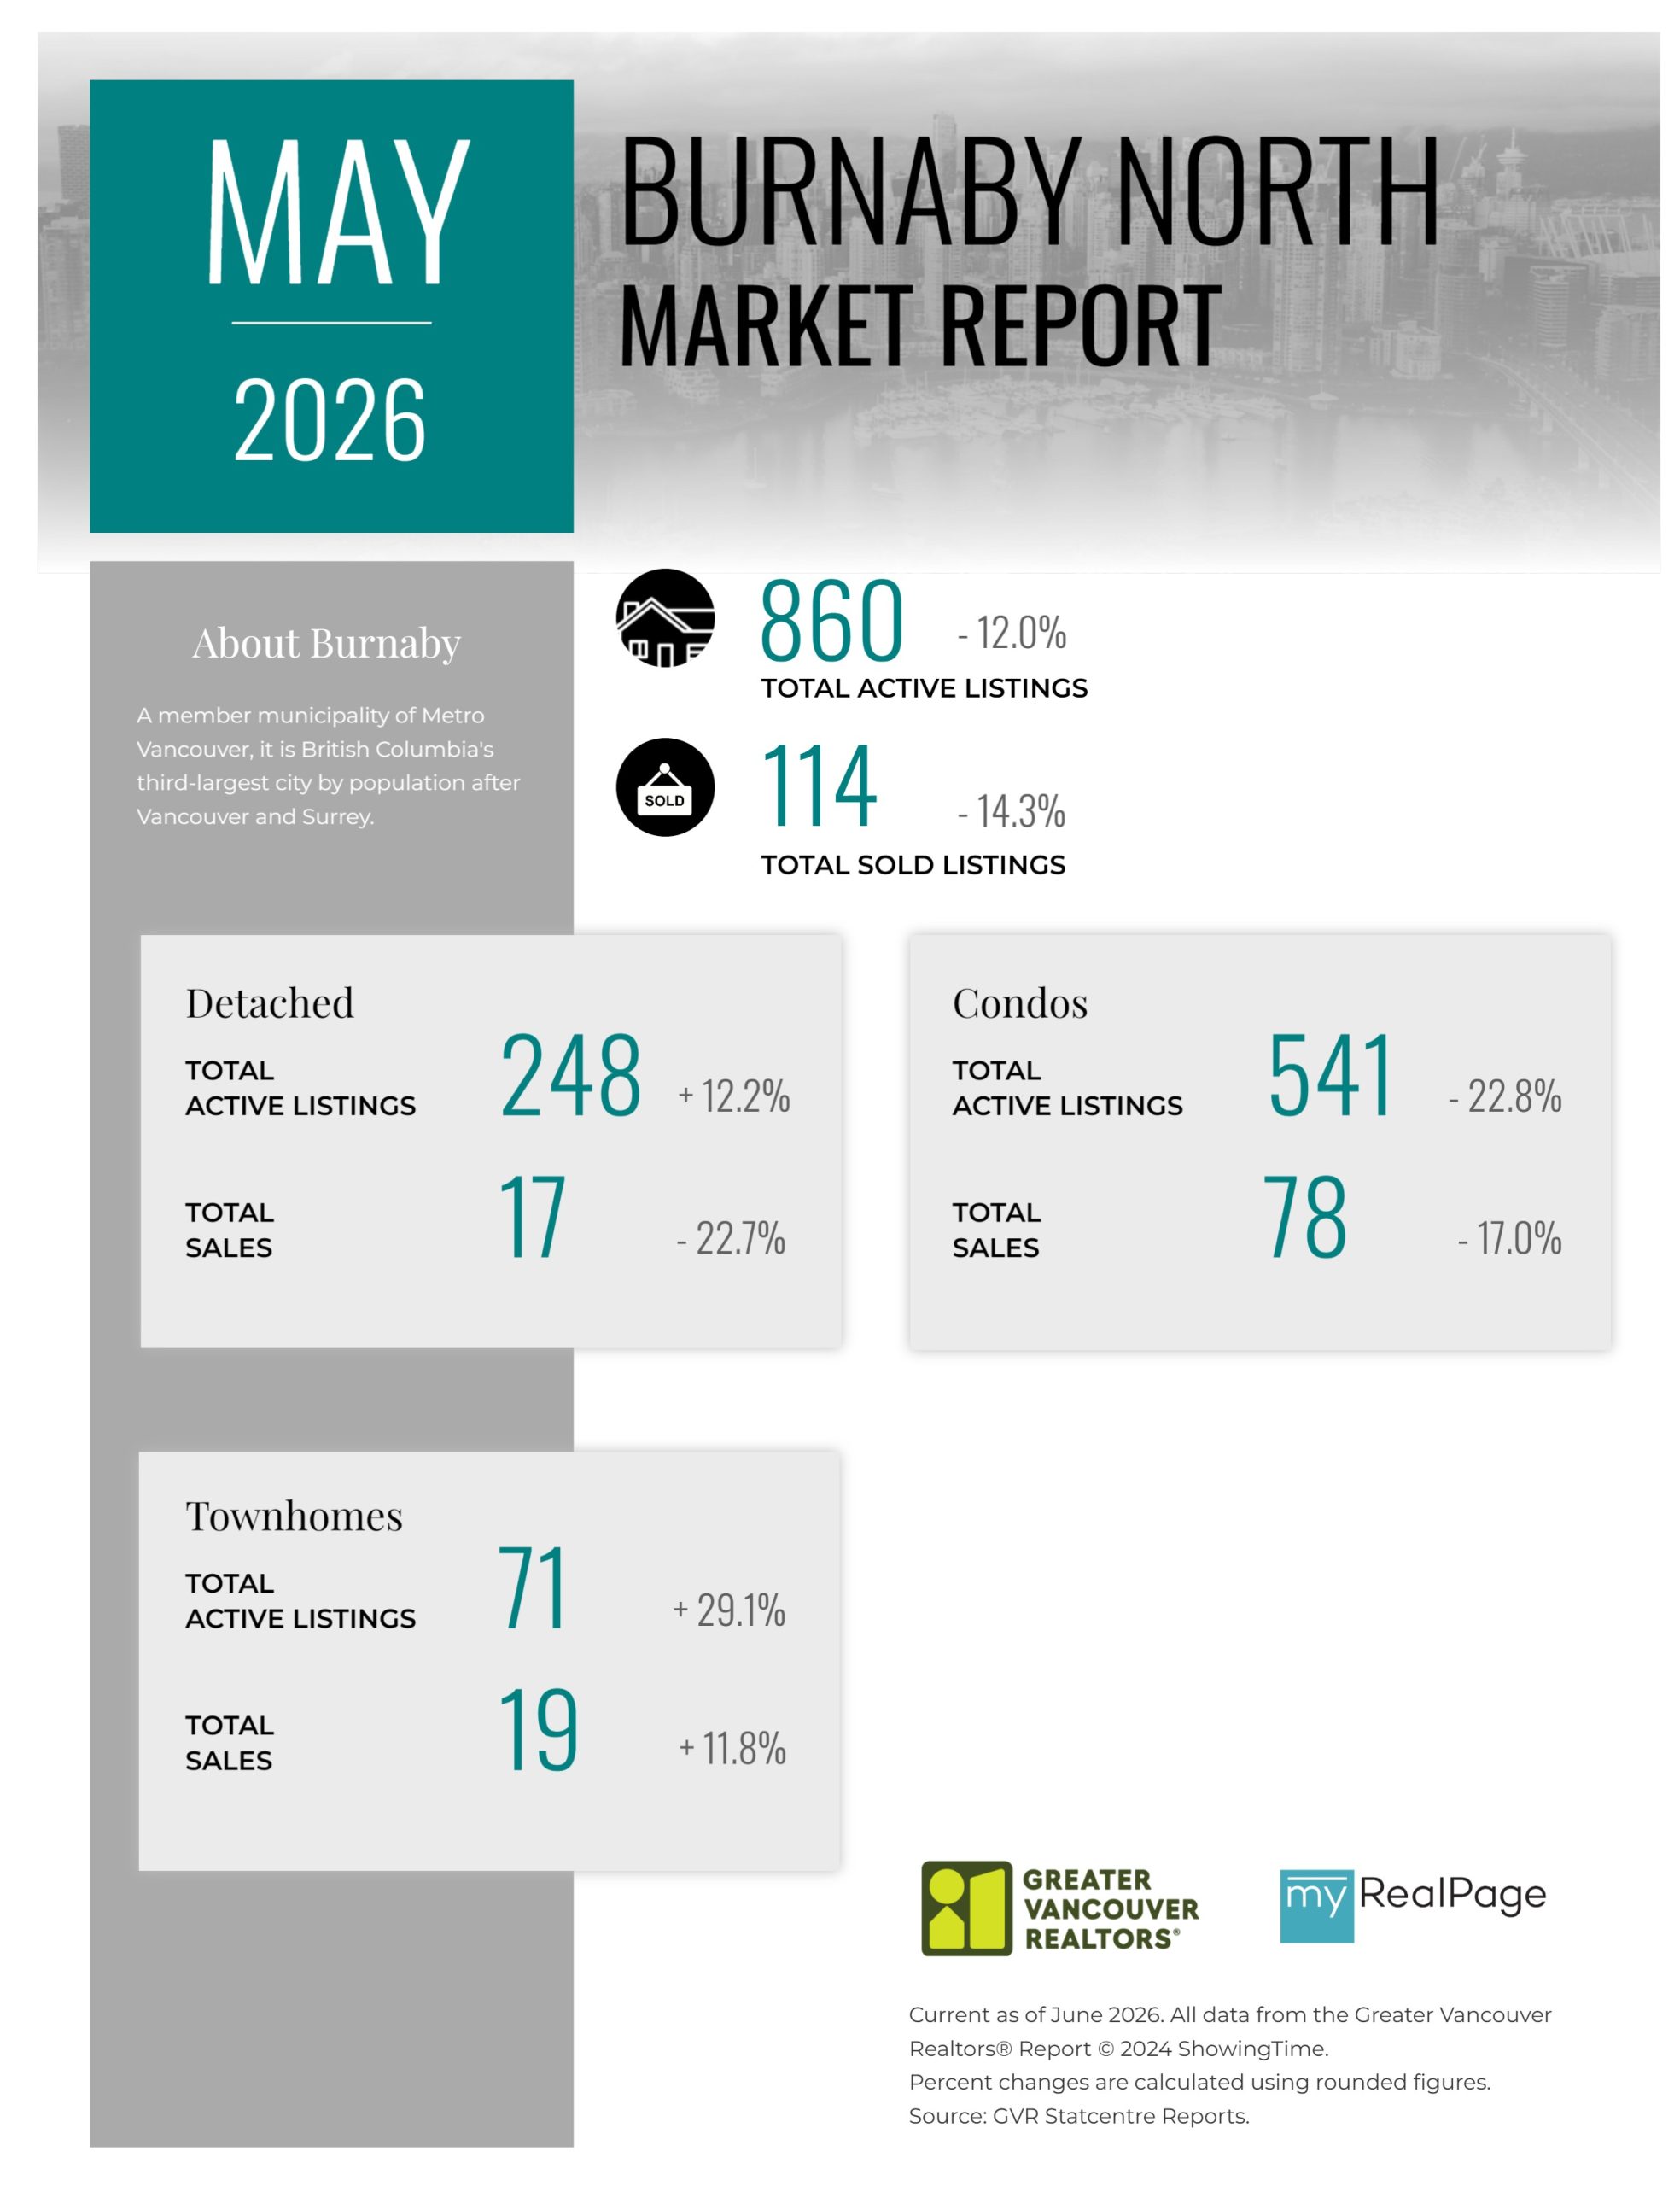
Printable Version – GVR May 2026 Data Infographic Report Burnaby North
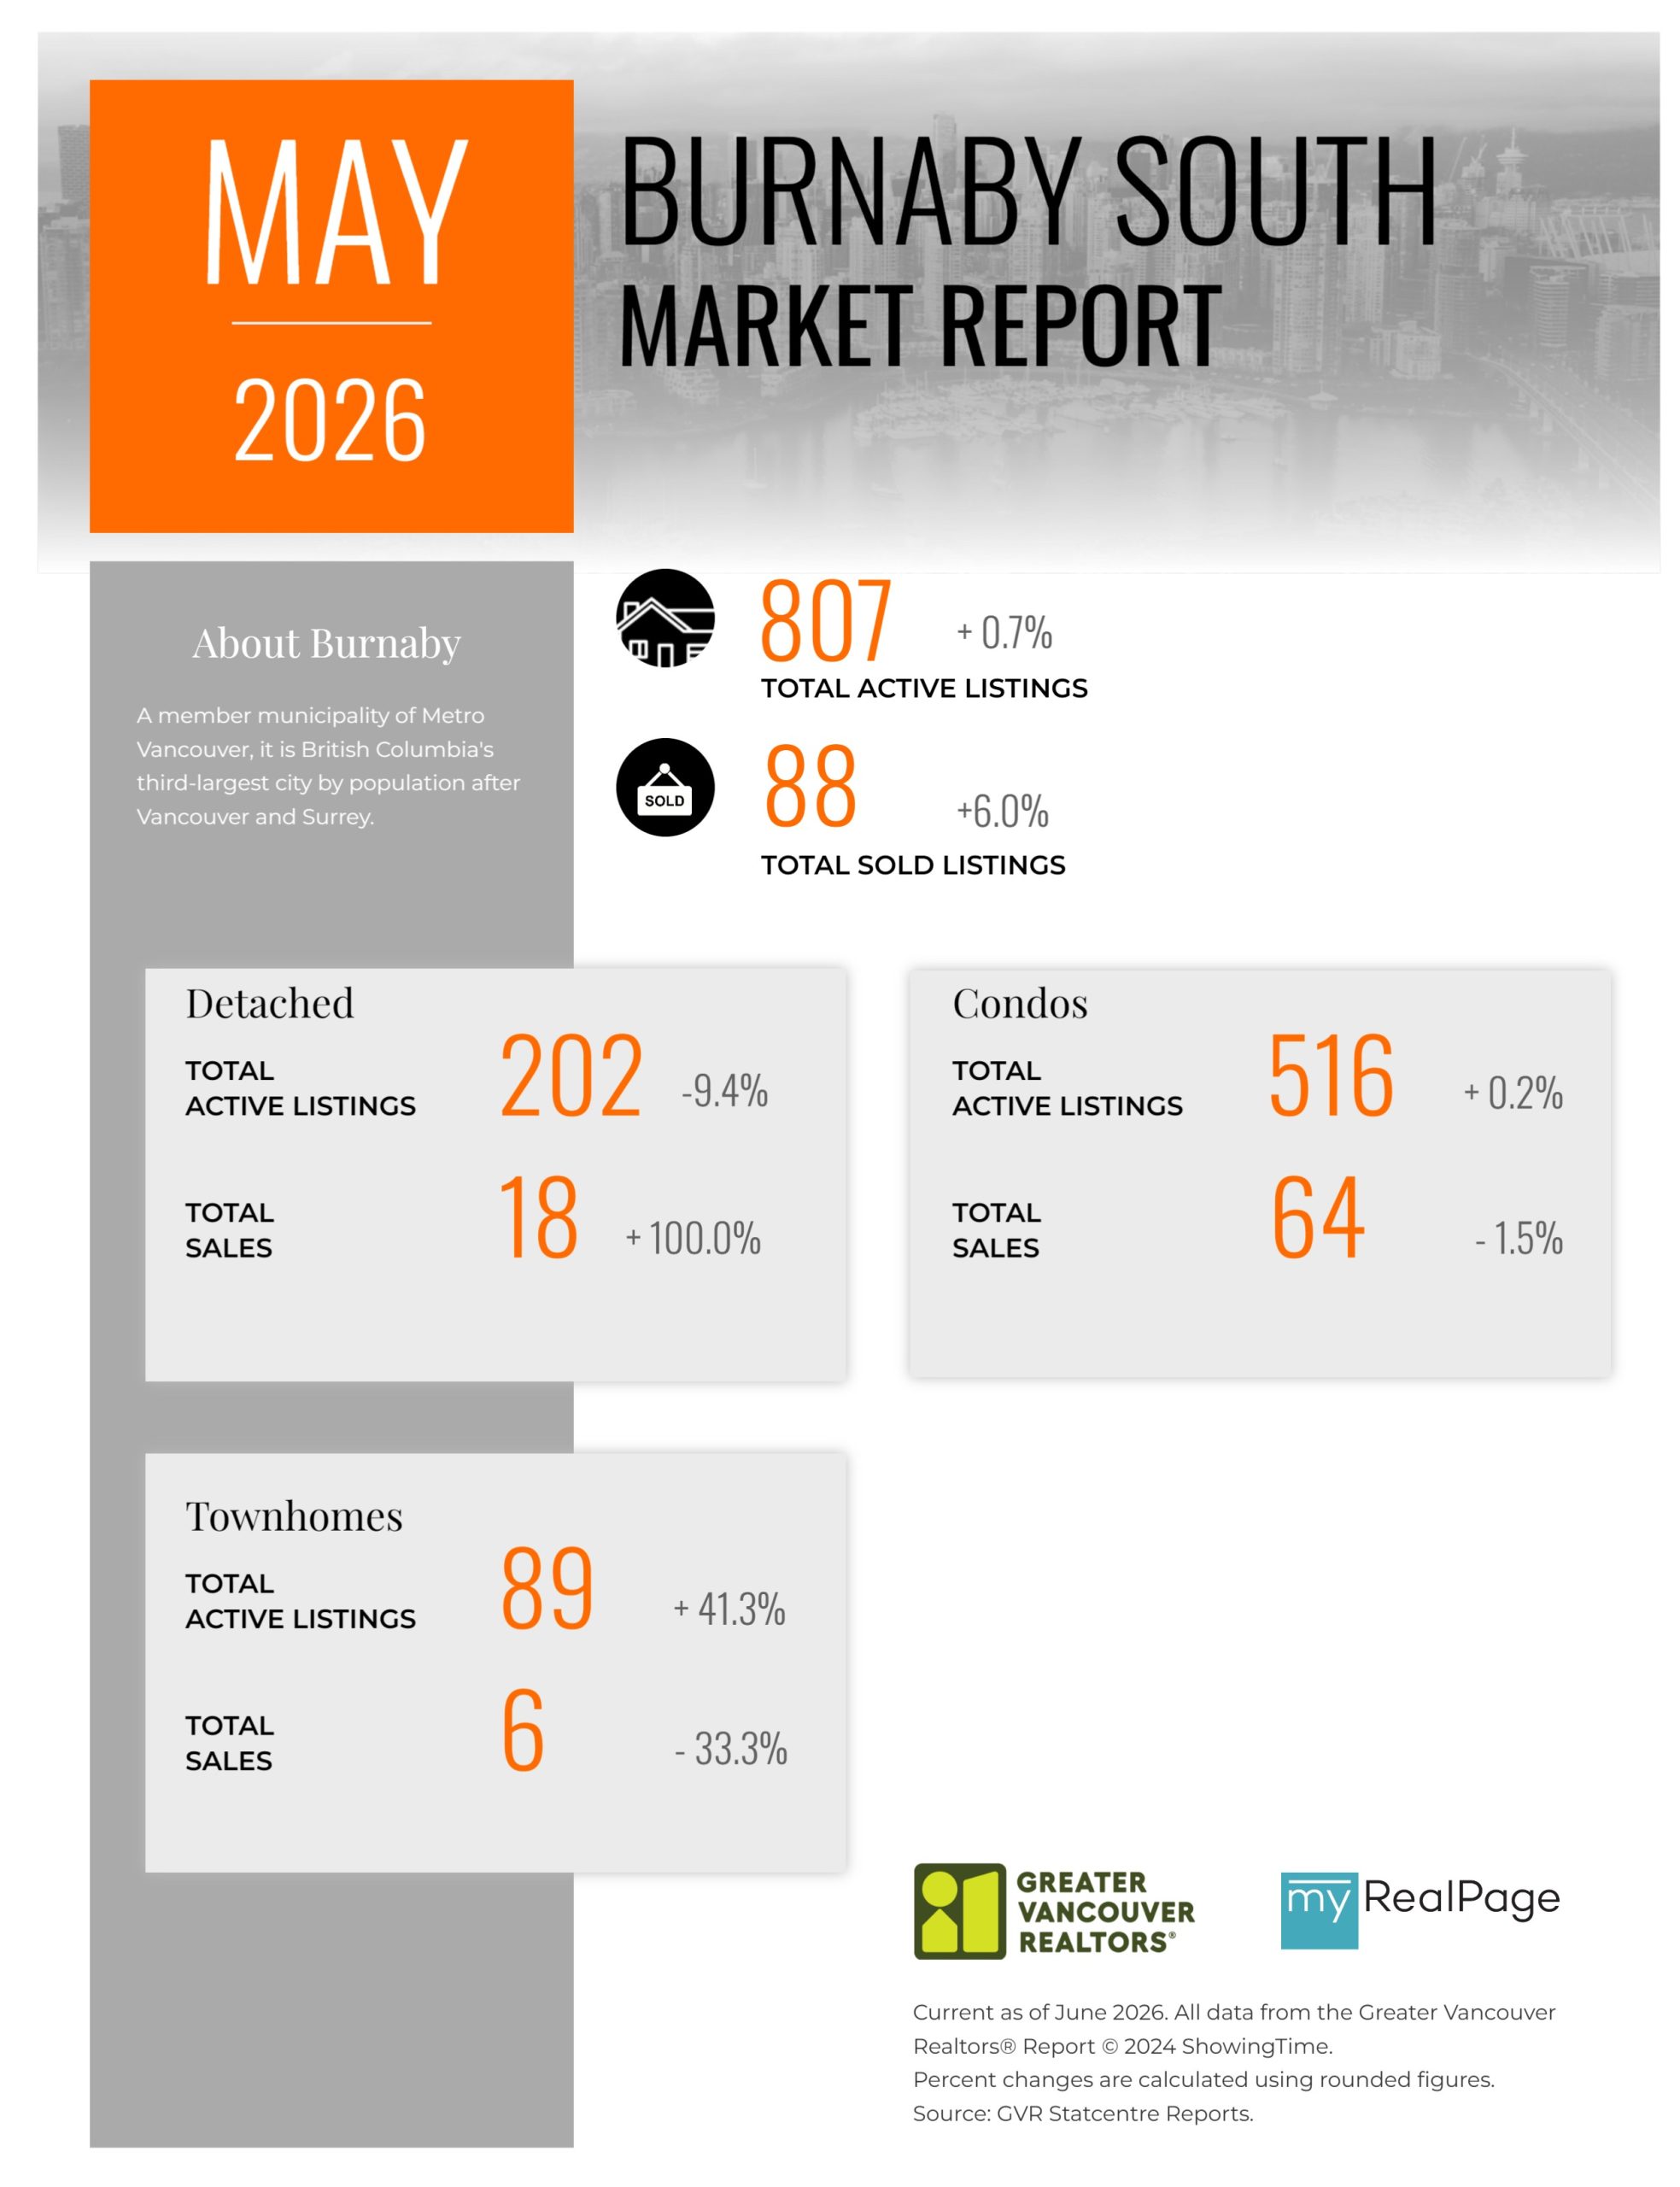
Printable Version – GVR May 2026 Data Infographics Report Burnaby South
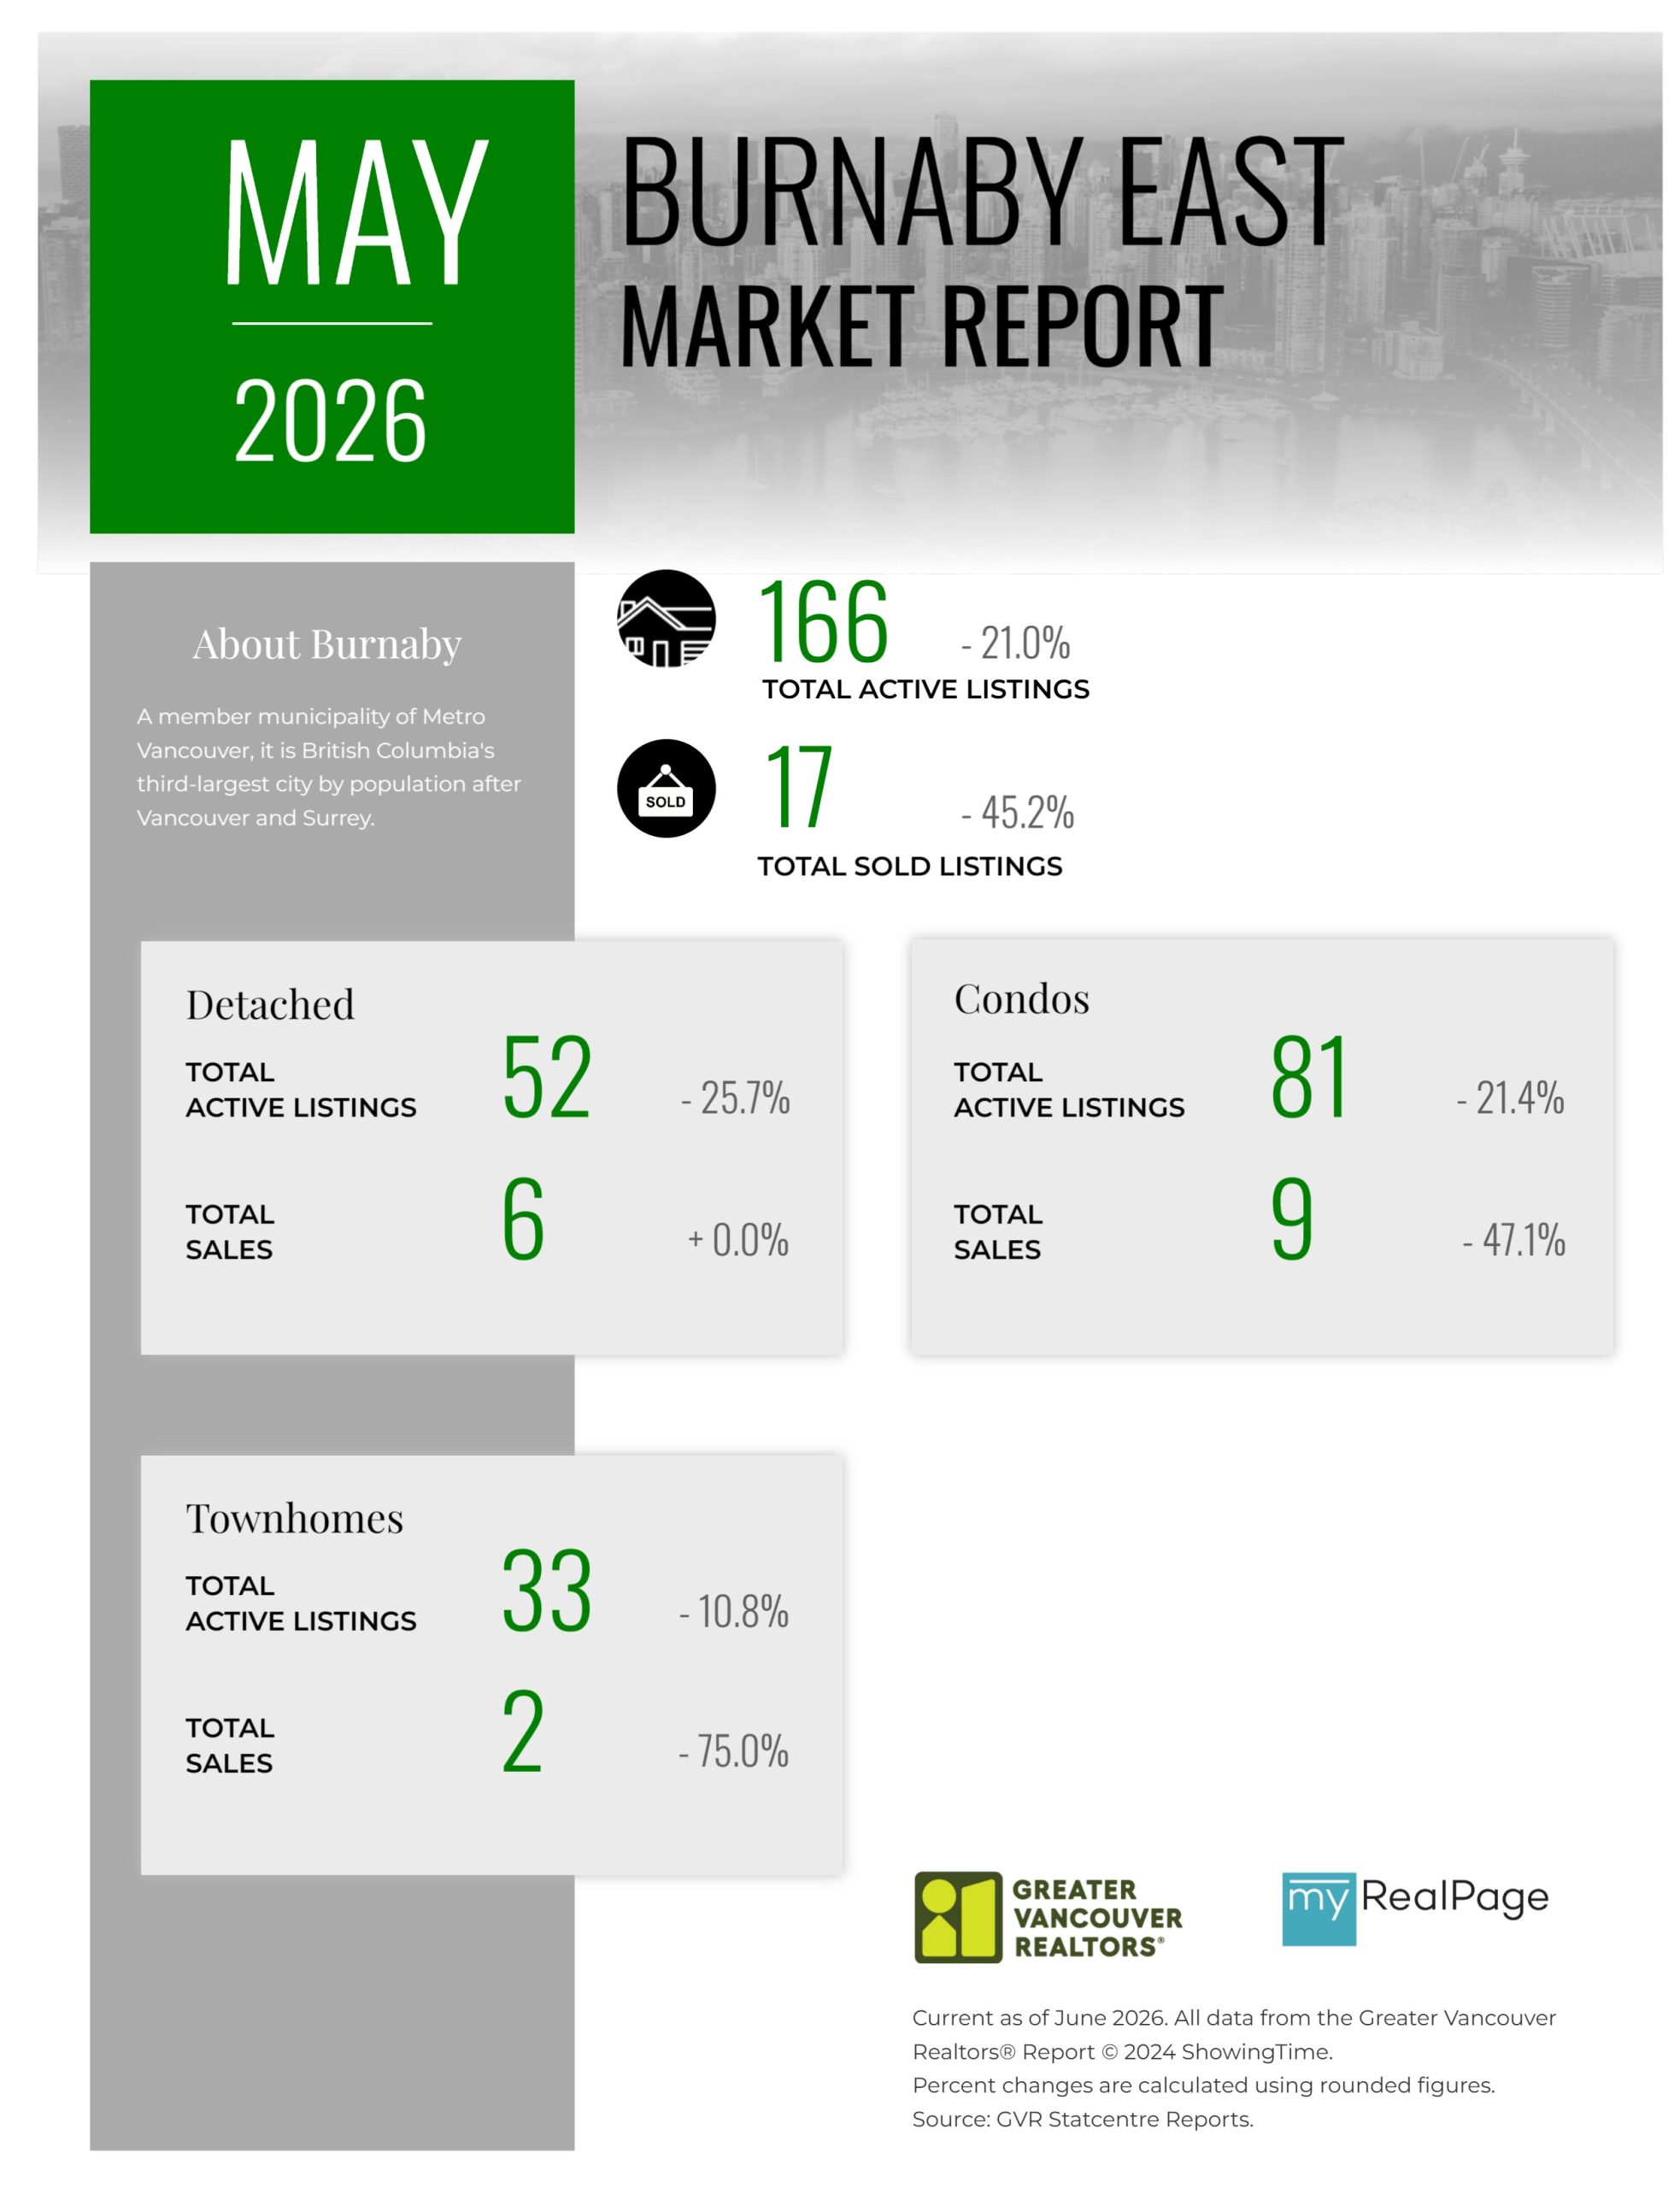
Printable Version – GVR May 2026 Data Infographics Report Burnaby East
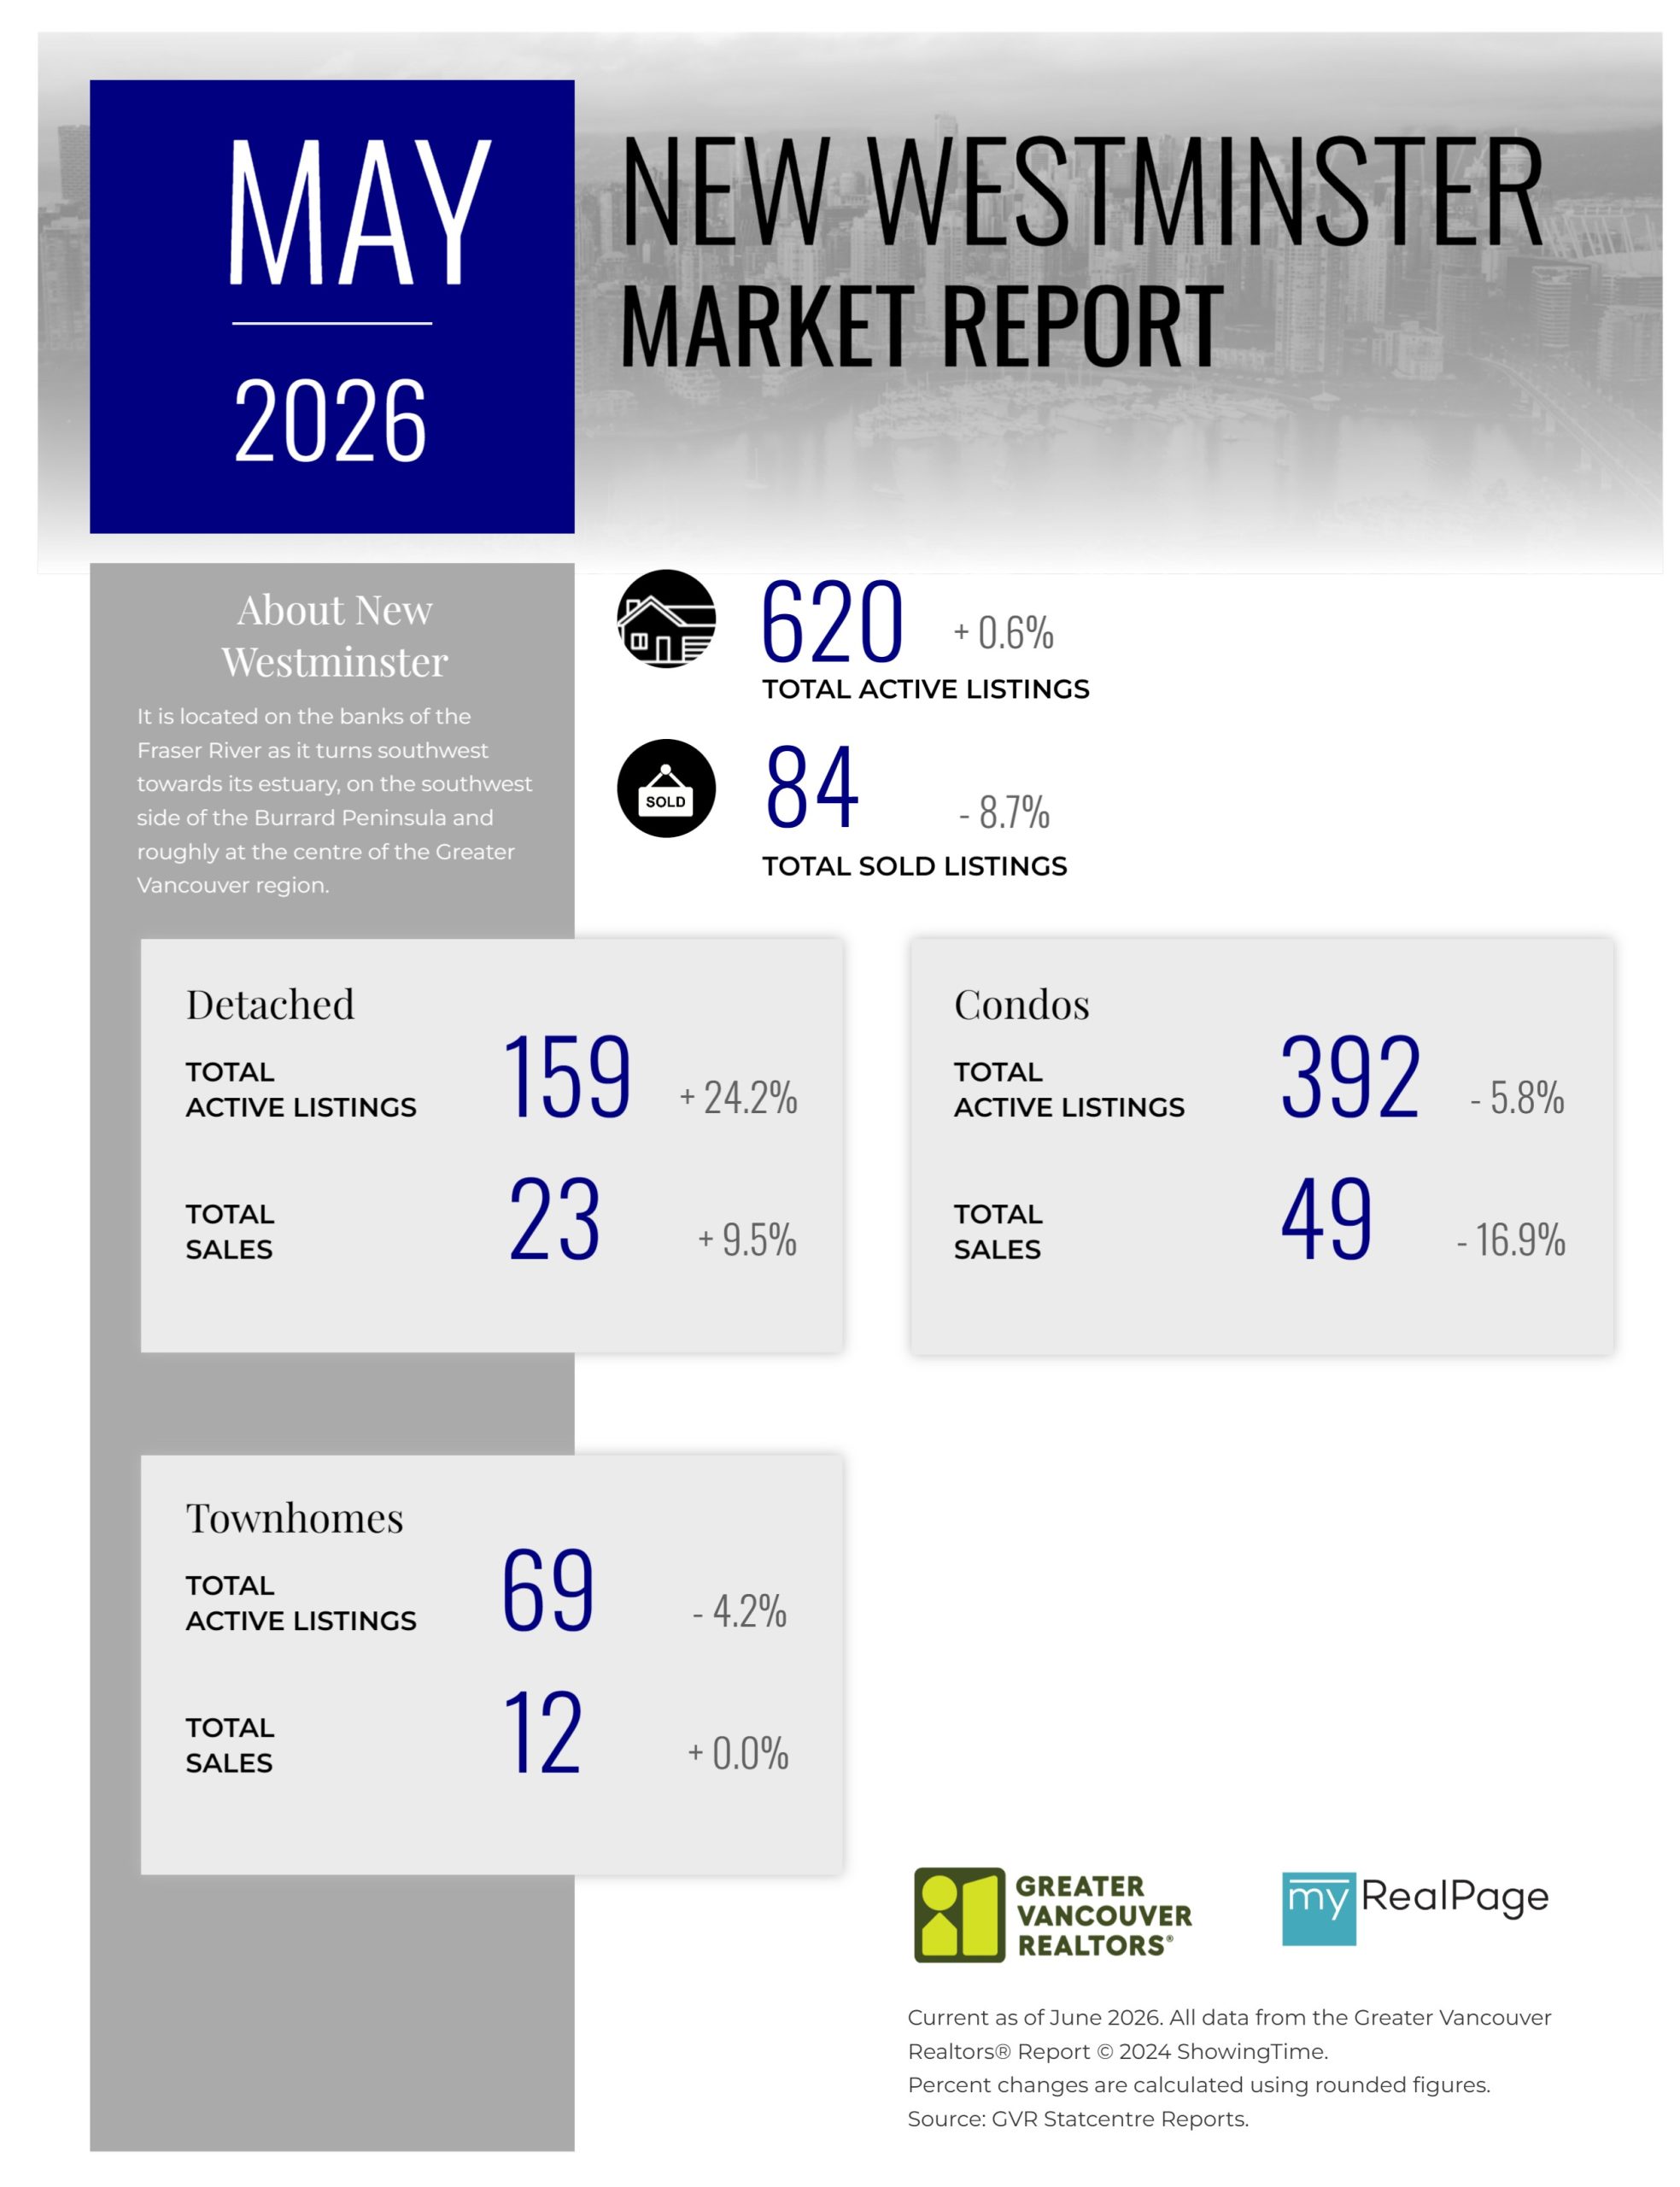
Printable Version – GVR May 2026 Data Infographics Report New Westminster
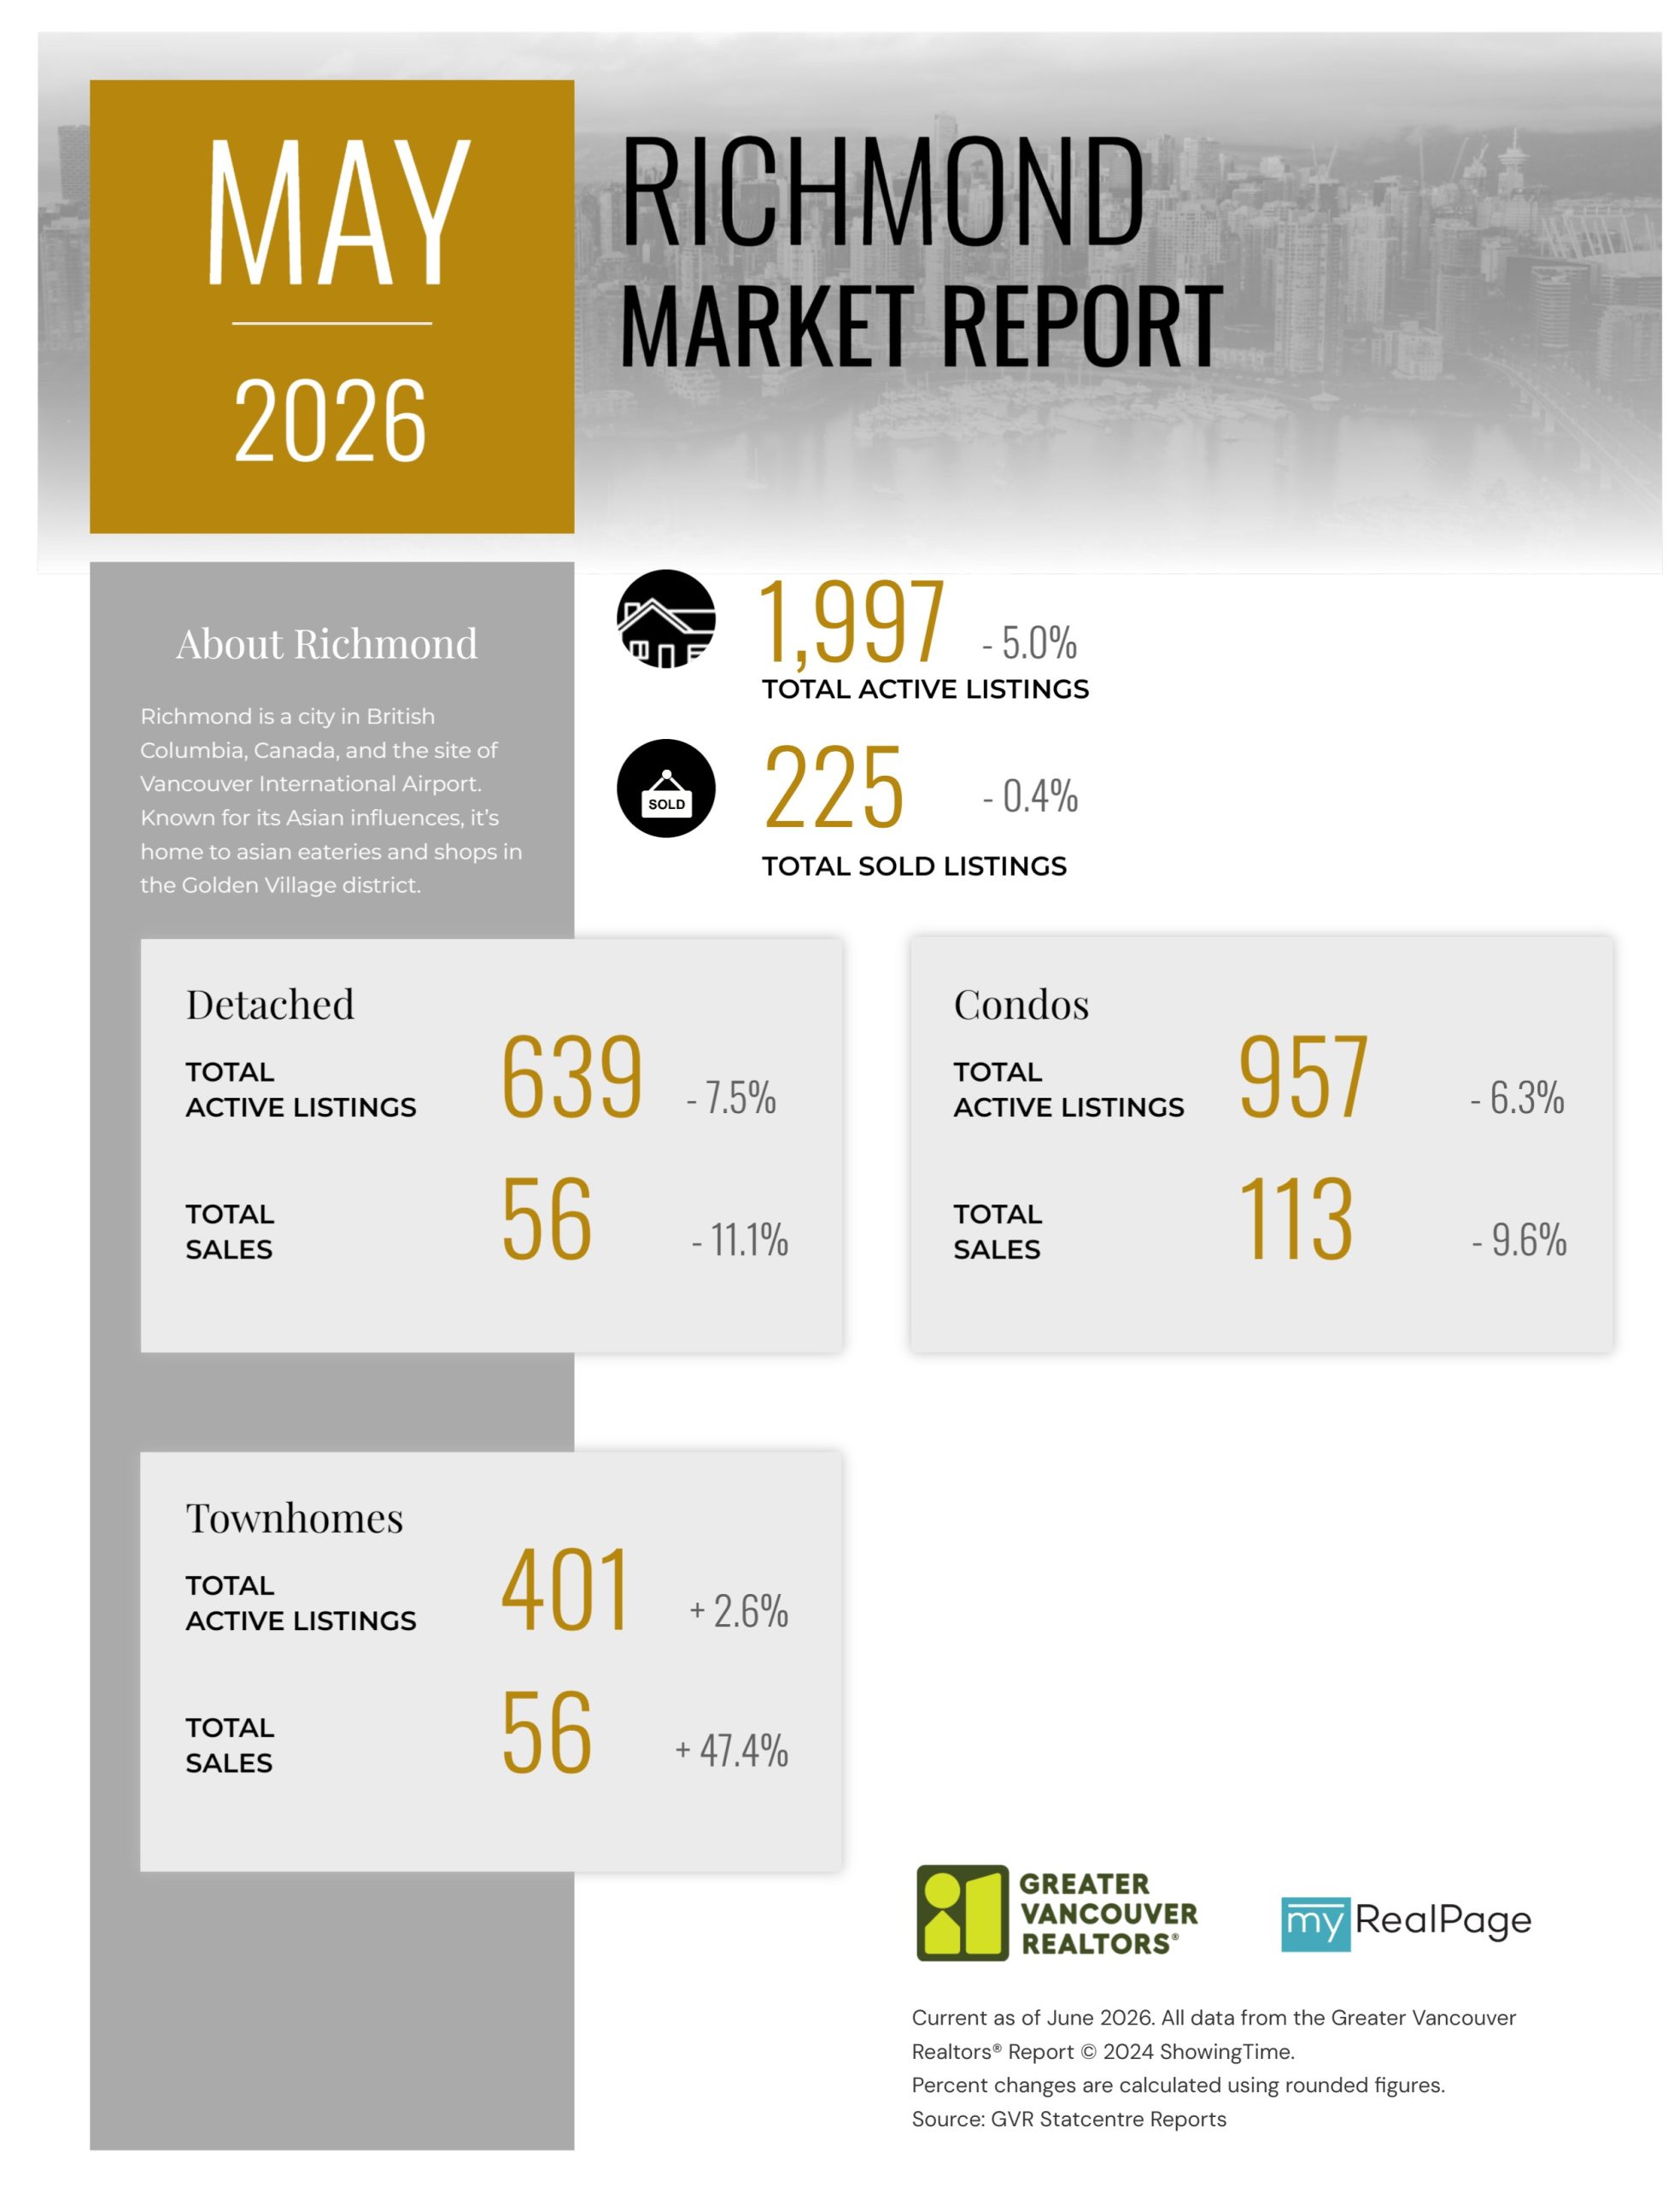
Printable Version – GVR May 2026 Data Infographics Report Richmond
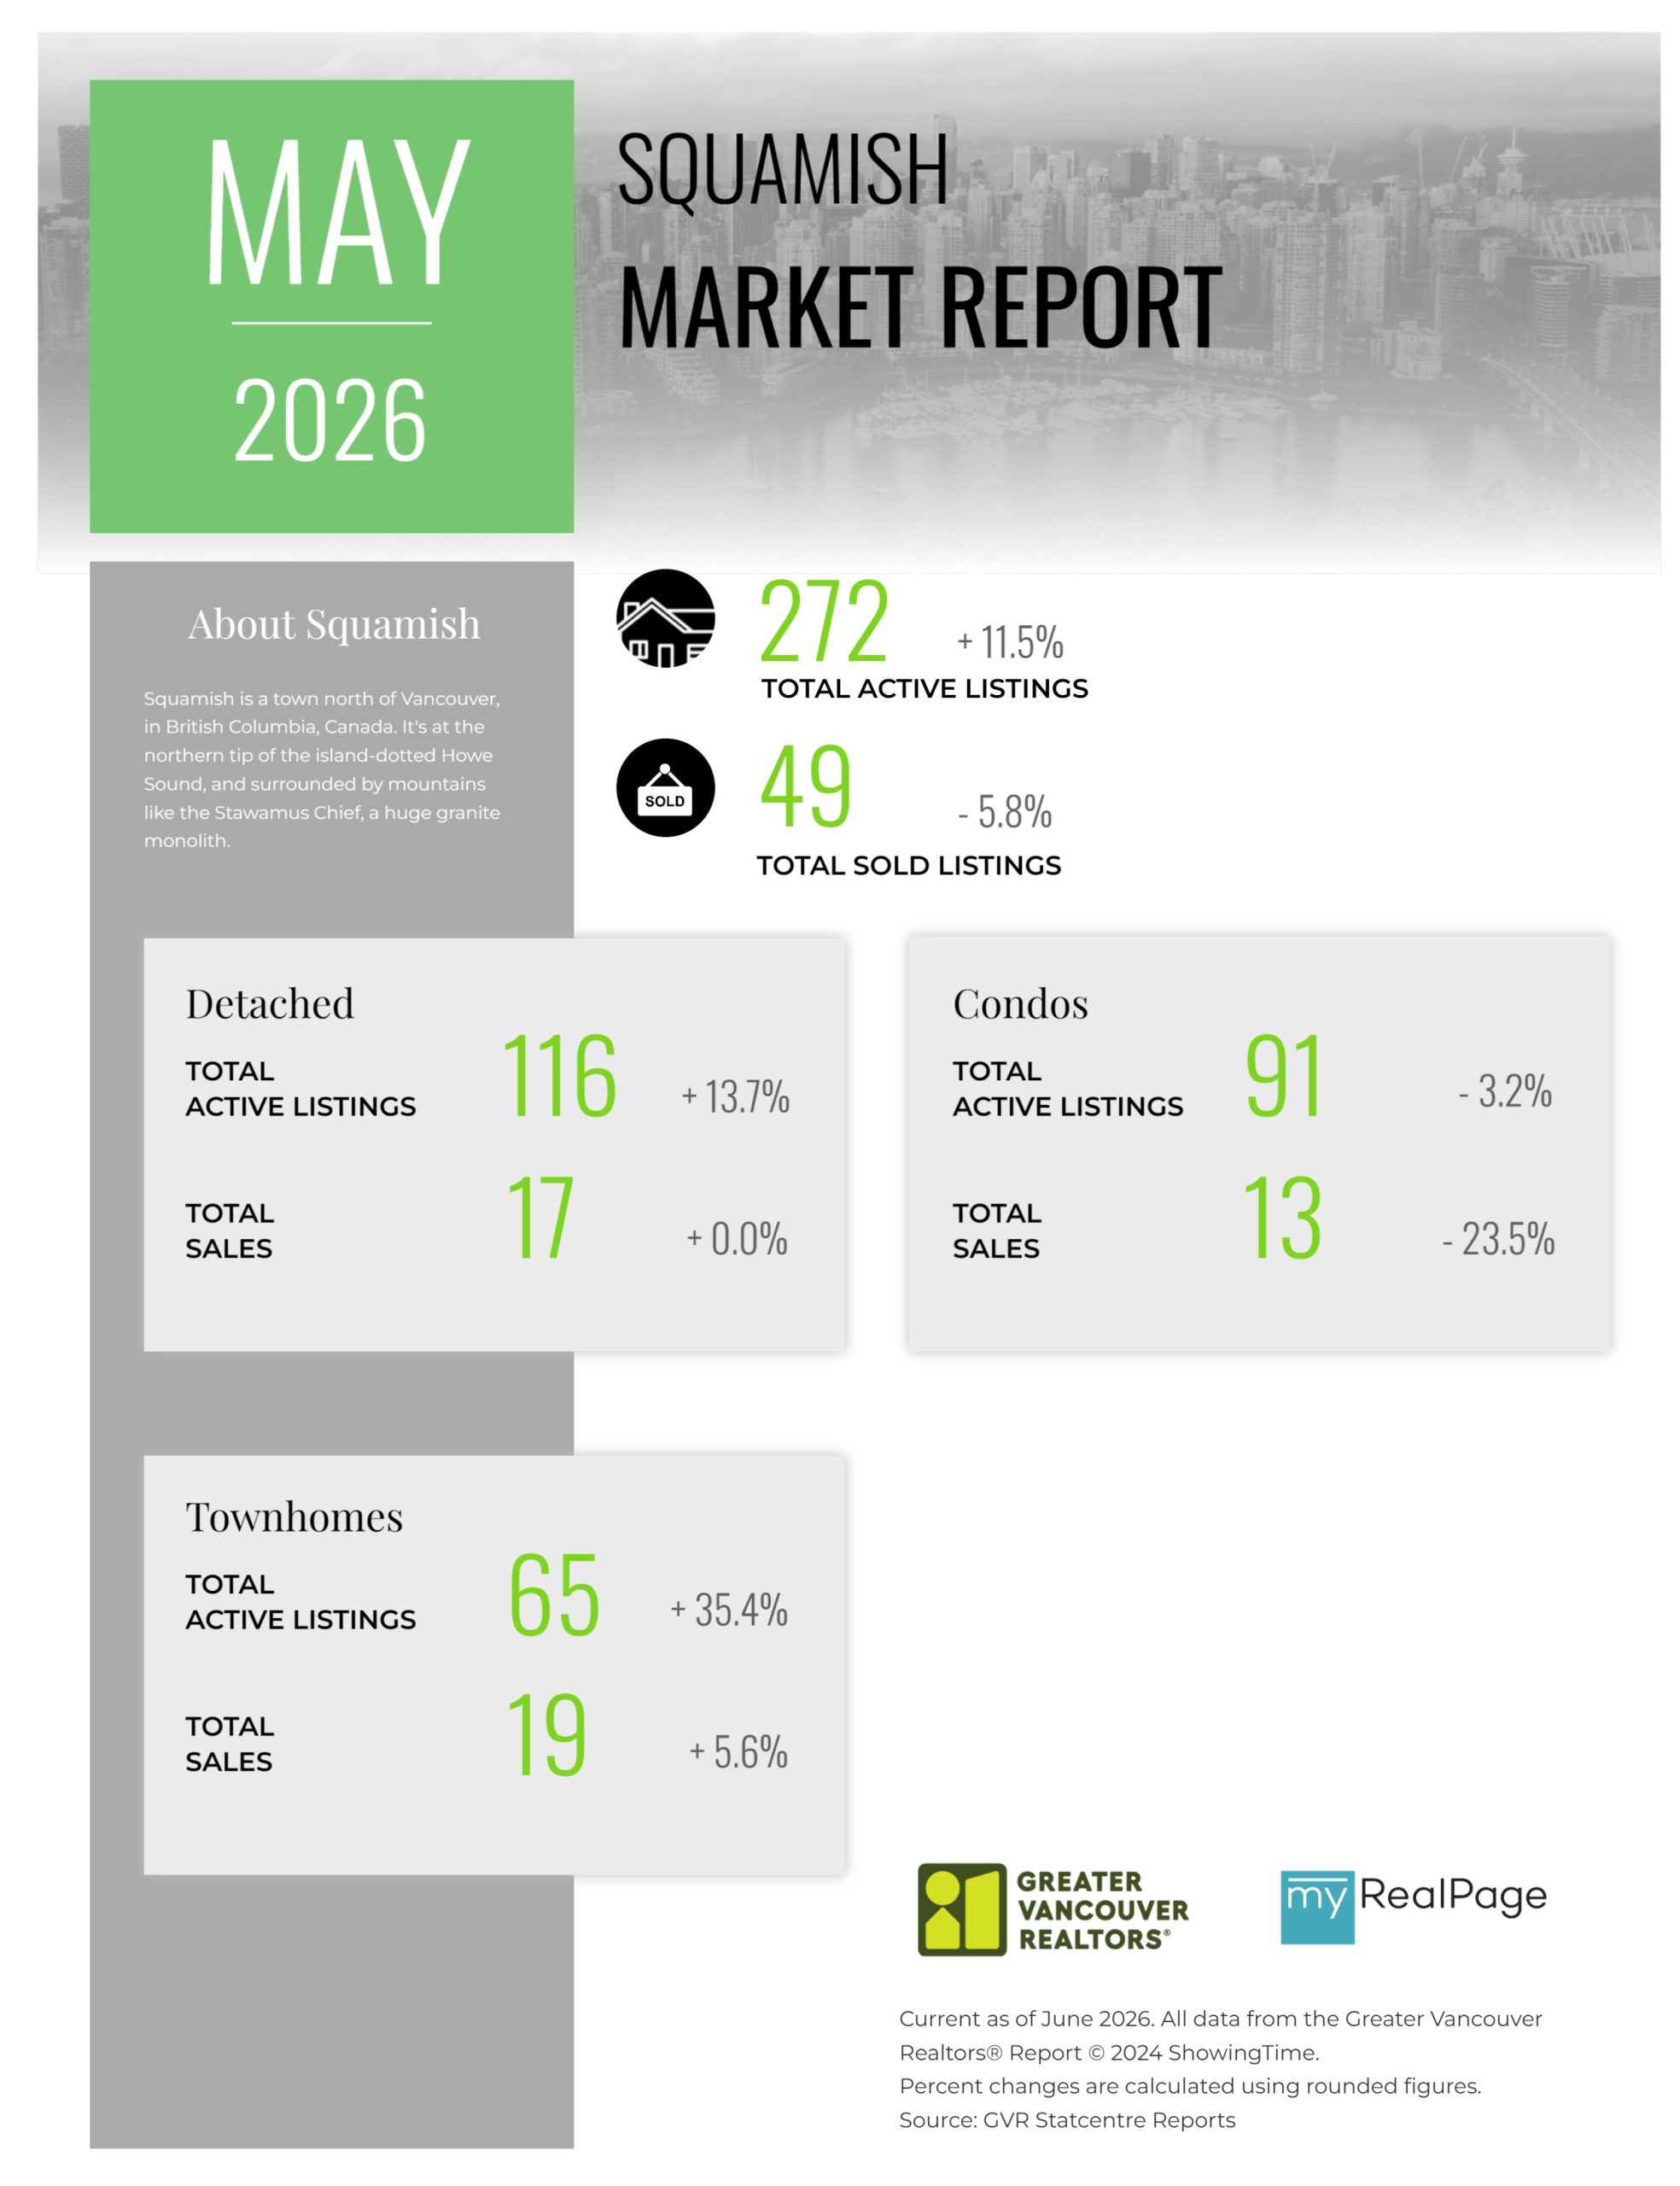
Printable Version – GVR May 2026 Data Infographics Report Squamish
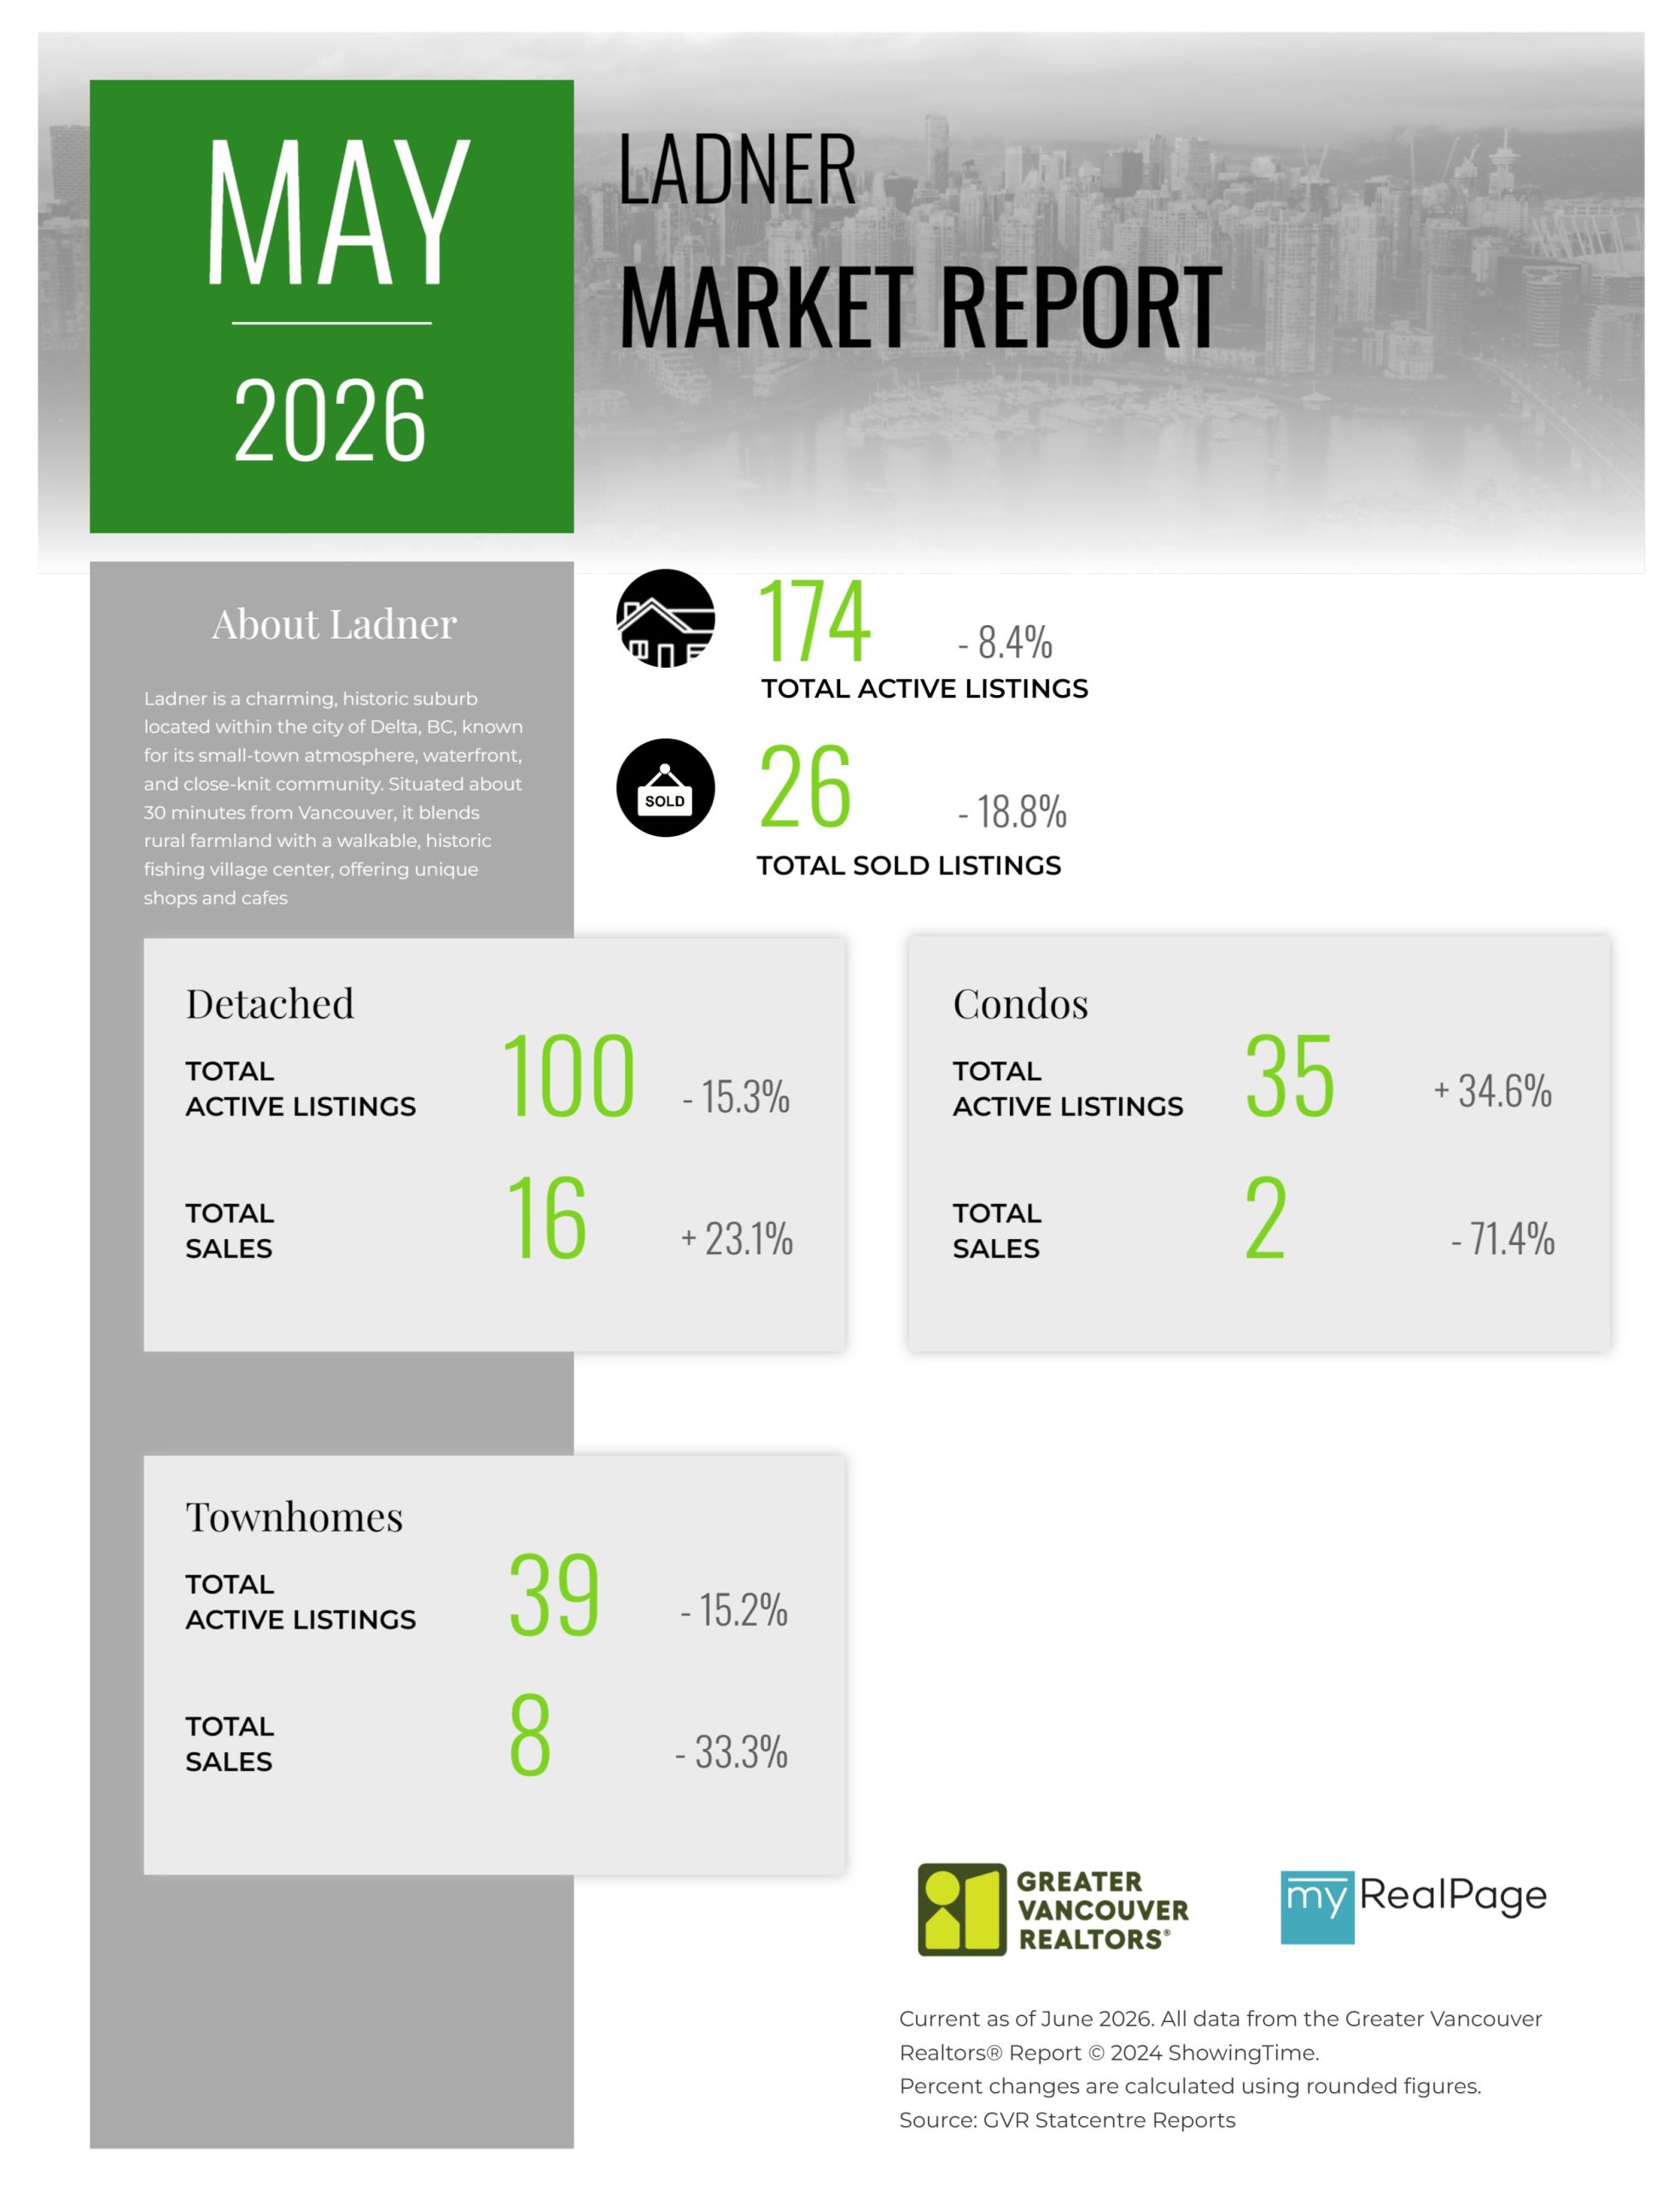
Printable Version – GVR May 2026 Data Infographics Report Ladner
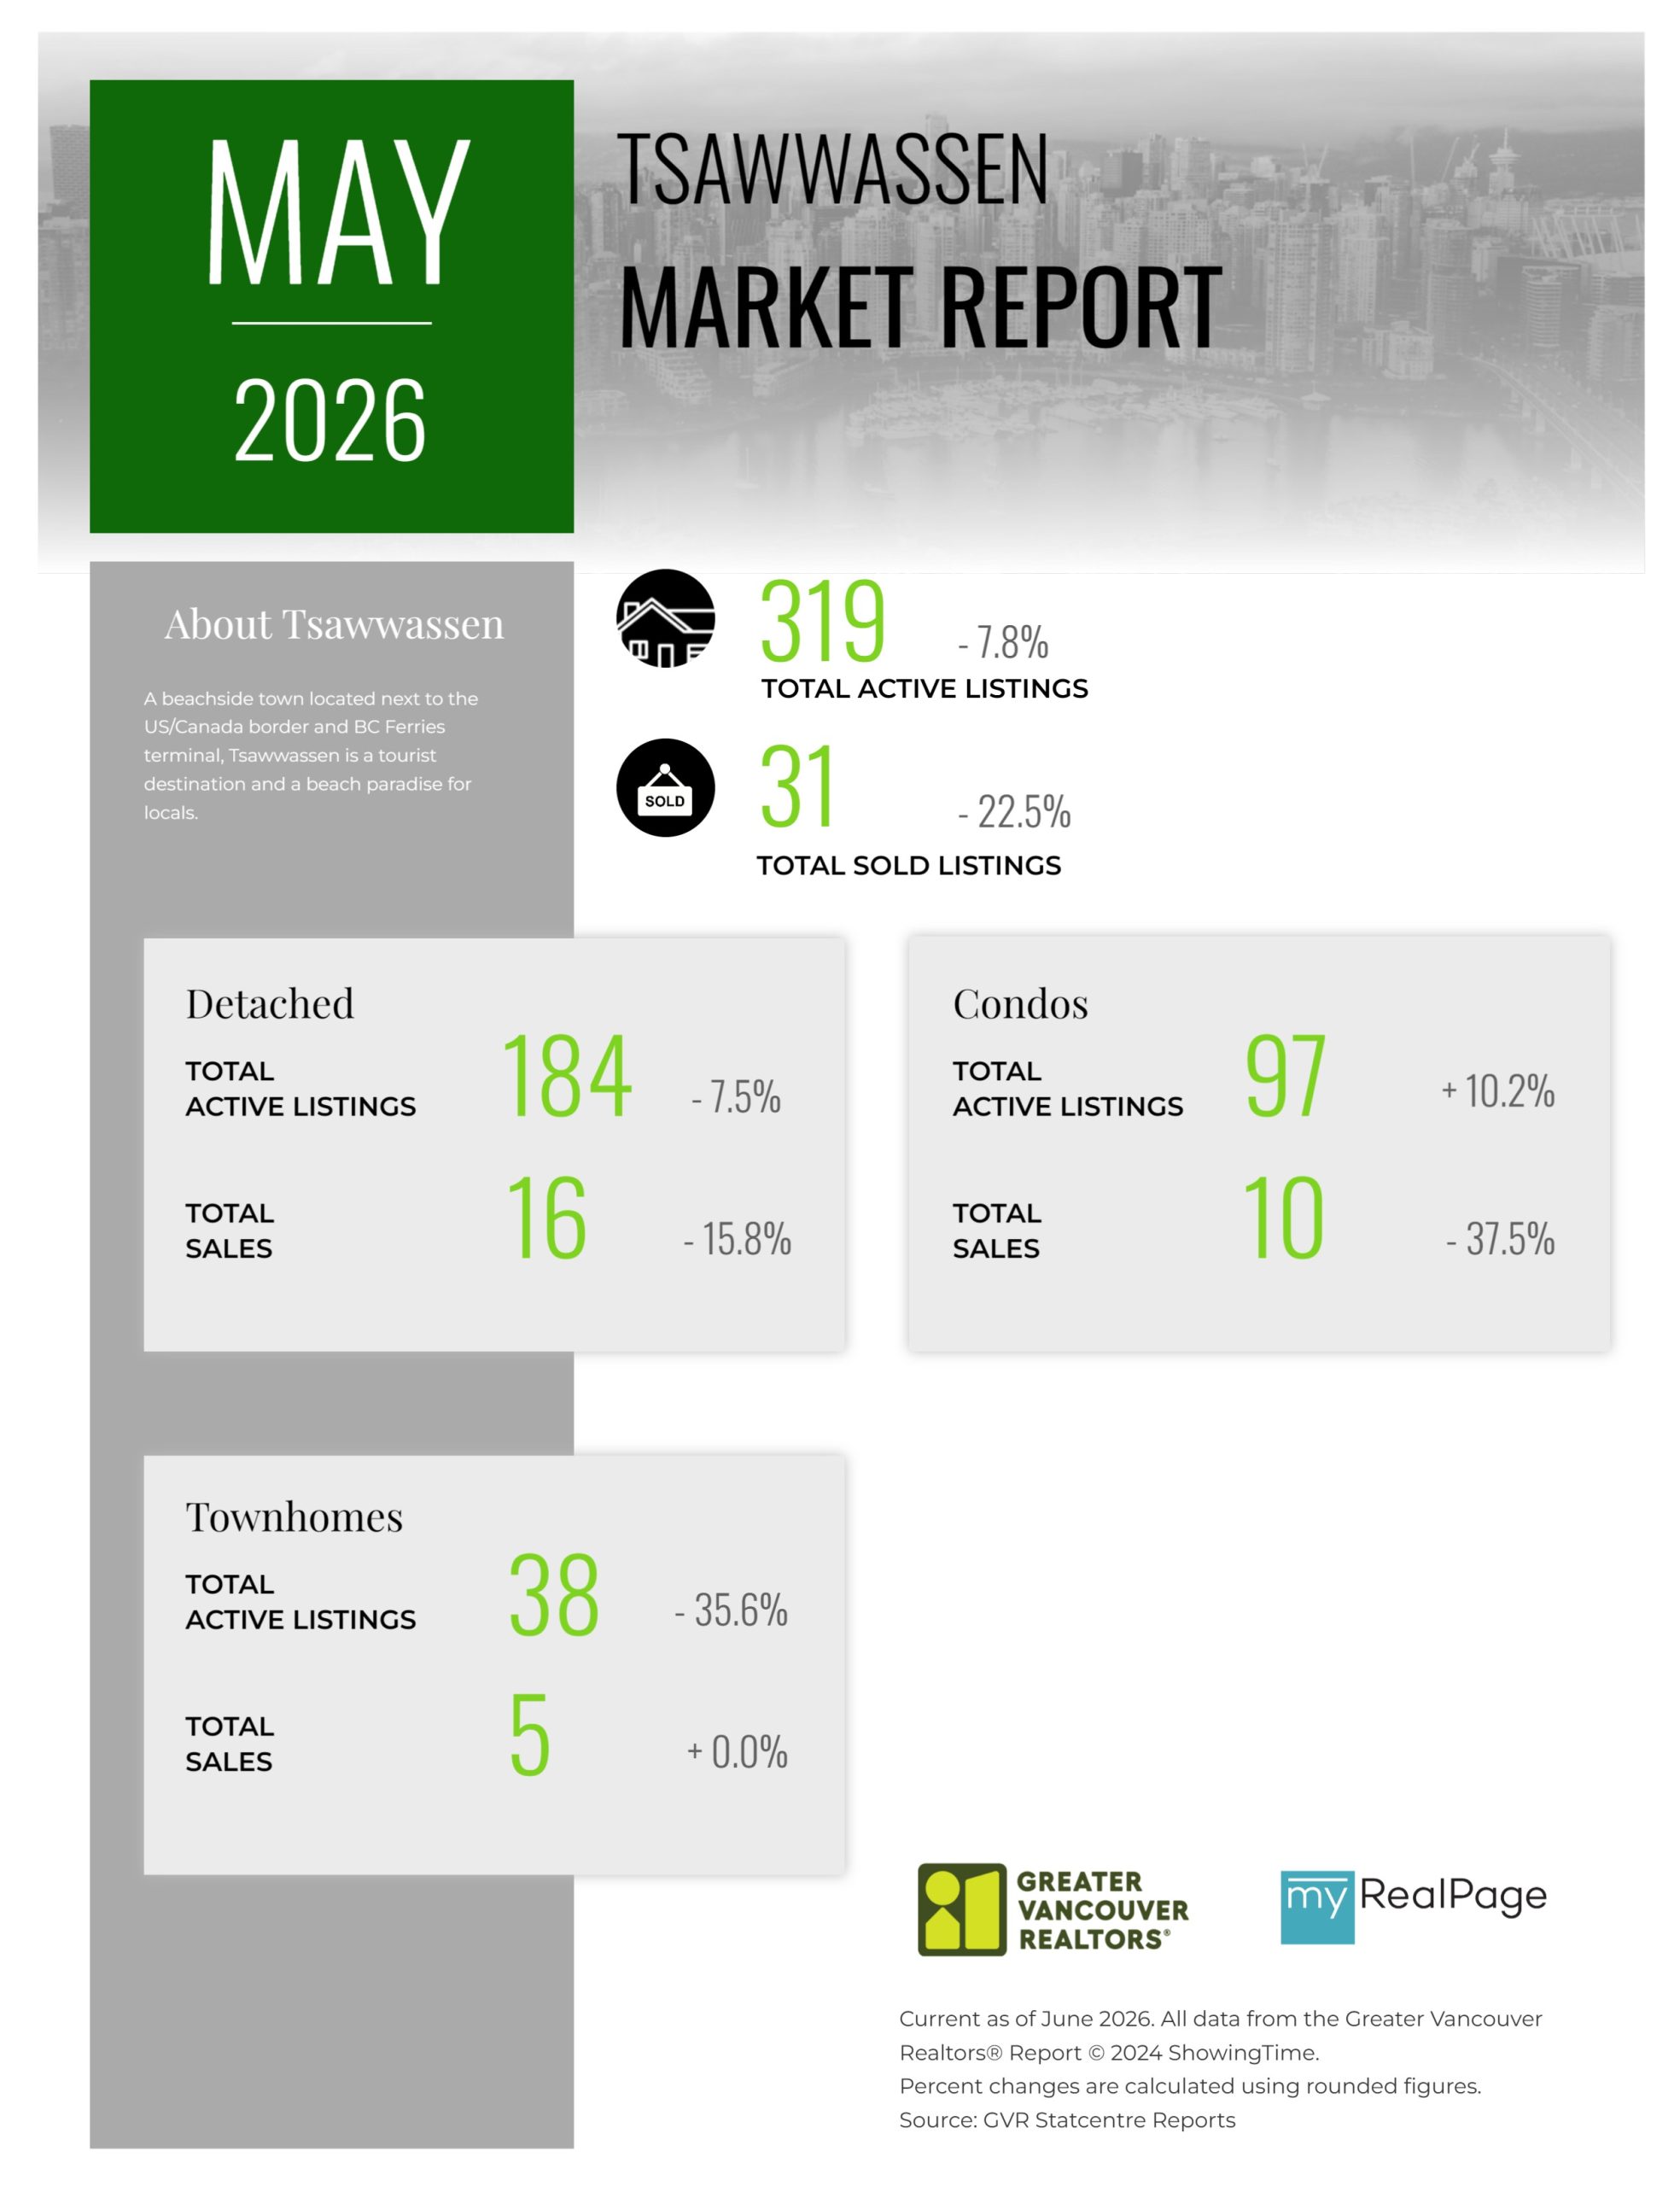
Printable Version – GVR May 2026 Data Infographics Report Tsawwassen
Last Updated on June 12, 2026 by myRealPage
