INFOGRAPHICS: April 2020 CREB City And Region Market Reports

Calgary real estate market feeling impact of the pandemic. After the first full month with social distancing measures in place, the housing market is adjusting to the effects of COVID-19.
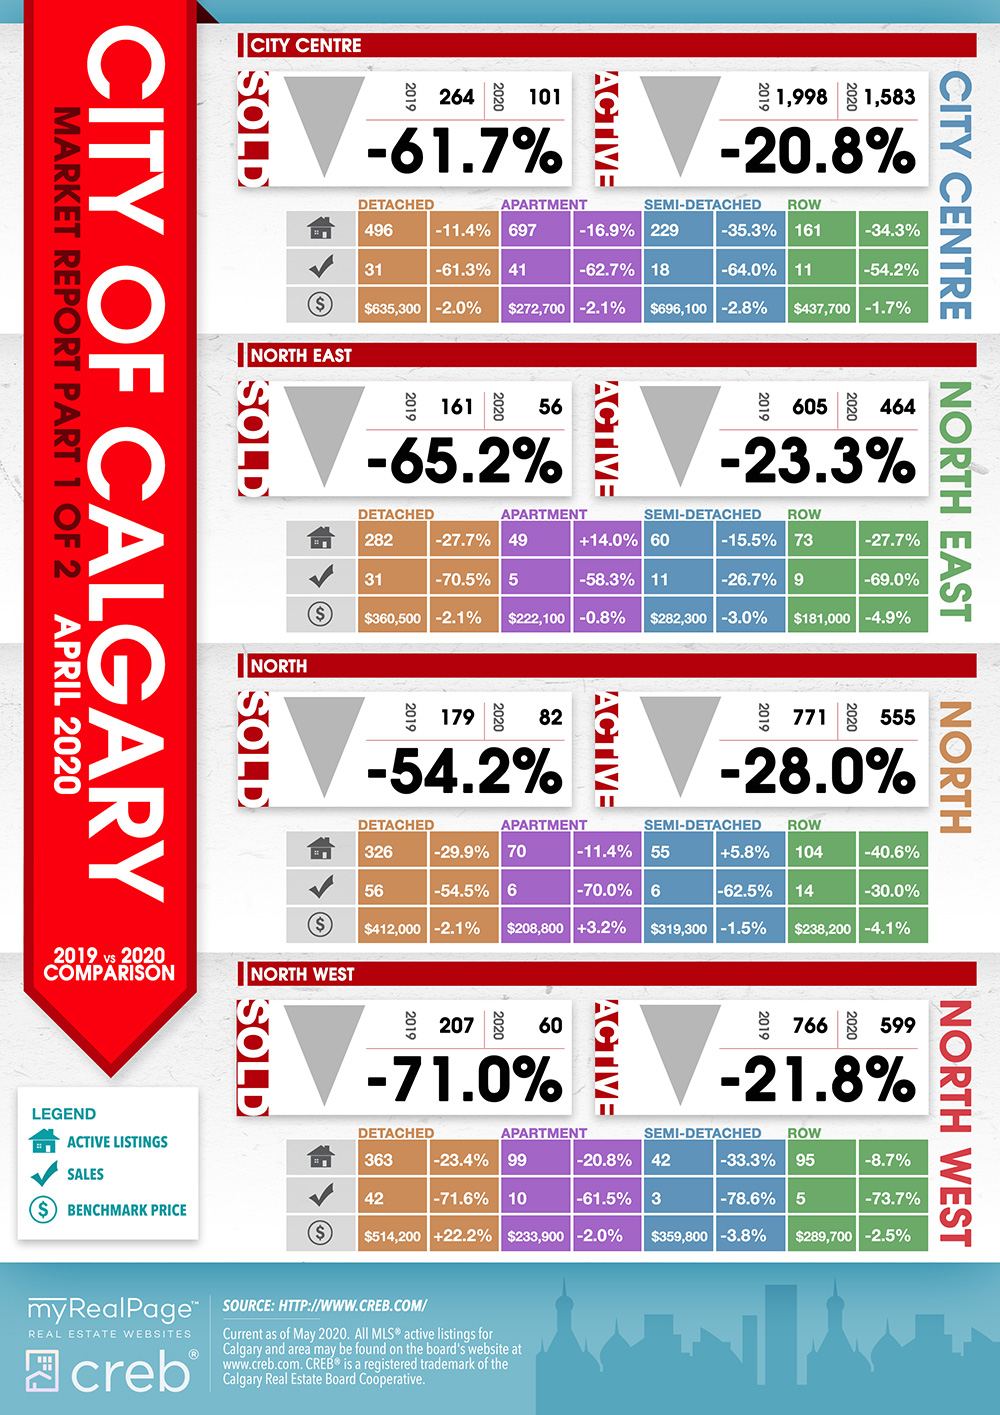
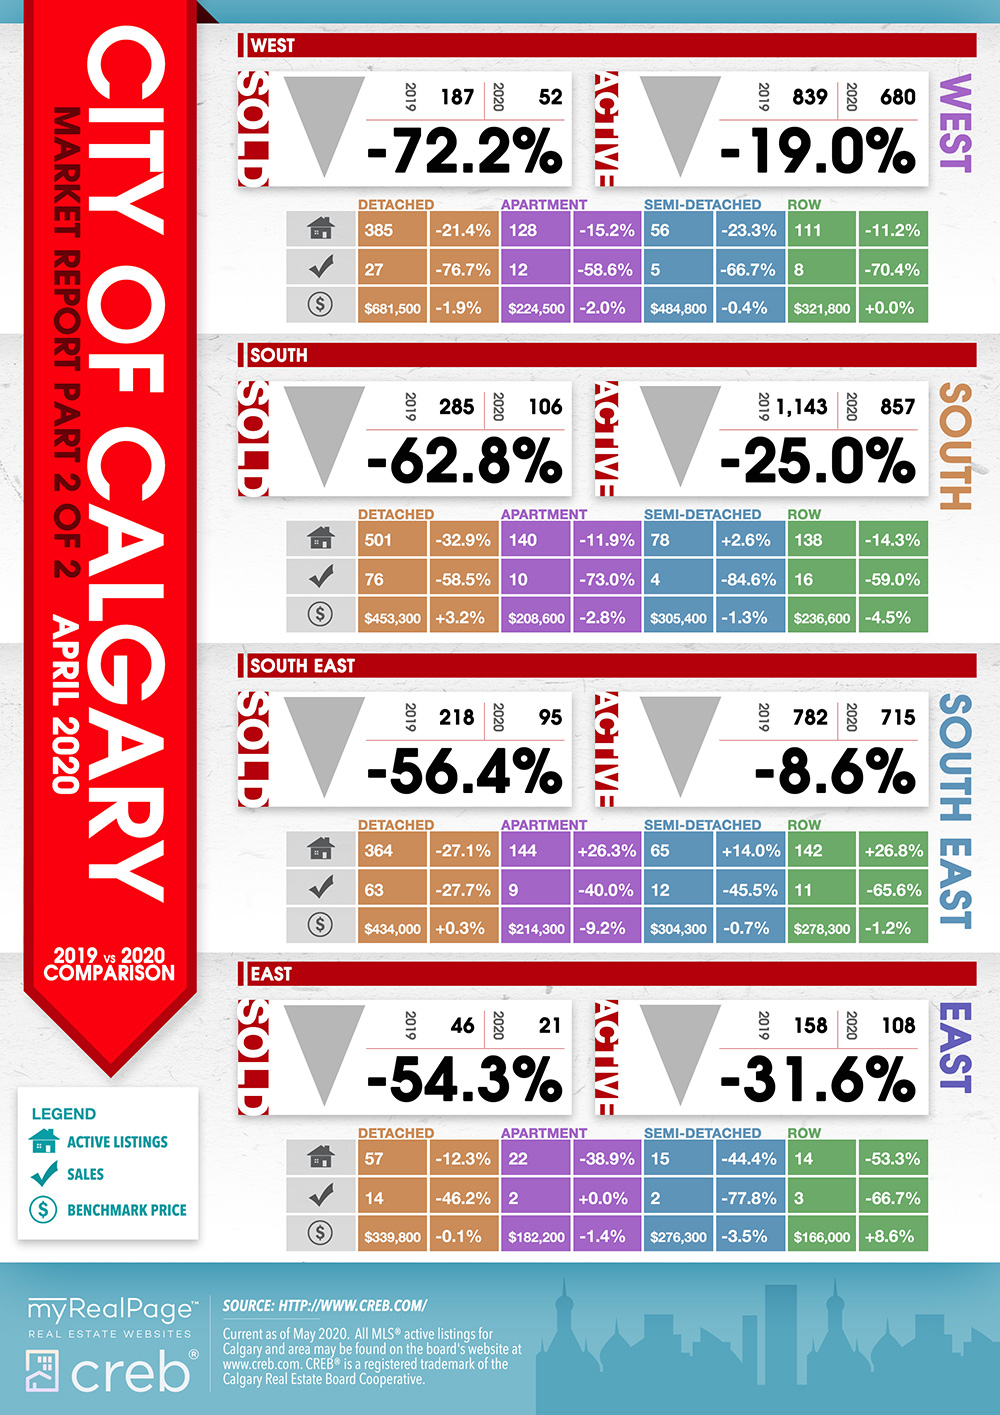
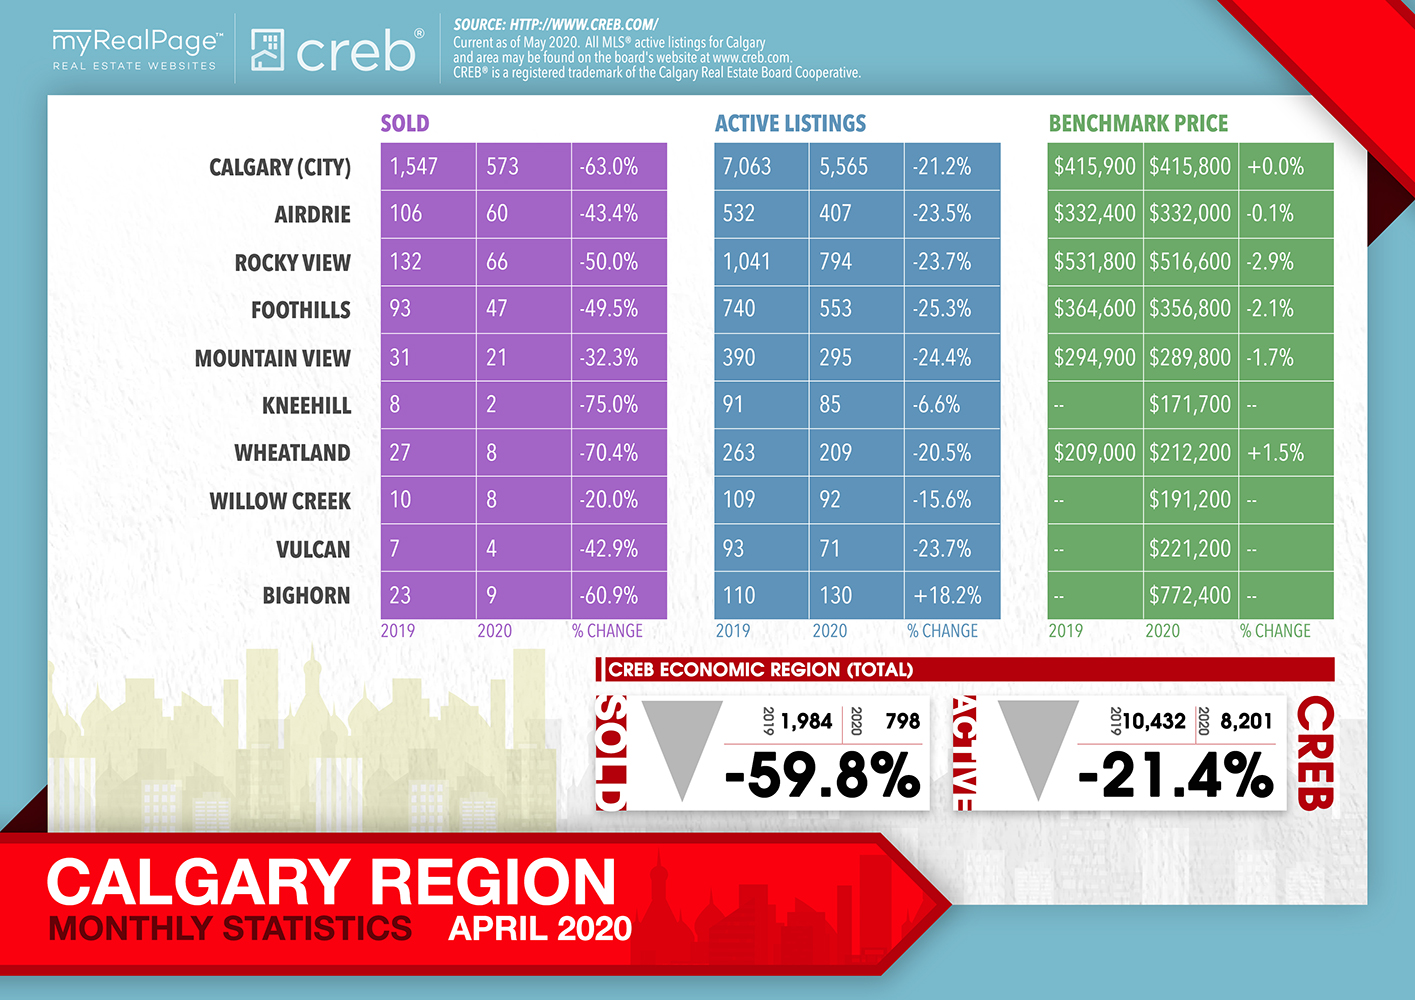
April sales hit 573 units, a decline of 63% over last year. Sales activity eased across all price ranges, but the largest declines were for homes priced above $600,000.
New listings this month totalled 1,425 units, a decline of 54% compared to last year. Inventories also declined, but with 5,565 units available, they remained high enough to push the months of supply above nine months.
Read the full report over at the CREB website.
The following data is a comparison between April 2019 and April 2020 numbers, and is current as of May 2020. For last month’s numbers, check out our previous infographic.
Or follow this link for all our CREB Infographics!
Click on the images for a larger view! (Protip: Make sure to grab the printable PDF versions, too! It fits best when printed on A4-sized sheets, AND we’ve added an area on the sheet where you can attach your business card! 🙂 )
Download Printable Version – April 2020 CREB, City of Calgary Report
Download Printable Version – April 2020 CREB, Calgary Region Report
Last Updated on July 25, 2022 by myRealPage
