INFOGRAPHICS: April 2020 FVREB Fraser Valley, South Surrey, Etc. Market Reports

Fraser Valley real estate market contracts and adapts in response to public health measures to mitigate COVID-19.
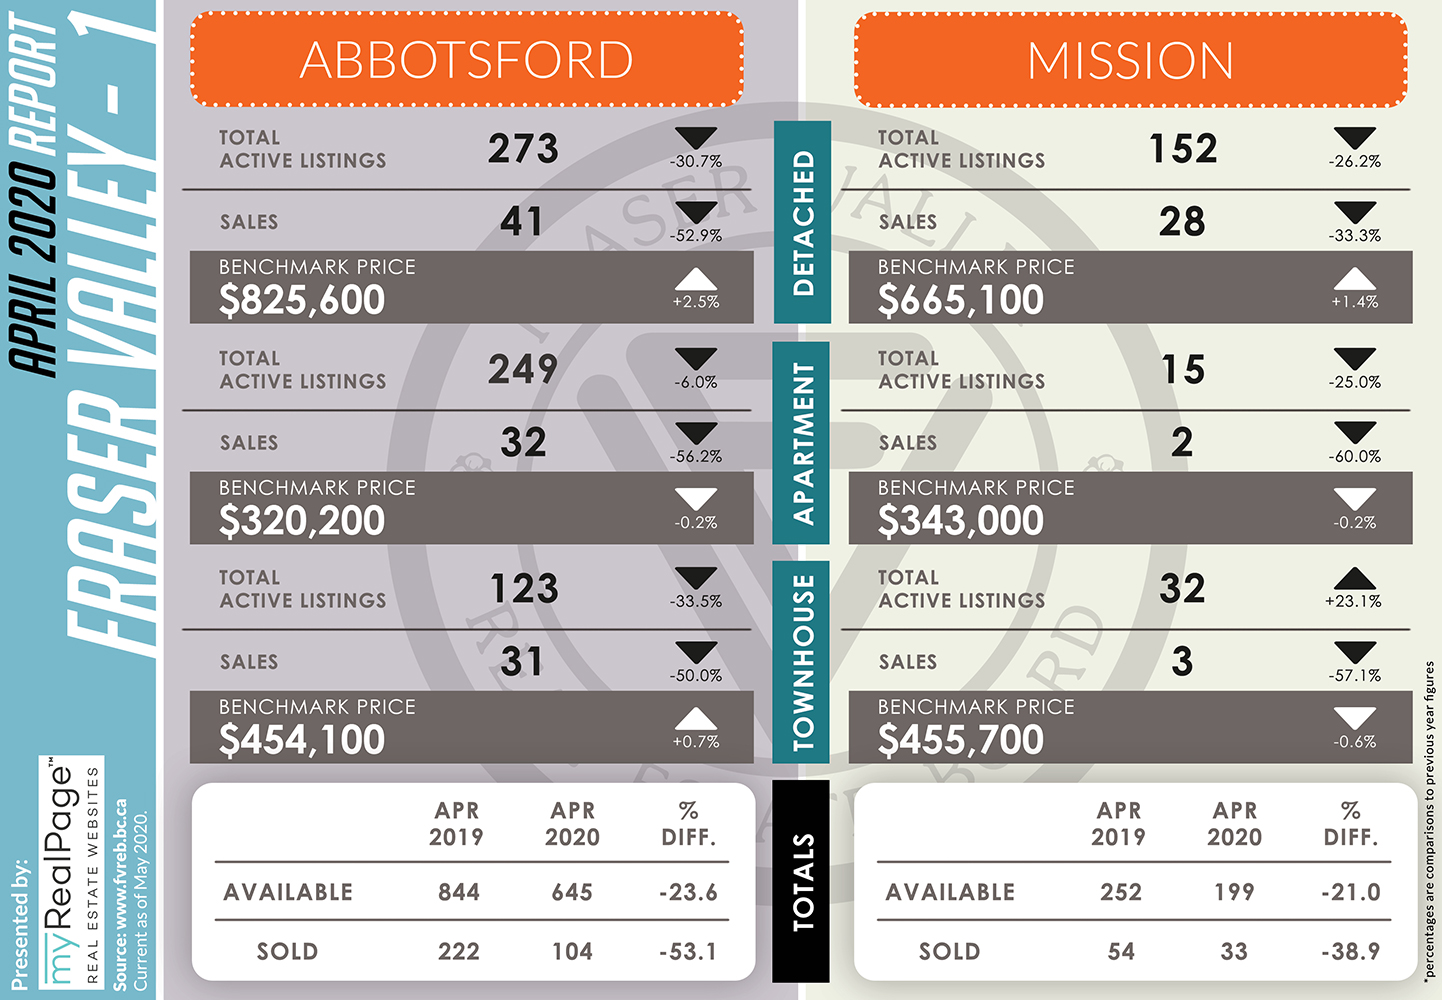
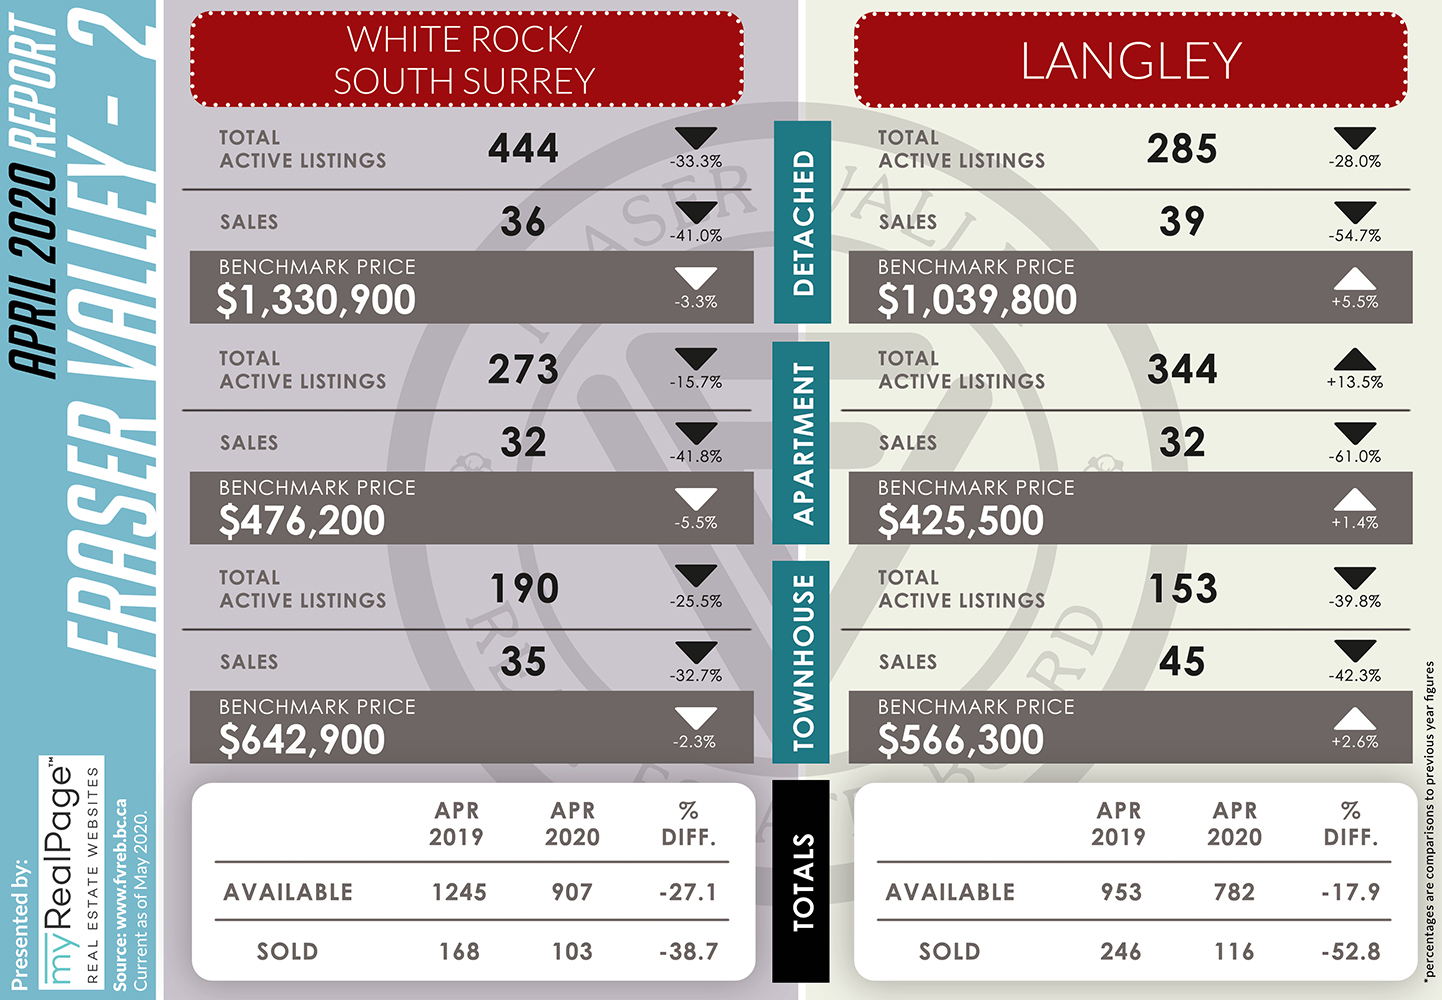
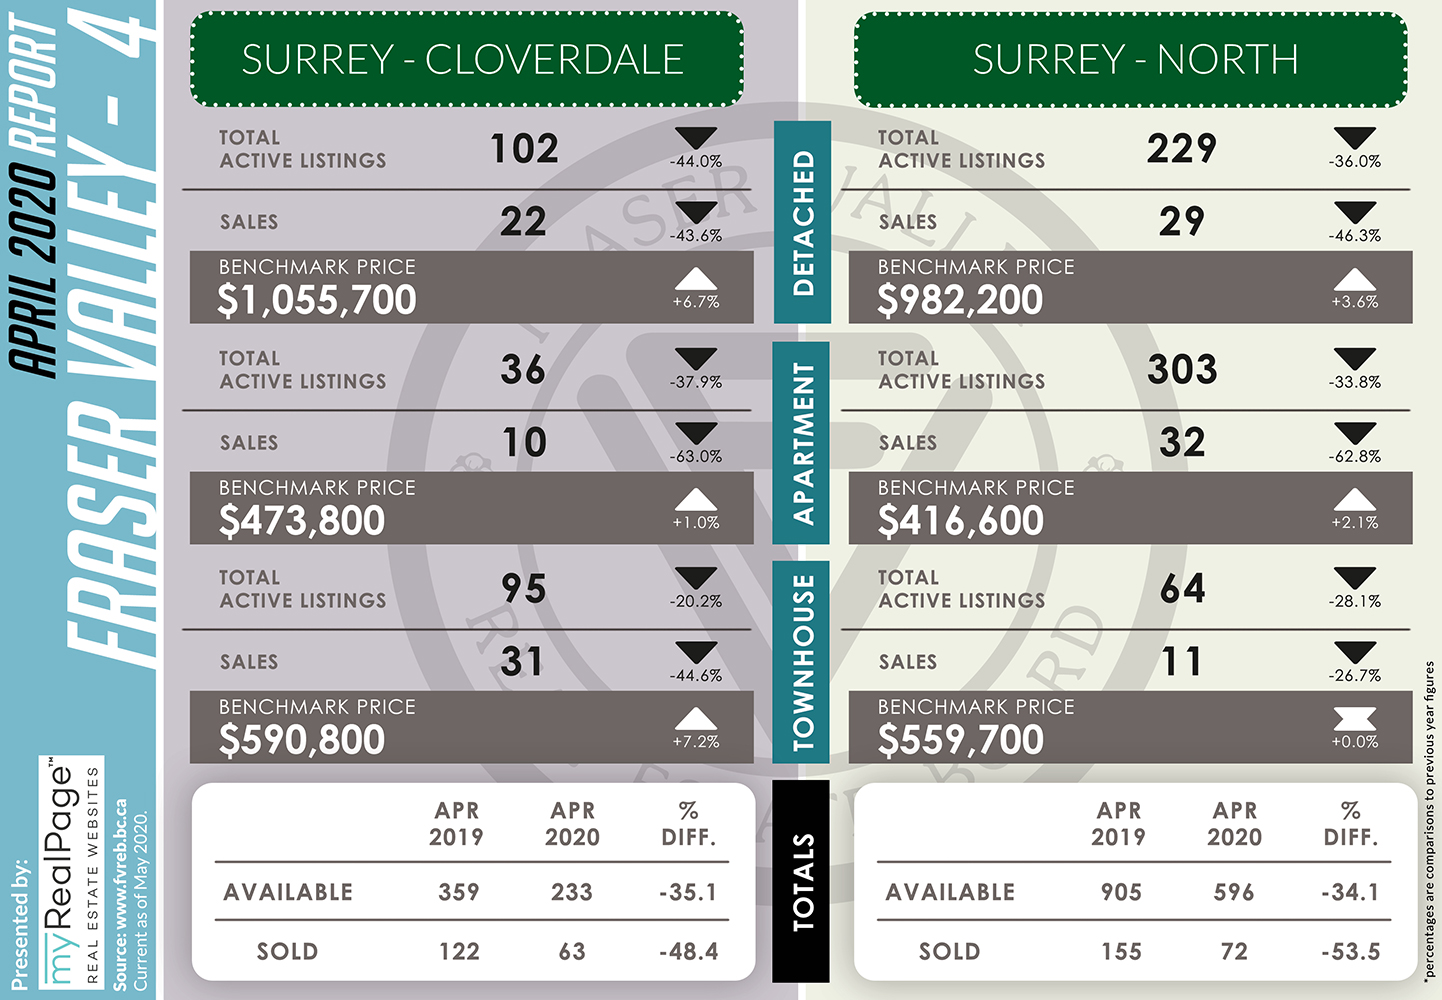
As anticipated, real estate activity saw a steep decline last month in response to the pandemic lockdown, resulting in one of the slowest Aprils in Fraser Valley history.
The Fraser Valley Real Estate Board (FVREB) processed a total of 688 sales on its Multiple Listing Service® (MLS®) in April, a decrease of 52% compared to sales in March and a decrease of 50% compared to April of last year. According to FVREB historical data, last month’s sales were on par with April sales in 1983 through to 1985; and new listings are in line with numbers last seen in April 1981.
Read the full report on the FVREB website.
The following data is a comparison between April 2019 and April 2020 numbers, and is current as of May 2020. For last month’s report, check out our previous infographic!
Or follow this link for all our FVREB Infographics!
These infographics cover current trends in Fraser Valley neighbourhoods that are within the FVREB. Click on the images for a larger view! (Protip: Make sure to grab the printable PDF version, too! It fits best when printed on A4-sized sheets, AND we’ve added an area on the sheet where you can attach your business card! 🙂 )
Download Printable Version – FVREB April 2020 Market Report

Last Updated on July 25, 2022 by myRealPage
