INFOGRAPHICS: April 2020 VREB Victoria Market Reports

Victoria VREB Spring market far from the usual as real estate continues to react to the COVID-19 pandemic.
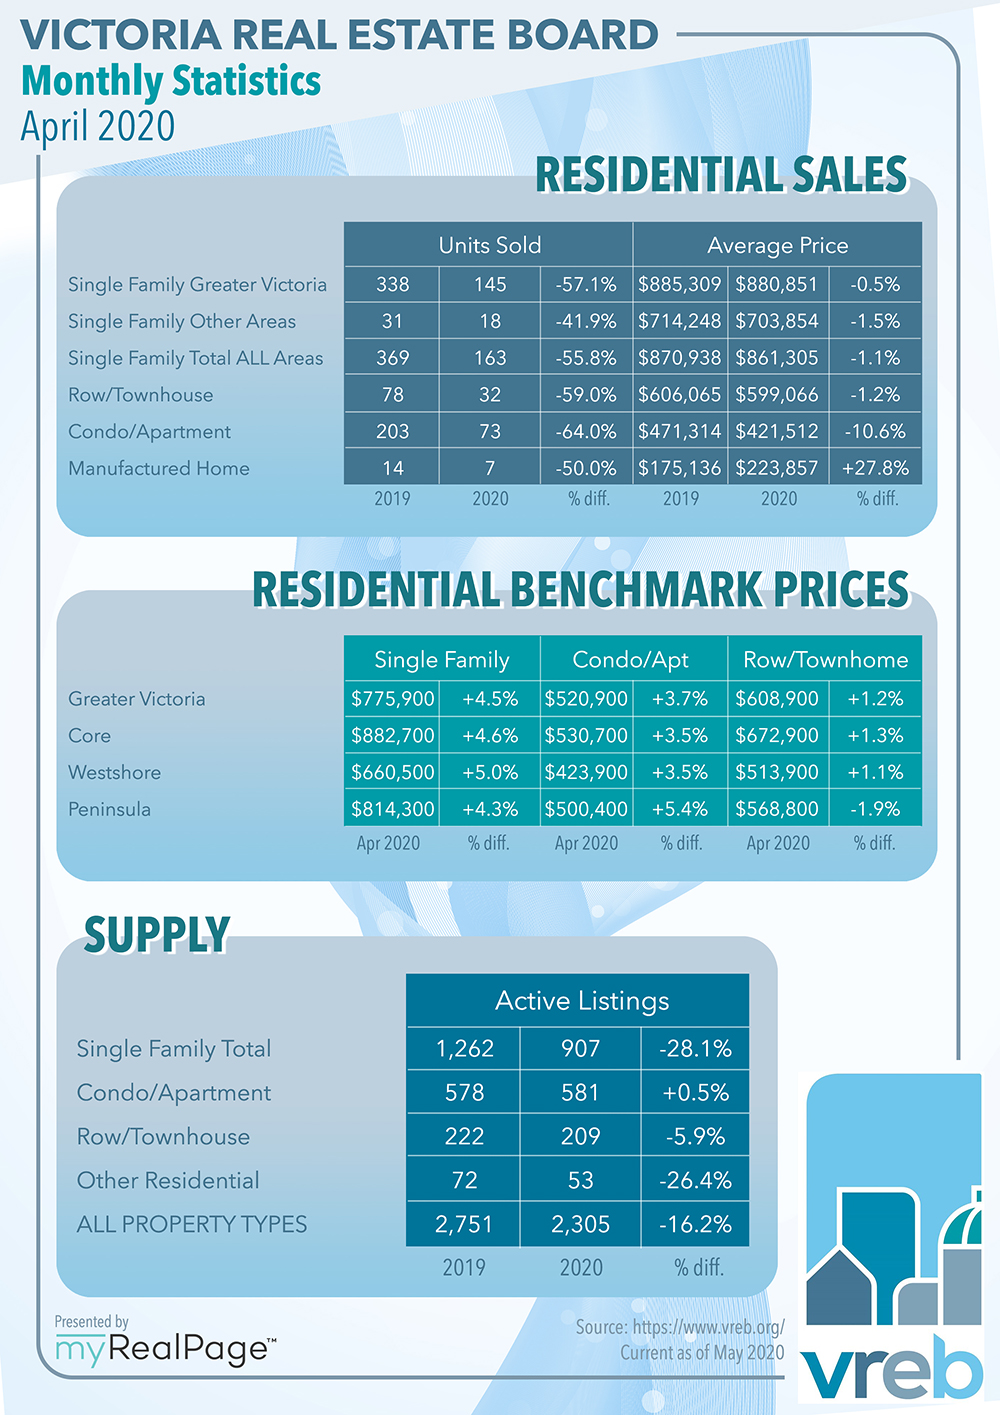
A total of 287 properties sold in the Victoria Real Estate Board region this April, 58.8% fewer than the 696 properties sold in April 2019 and 52.8% fewer than the previous month of March 2020. Sales of condominiums were down 64% from April 2019 with 73 units sold. Sales of single family homes were down 55.8% from April 2019 with 163 sold.
There were 2,305 active listings for sale on the VREB Multiple Listing Service® at the end of April 2020, 16.2% fewer properties than the total available at the end of April 2019 but a 2.4% increase from the 2,252 active listings for sale at the end of March 2020.
Read the full report over on the Victoria Board website.
The following data is a comparison between April 2019 and April 2020 numbers, and is current as of May 2020. Click here to check out last month’s figures! You can also follow this link for all our Victoria Board monthly infographics!
Click on the images for a larger view! (Protip: Make sure to grab the printable PDF versions, too! It fits best when printed on A4-sized sheets, AND we’ve added an area on the sheet where you can attach your business card! 🙂 )
Download Printable Version – April 2020 VREB, Victoria Market Report
Last Updated on July 25, 2022 by myRealPage
