INFOGRAPHICS: April 2021 VIREB Vancouver Island Market Reports

Little Relief for Frustrated Buyers in April
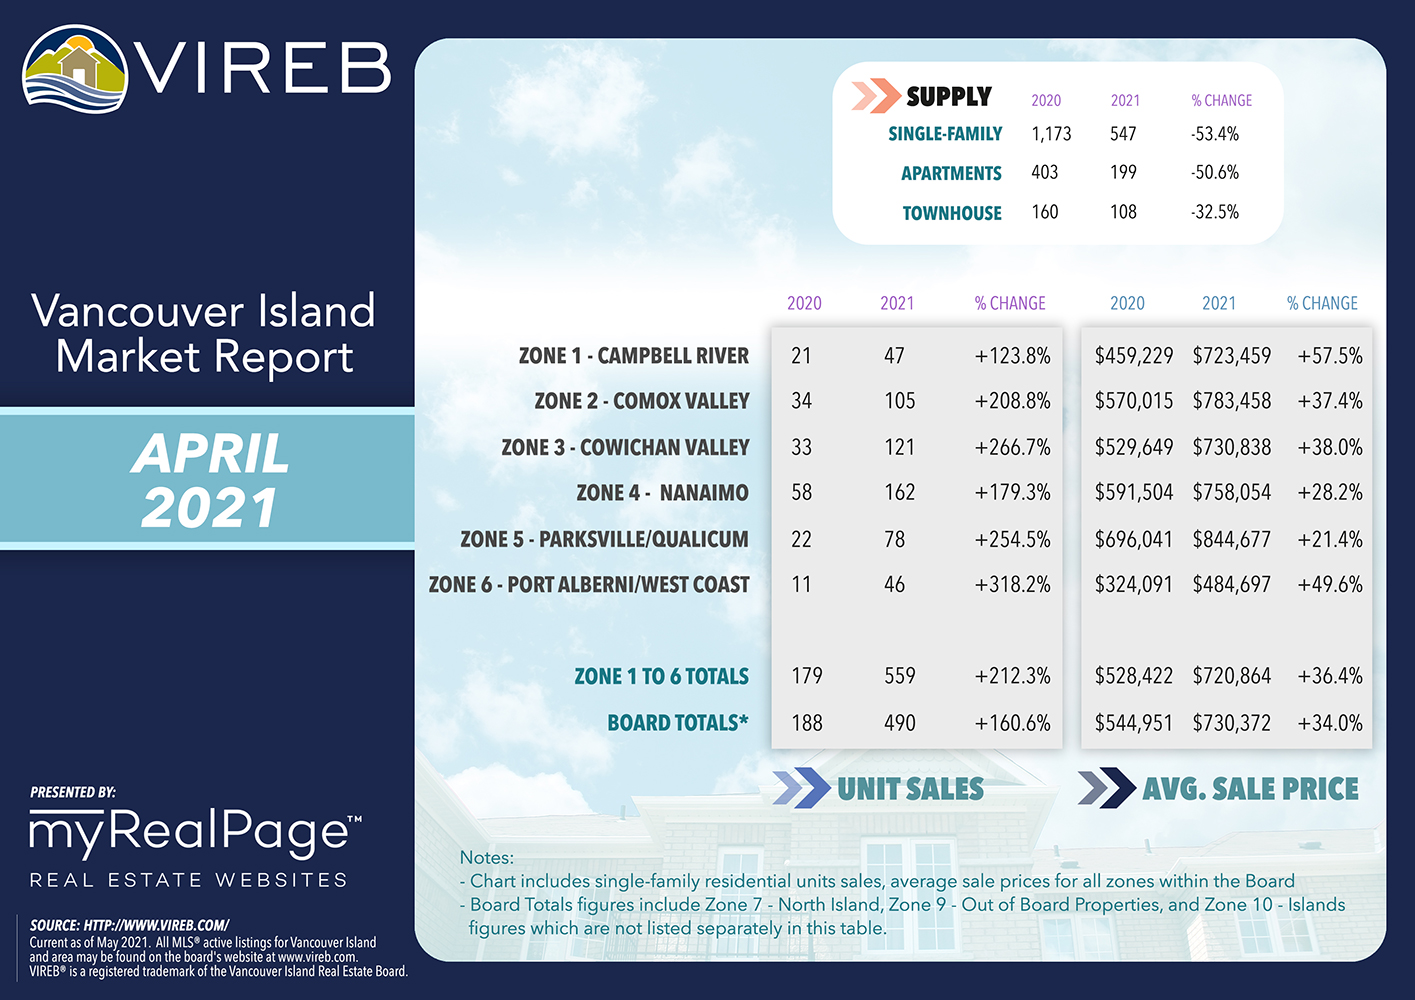
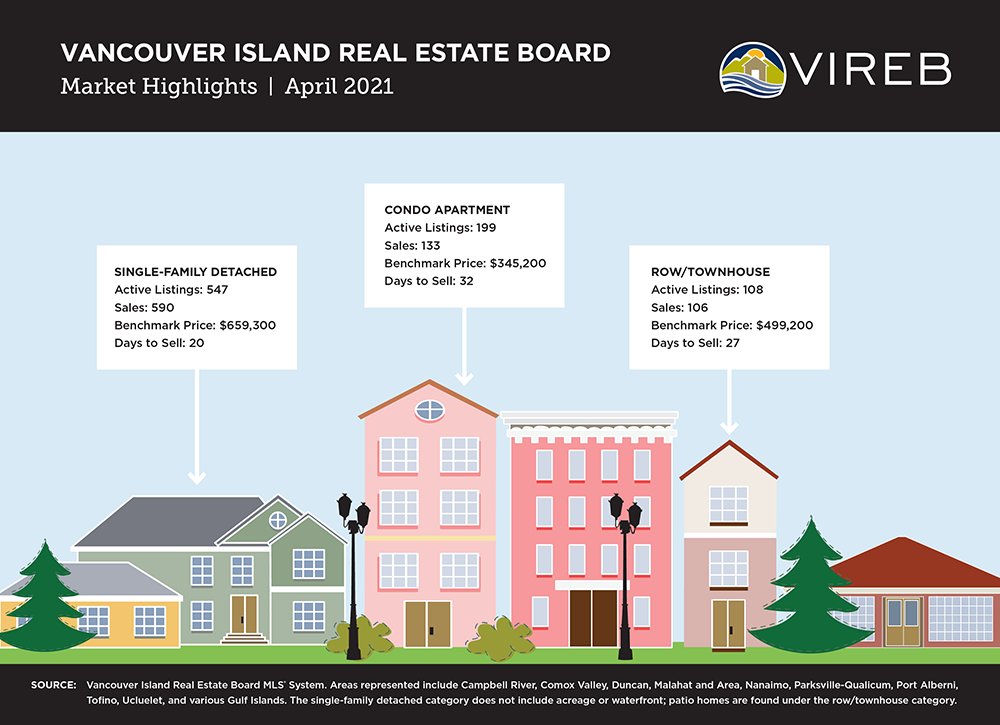
There was little relief for frustrated buyers in April despite an increase in active listings. Inventory of single-family homes and condo apartments rose by 8% and 16%, respectively, but active listings of townhouses dropped by 8%.
April saw sales of 590 single-family detached properties compared to 567 the previous month. In the condo apartment category, 133 units sold last month versus 136 in March 2021. As for townhouses, 106 units changed hands in April compared to 124 the previous month.
Read the full report on the VIREB website!
The following data is a comparison between April 2020 and April 2021 numbers, and is current as of May 2021. Click here to check out last month’s infographics.
You can also view all our VIREB infographics by clicking here.
Click on the images for a larger view! (Protip: Make sure to grab the printable PDF versions, too! It fits best when printed on A4-sized sheets, AND we’ve added an area on the sheet where you can attach your business card! 🙂 )
Download Printable Version – April 2021 VIREB Market Report
Last Updated on July 25, 2022 by myRealPage
