INFOGRAPHICS: April 2022 TRREB Toronto Market Reports

GTA REALTORS® RELEASE APRIL STATS
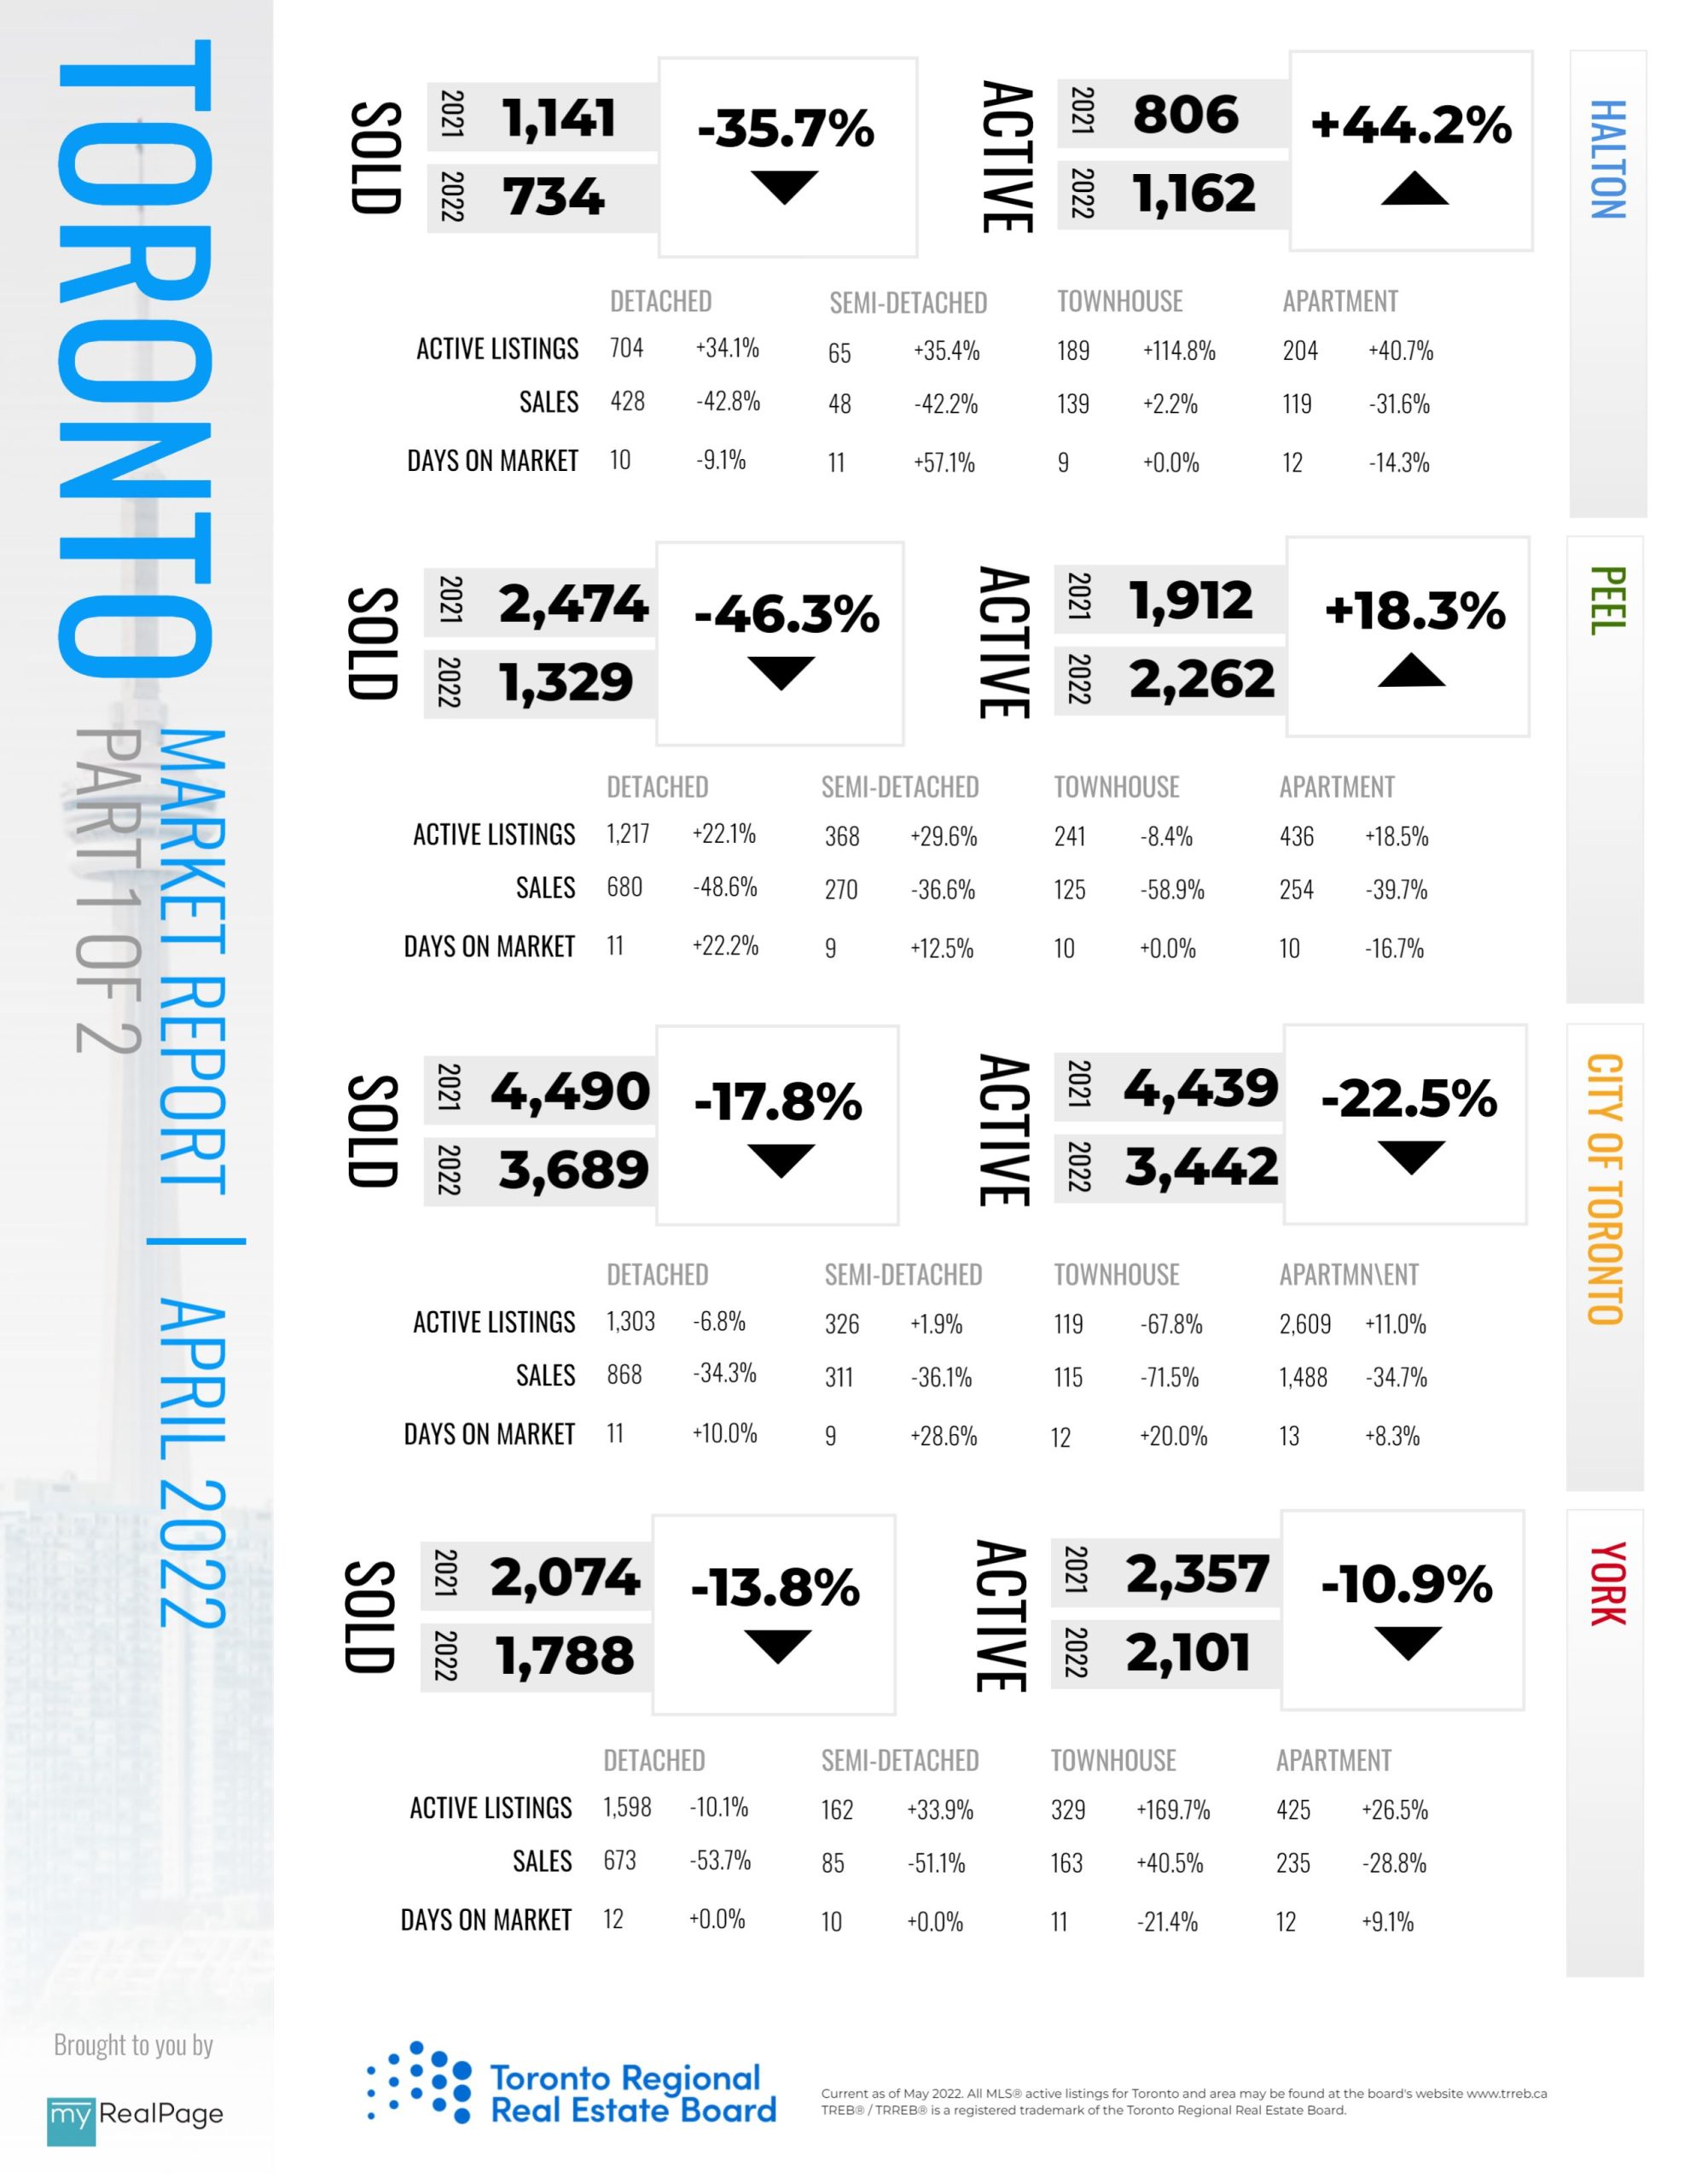
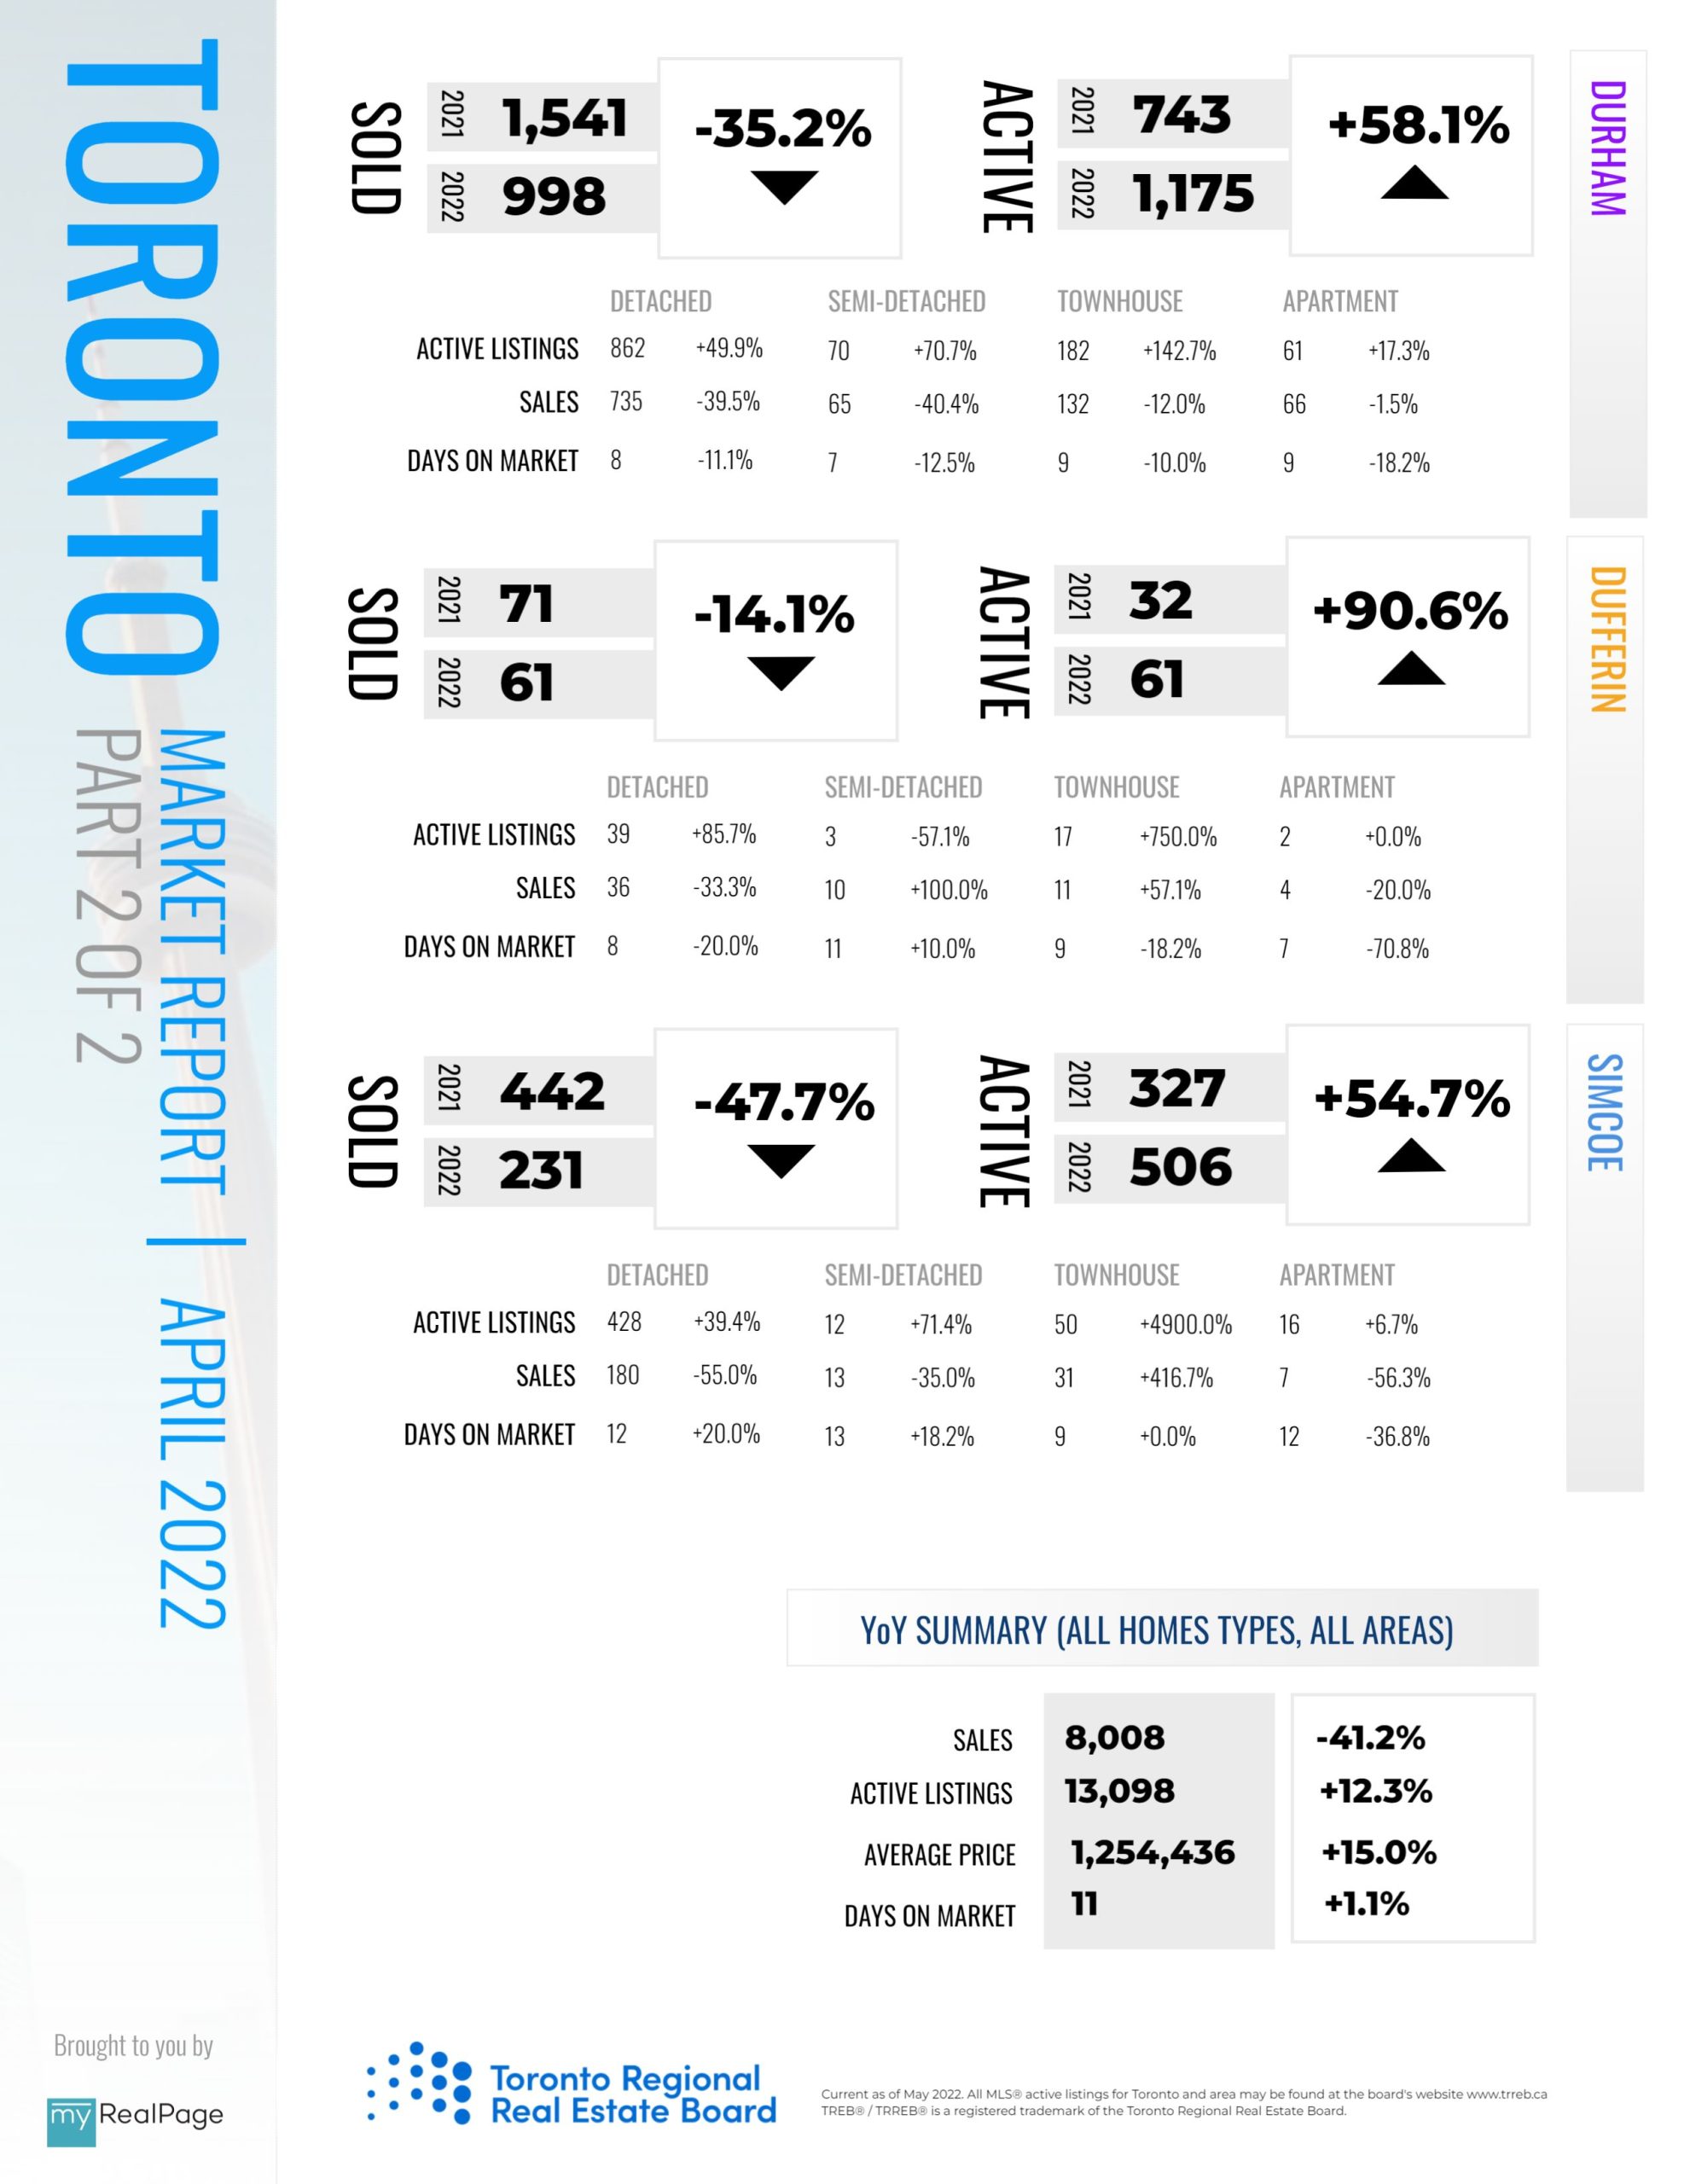
The Greater Toronto Area (GTA) housing market continued its adjustment to higher borrowing costs, with the number of transactions down on a monthly and annual basis. As has been the case with previous rate tightening cycles, some home buyers have moved to the sidelines to determine how they will reposition themselves in the marketplace given the higher rate environment and related impact on affordability.
“Based on the trends observed in the April housing market, it certainly appears that the Bank of Canada is achieving its goal of slowing consumer spending as it fights high inflation. Negotiated mortgage rates rose sharply over the past four weeks, prompting some buyers to delay their purchase. Moving forward, it will be interesting to see the balance the Bank of Canada strikes between combatting inflation versus stunting economic growth and related government revenues as we continue to recover from and pay for pandemic-related programs,” said TRREB President Kevin Crigger.
GTA REALTORS® reported 8,008 homes sold through TRREB’s MLS® System in April 2022 – a 41.2 per cent decrease compared to April 2021 and a 27 per cent decrease compared to March 2022. On a year-over-year basis, the decline in sales was greater in the ‘905’ area code regions surrounding Toronto, particularly for detached houses.
Read the full report on TRREB website!
The following data is a comparison between April 2022 and April 2021 numbers, and is current as of May 2022. For last month’s numbers, check out our previous infographic!
Or follow this link for all our TREB / TRREB Infographics!
Download Printable Version – April 2022 TRREB, Toronto Market Report Part 1
Download Printable Version – April 2022 TRREB, Toronto Market Report Part 2
Last Updated on November 28, 2023 by myRealPage
