INFOGRAPHICS: August 2020 FVREB Fraser Valley, South Surrey, Etc. Market Reports

Sales and new listings continue to set records in the Fraser Valley
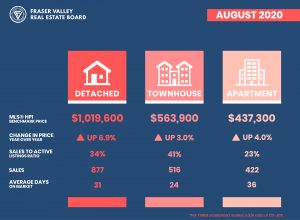
The Fraser Valley Real Estate Board’s Multiple Listing Service® (MLS®) saw the second highest number of property sales and the highest number of new listings in August within the last two decades, when 2,298 sales were recorded in August 2005.
The FVREB processed a total of 2,039 sales in August, a decrease of 2.9% compared to sales in July, but an increase of 57.2% compared to the 1,297 sales during August of last year. Last month’s sales were 39% above the ten-year average for August, representing the highest August in the last decade and second only to what was recorded back in August 2005.
Read the full report on the FVREB website!
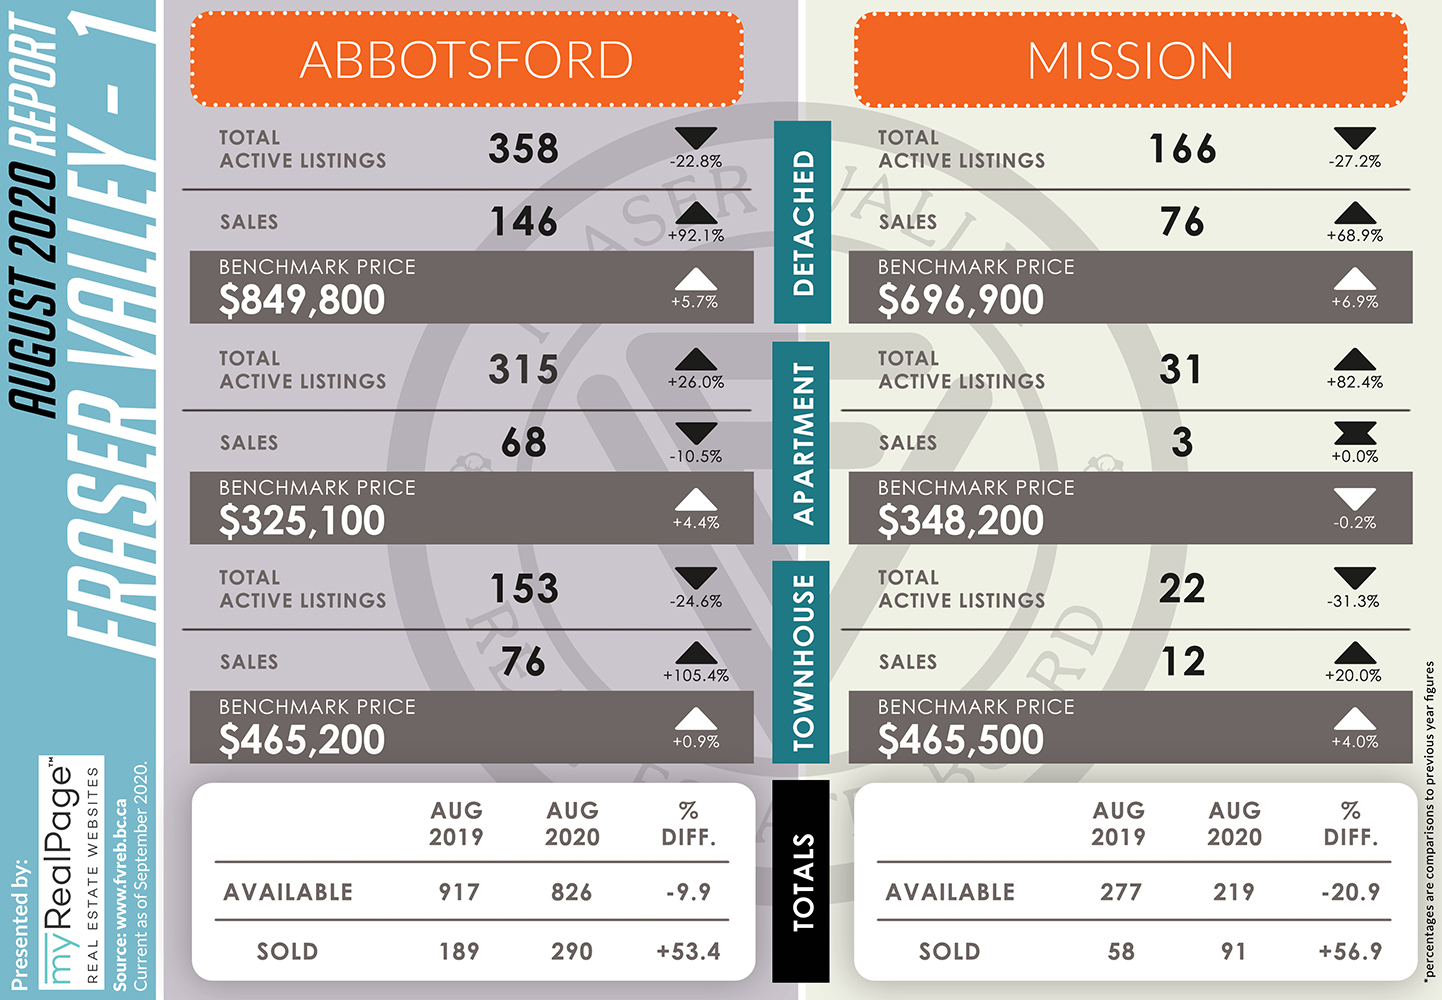
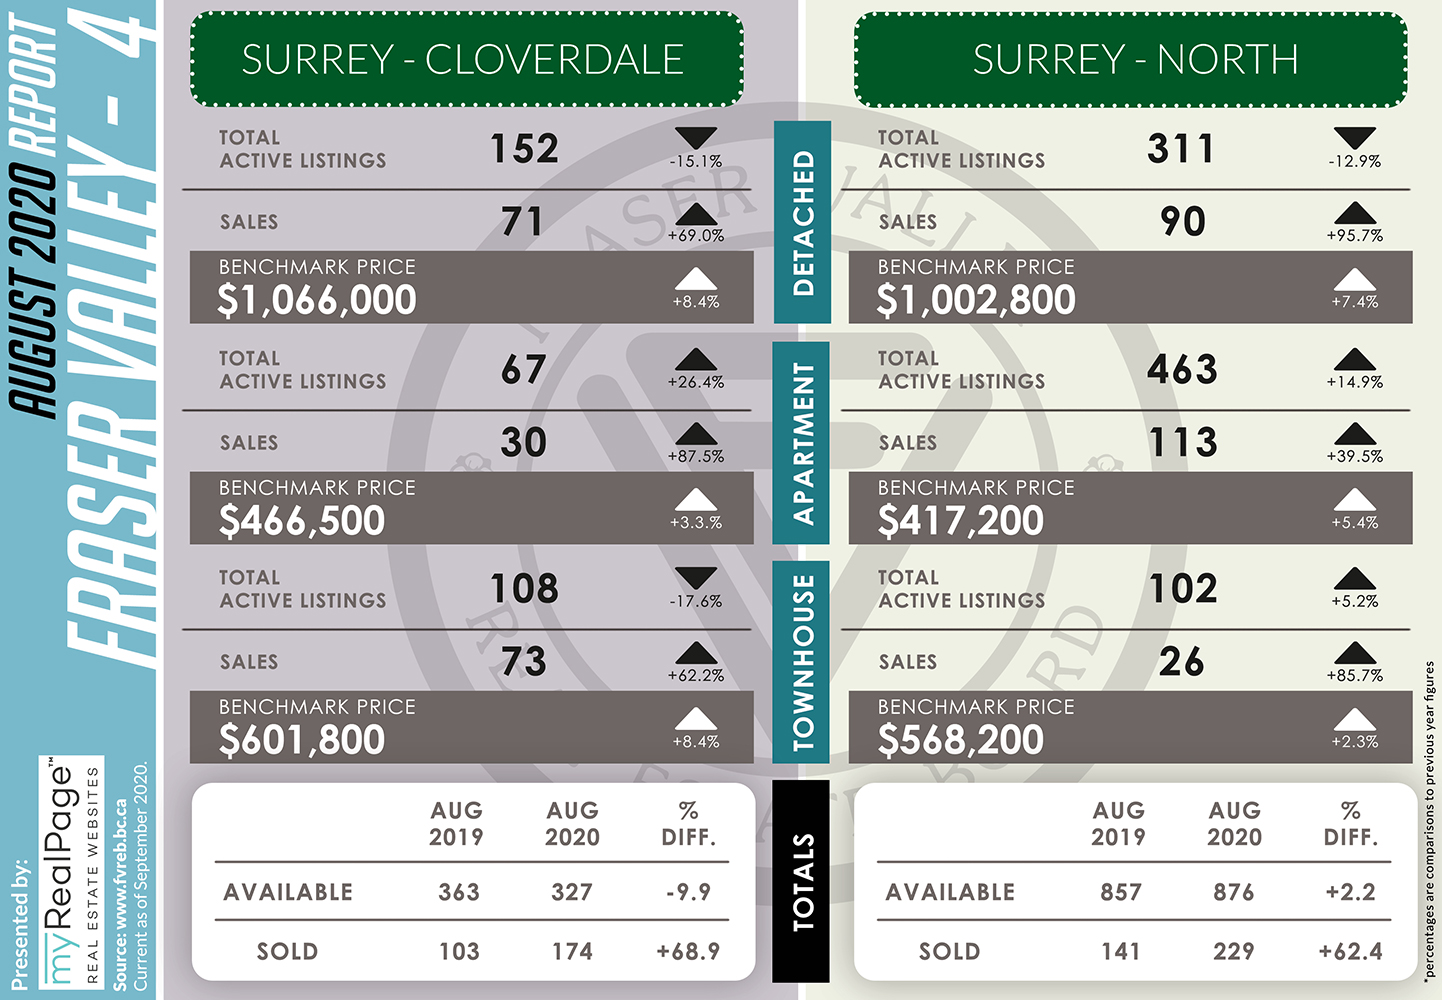
The following data is a comparison between August 2019 and August 2020 numbers, and is current as of September 2020. For last month’s report, check out our previous infographic!
Or follow this link for all our FVREB Infographics!
These infographics cover current trends in Fraser Valley neighbourhoods that are within the FVREB. Click on the images for a larger view! (Protip: Make sure to grab the printable PDF version, too! It fits best when printed on A4-sized sheets, AND we’ve added an area on the sheet where you can attach your business card! 🙂 )
Download Printable Version – FVREB August 2020 Market Report


-
- Image from FVREB Twitter

Last Updated on November 28, 2023 by myRealPage
