INFOGRAPHICS: August 2022 CREB City And Region Market Reports
Supply levels ease with fewer new listings in August
August sales activity was comparable to the strong levels recorded last year and well above long-term trends for the month.
While sales have remained relatively strong, there continues to be a shift towards more affordable options as the year-over-year pullback in detached sales was nearly matched by gains for multi-family product types.
“While higher lending rates have slowed activity in the detached market, we are still seeing homebuyers shift to more affordable options which is keeping sales activity relatively strong,” said CREB® Chief Economist Ann-Marie Lurie. “This makes Calgary different than some of the larger cities in the country which have recorded significant pullbacks in sales.”
At the same time, new listings continue to trend down, preventing any supply gains or a substantial shift in the months of supply.
Despite year-over-year gains in new listings, the spread between new listings and sales this month narrowed compared to the past three months. This caused total inventory to trend down and prevented any significant shift in the months of supply. The months of supply in August remained at just above two months, not at tight as earlier in the year, but still below levels traditionally seen this time of year.
Read the full report on the CREB website!
The following data is a comparison between August 2022 and August 2021 numbers, and is current as of September 2022. For last month’s numbers, check out our previous infographic.
Or follow this link for all our CREB Infographics!
Click on the images for a larger view!
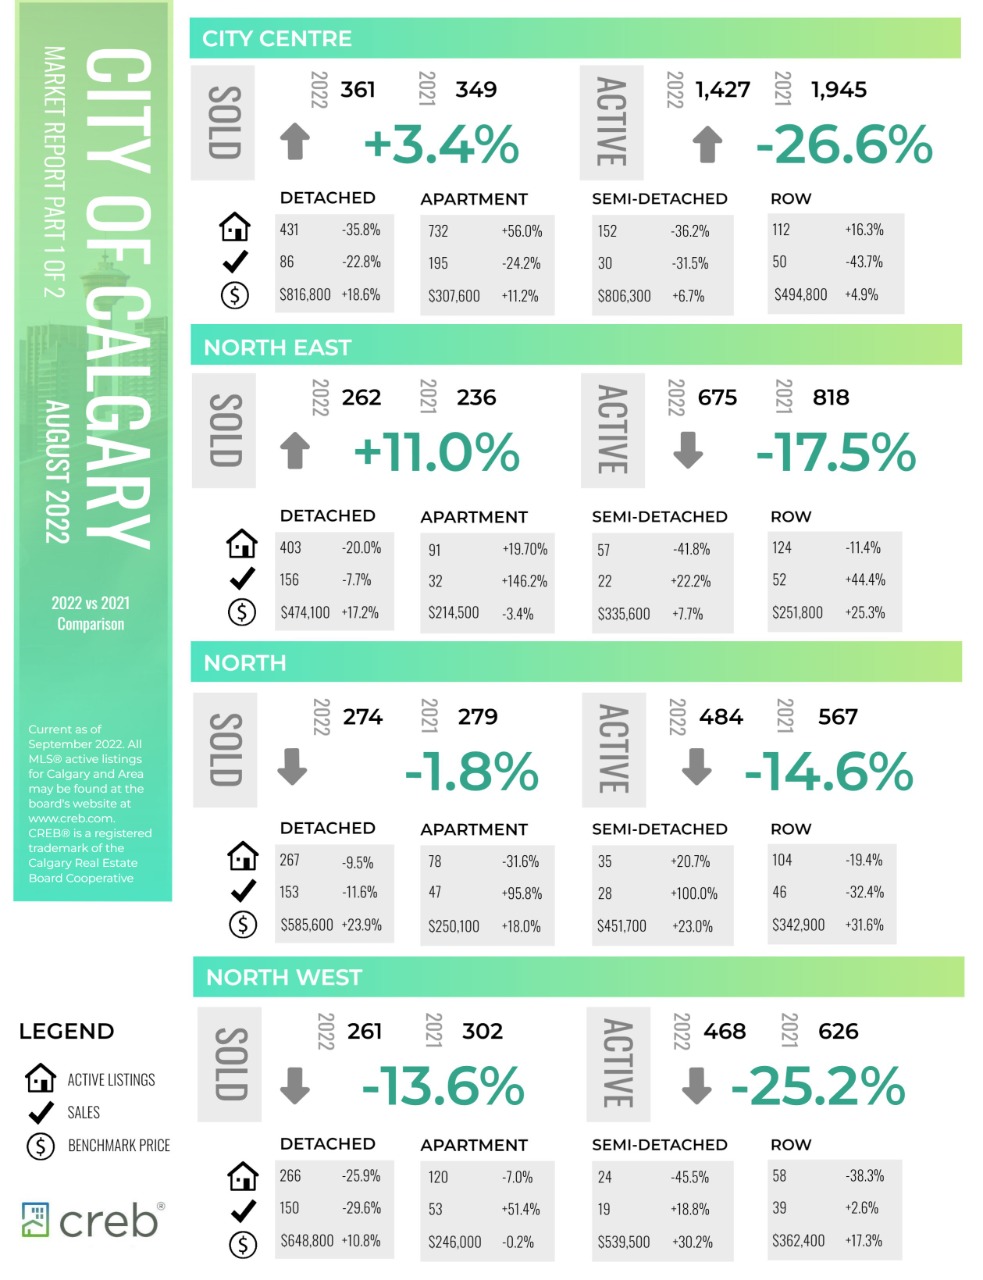
Download Printable Version – August 2022 CREB, City of Calgary Report Part 1
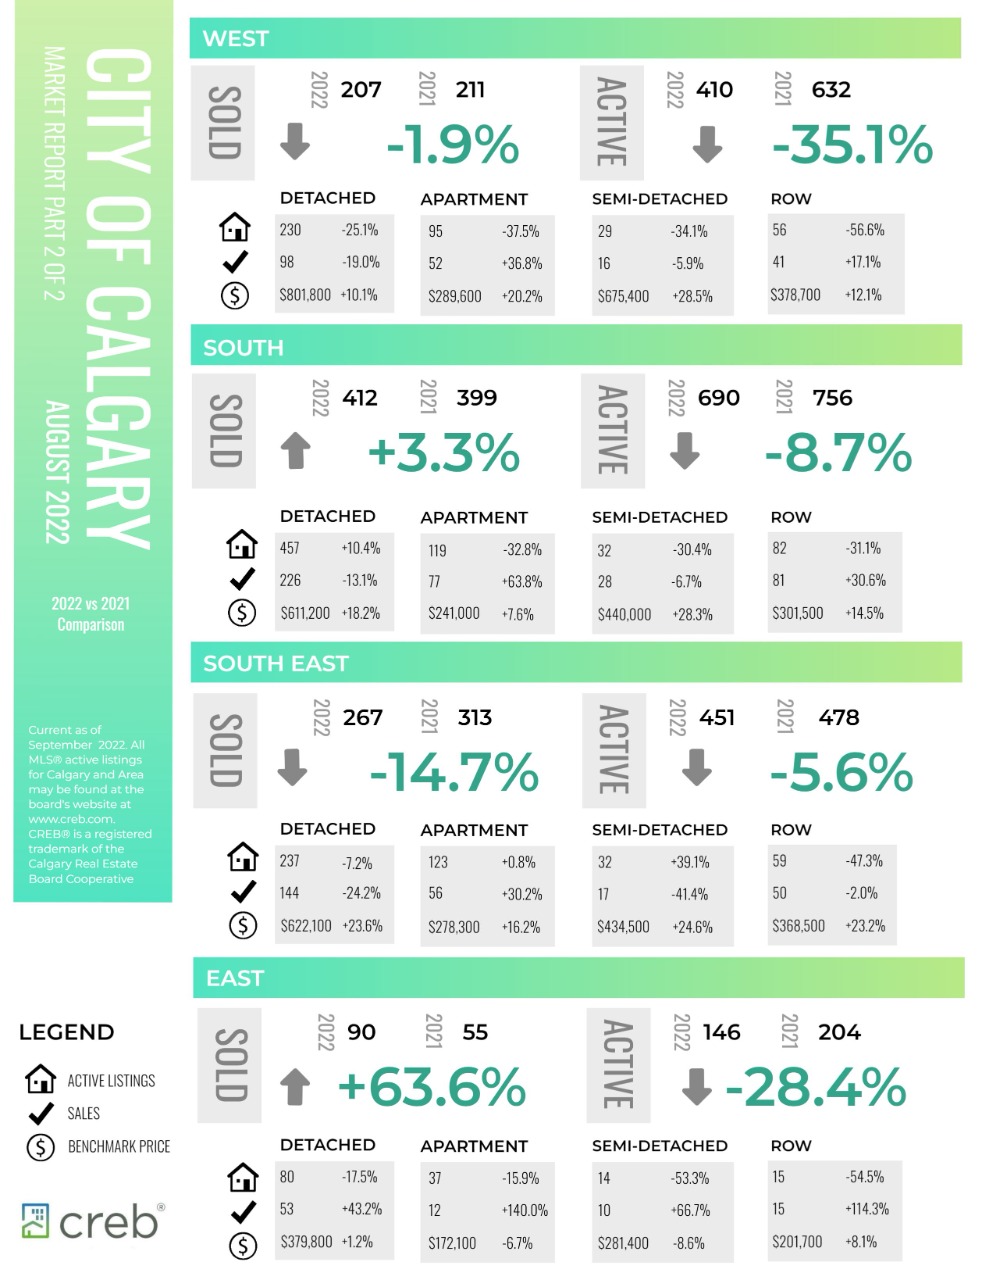
Download Printable Version – August 2022 CREB, City of Calgary Report Part 2
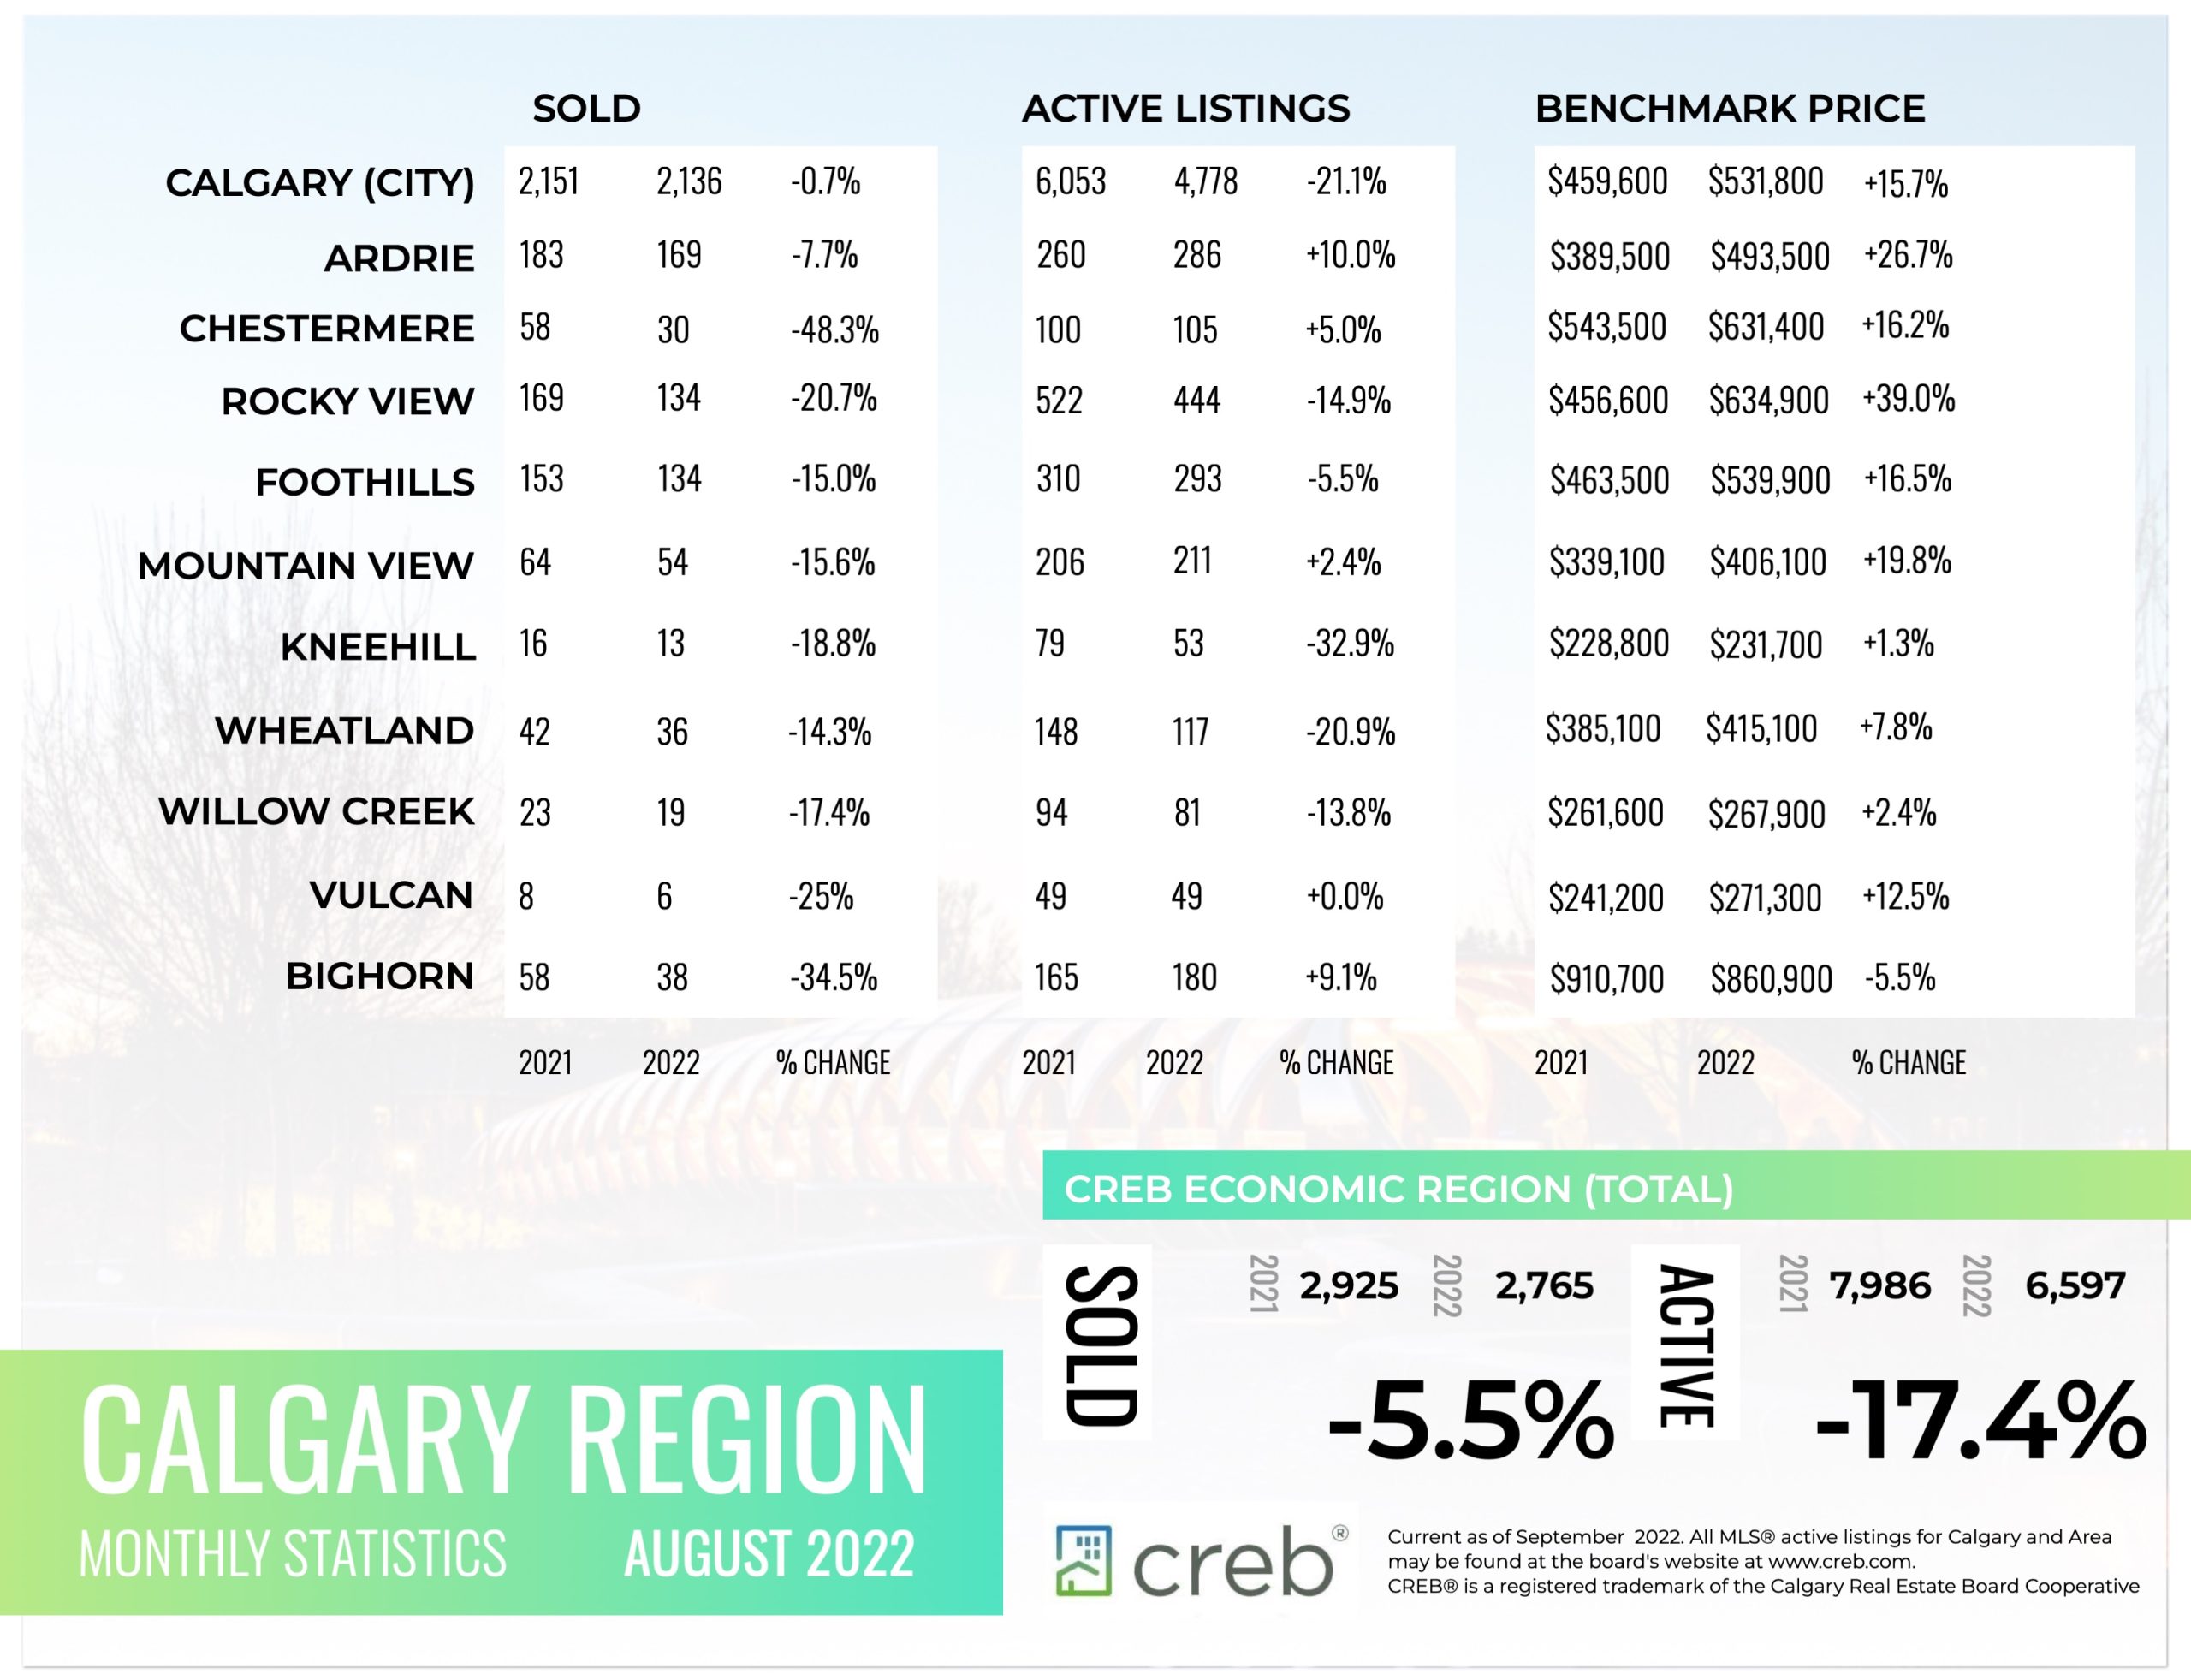
Download Printable Version – August 2022 CREB, Calgary Region Report
Last Updated on November 28, 2023 by myRealPage
