INFOGRAPHICS: December 2020 TRREB Toronto Market Reports

“The Greater Toronto Area housing market followed an unfamiliar path in 2020. Following the steep COVID-induced drop-off in demand during the spring, home sales roared back to record levels throughout the summer and fall. A strong economic rebound in many sectors of the economy, ultra-low borrowing costs and the enhanced use of technology for virtual open houses and showings fuelled and sustained the housing market recovery,” said Lisa Patel, Toronto Regional Real Estate Board (TRREB) President.
Read the full report on the TRREB website!
The following data is a comparison between December 2019 and December 2020 numbers, and is current as of January 2021. For last month’s numbers, check out our previous infographic!
Or follow this link for all our TREB / TRREB Infographics!
Click on the images for a larger view! (Protip: Make sure to grab the printable PDF versions, too! It fits best when printed on A4-sized sheets, AND we’ve added an area on the sheet where you can attach your business card! 🙂 )
Download Printable Version – December 2020 TRREB, Toronto Market Report
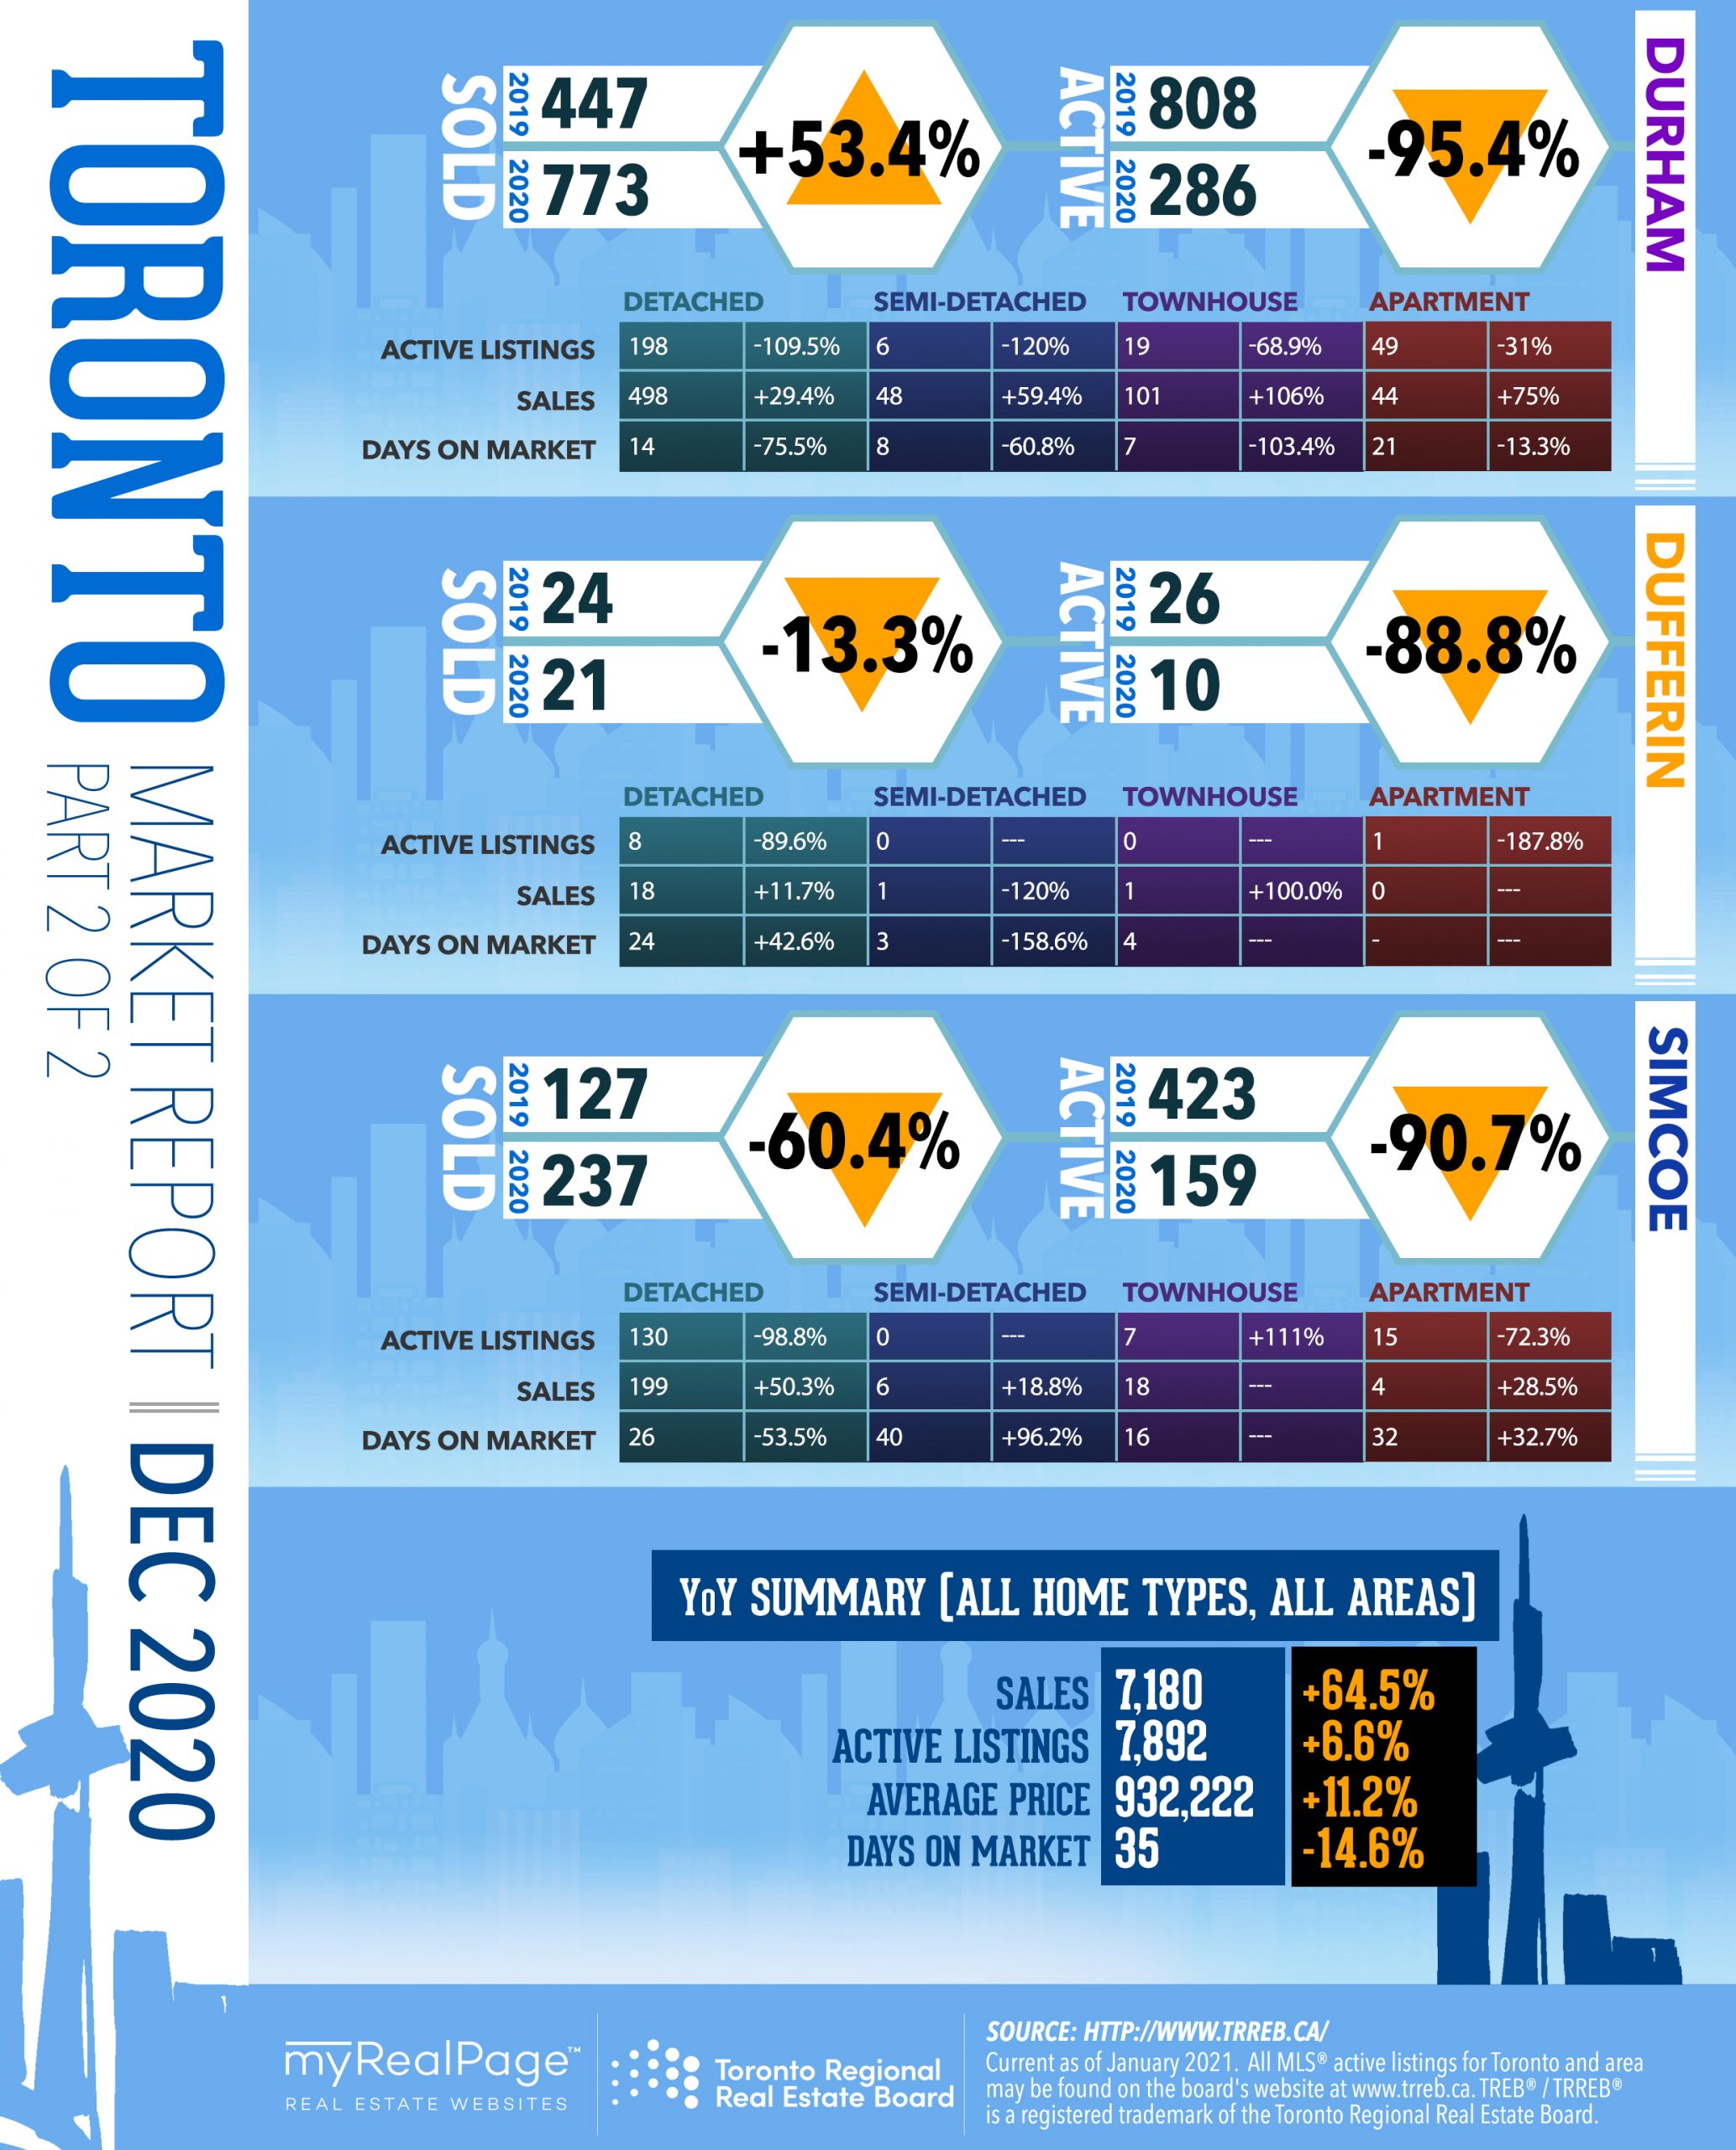
Download Printable Version – December 2020 TRREB Part 2, Toronto Market Report

Last Updated on July 25, 2022 by myRealPage
