INFOGRAPHICS: February 2020 REBGV Greater Vancouver Market Reports

We’re entering the last month of the first quarter of the year, and here’s our monthly market update for areas covered by the Real Estate Board of Greater Vancouver (REBGV)!
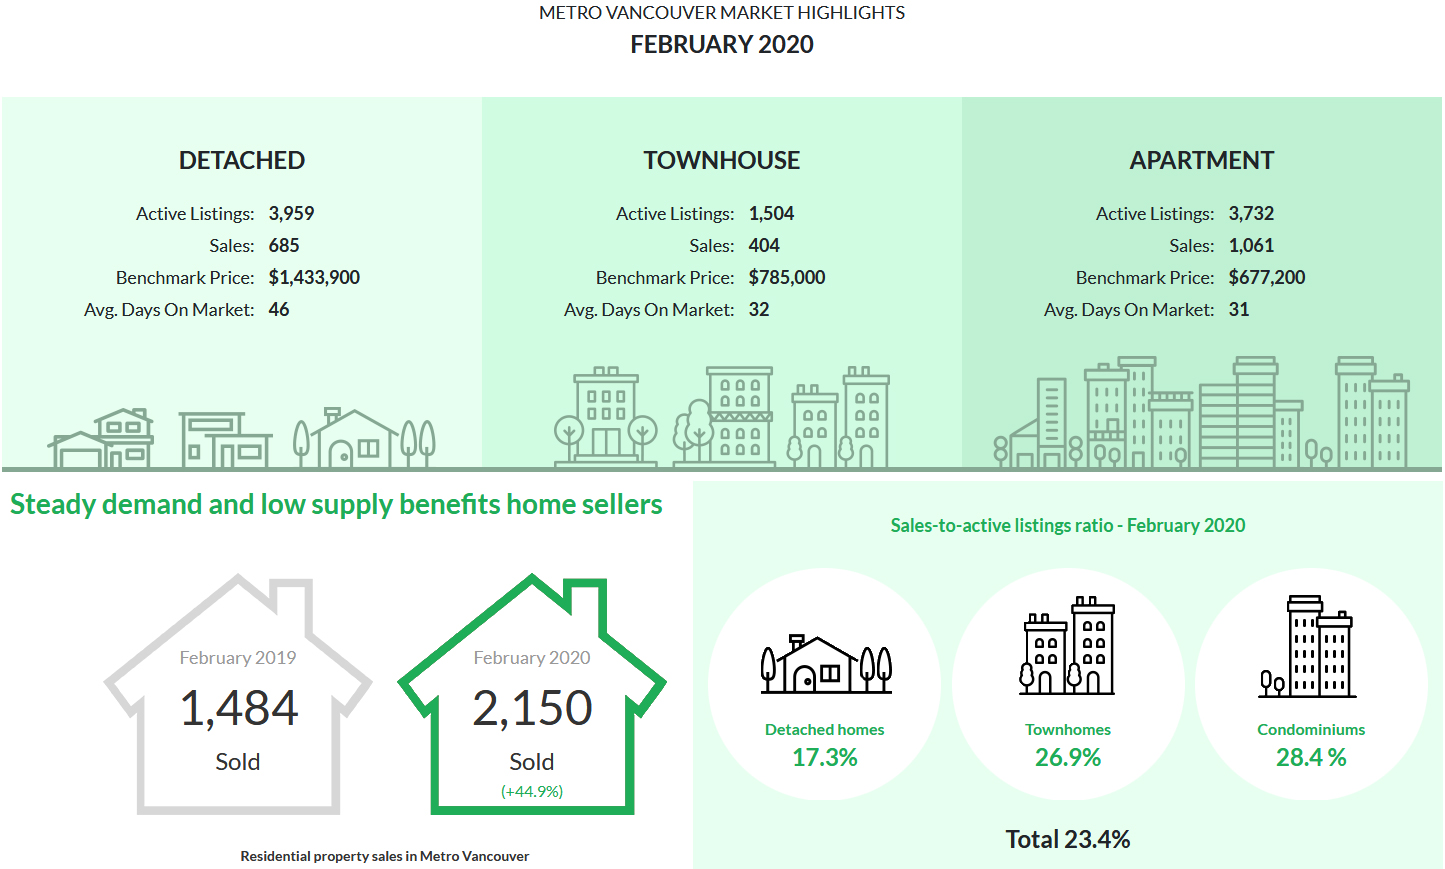
In REBGV’s most recent market update, it appears that steady demand and low supply benefits home sellers.
The Real Estate Board of Greater Vancouver (REBGV) reports that residential home sales in the region totaled 2,150 in February 2020, a 44.9% increase from the 1,484 sales recorded in February 2019, and a 36.9% increase from the 1,571 homes sold in January 2020.
Last month’s sales were 15.6% below the 10-year February sales average.
There were 4,002 detached, attached and apartment homes newly listed for sale on the Multiple Listing Service® (MLS®) in Metro Vancouver in February 2020. This represents a 2.8% increase compared to the 3,892 homes listed in February 2019 and a 3.4% increase compared to January 2020 when 3,872 homes were listed.
The total number of homes currently listed for sale on the MLS® system in Metro Vancouver is 9,195, a 20.7% decrease compared to February 2019 (11,590) and a 6.7% increase compared to January 2020 (8,617).
According to Ashley Smith, REBGV president,
“Home buyer demand again saw strong year-over-year increases in February while the total inventory of homes for sale struggled to keep pace. This was most pronounced in the condominium market.
Our Realtors are reporting increased traffic at open houses and multiple offer scenarios in certain pockets of the market. If you’re considering listing your home for sale, now is a good time to act with increased demand, reduced competition from other sellers, and some upward pressure on prices.”
For all property types, the sales-to-active listings ratio for February 2020 is 23.4%. By property type, the ratio is 17.3% for detached homes, 26.9% for townhomes, and 28.4% for apartments.
The following data is a comparison between February 2019 and February 2020 numbers, and is current as of March 2020. For last month’s update, you can check out our previous post for January 2020 data.
Or follow this link for all our REBGV Infographics!
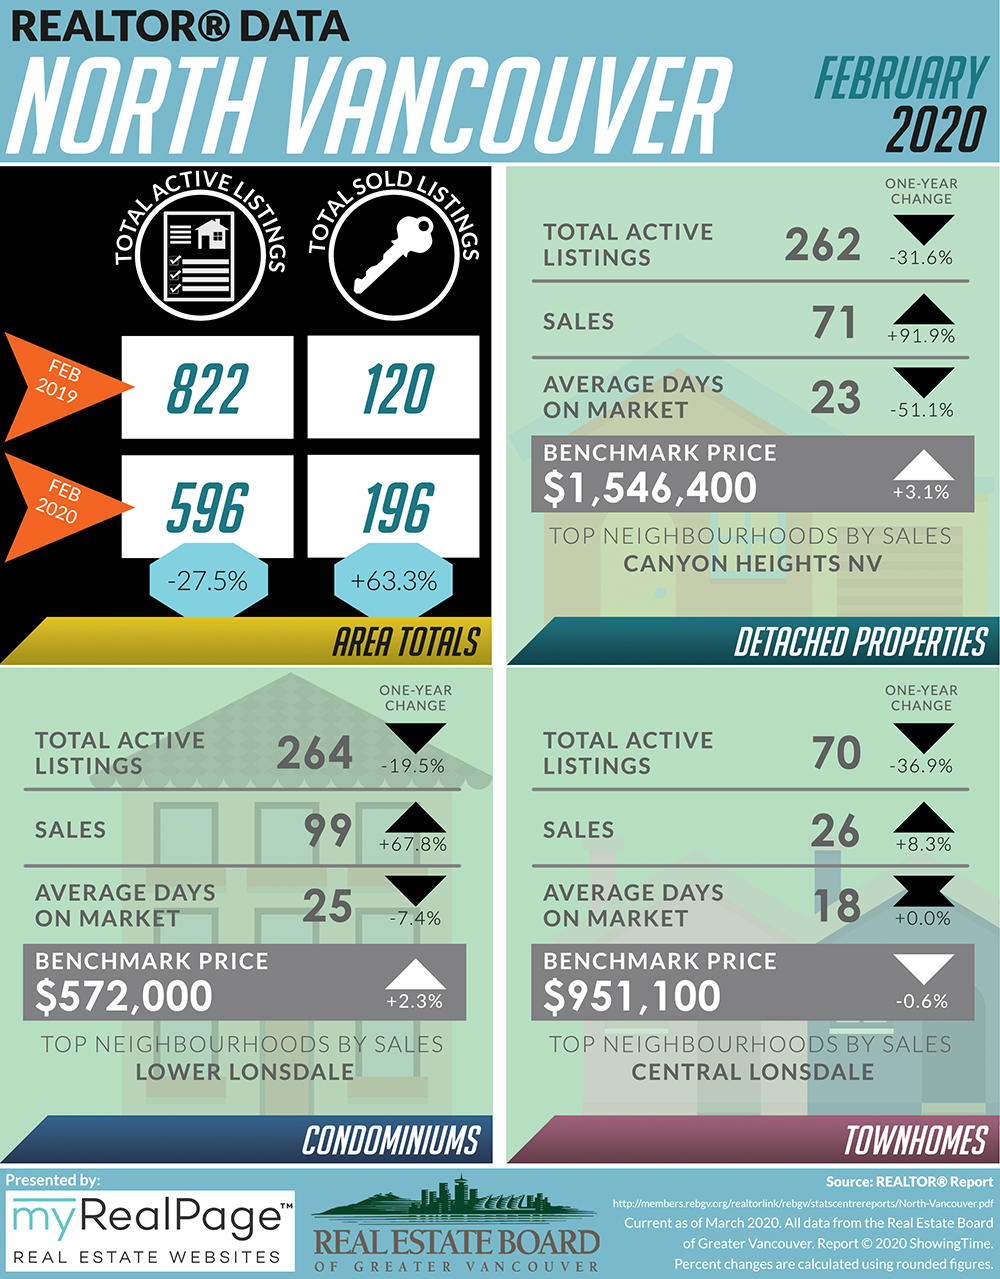
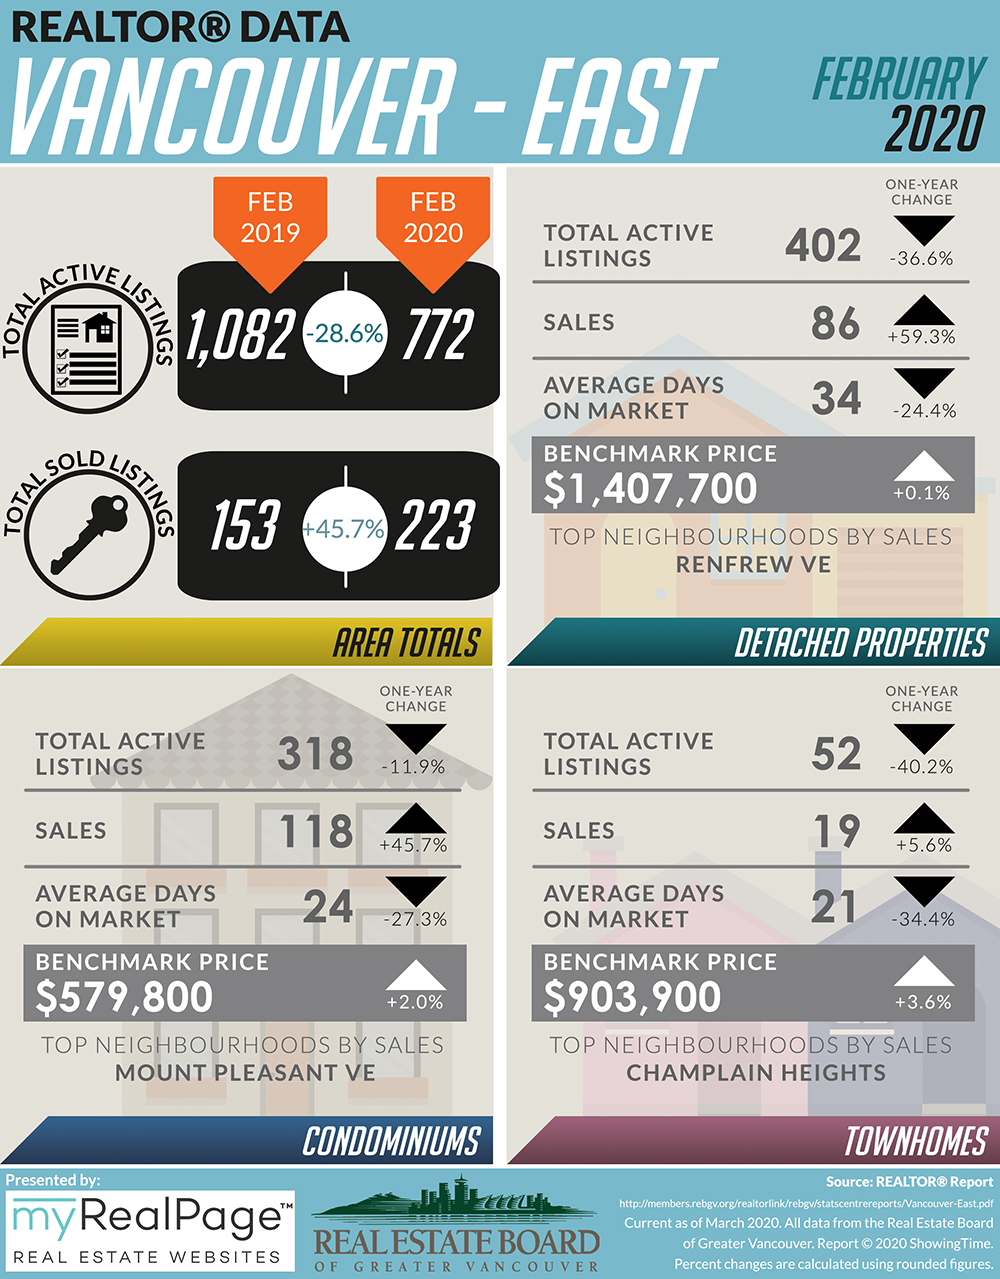
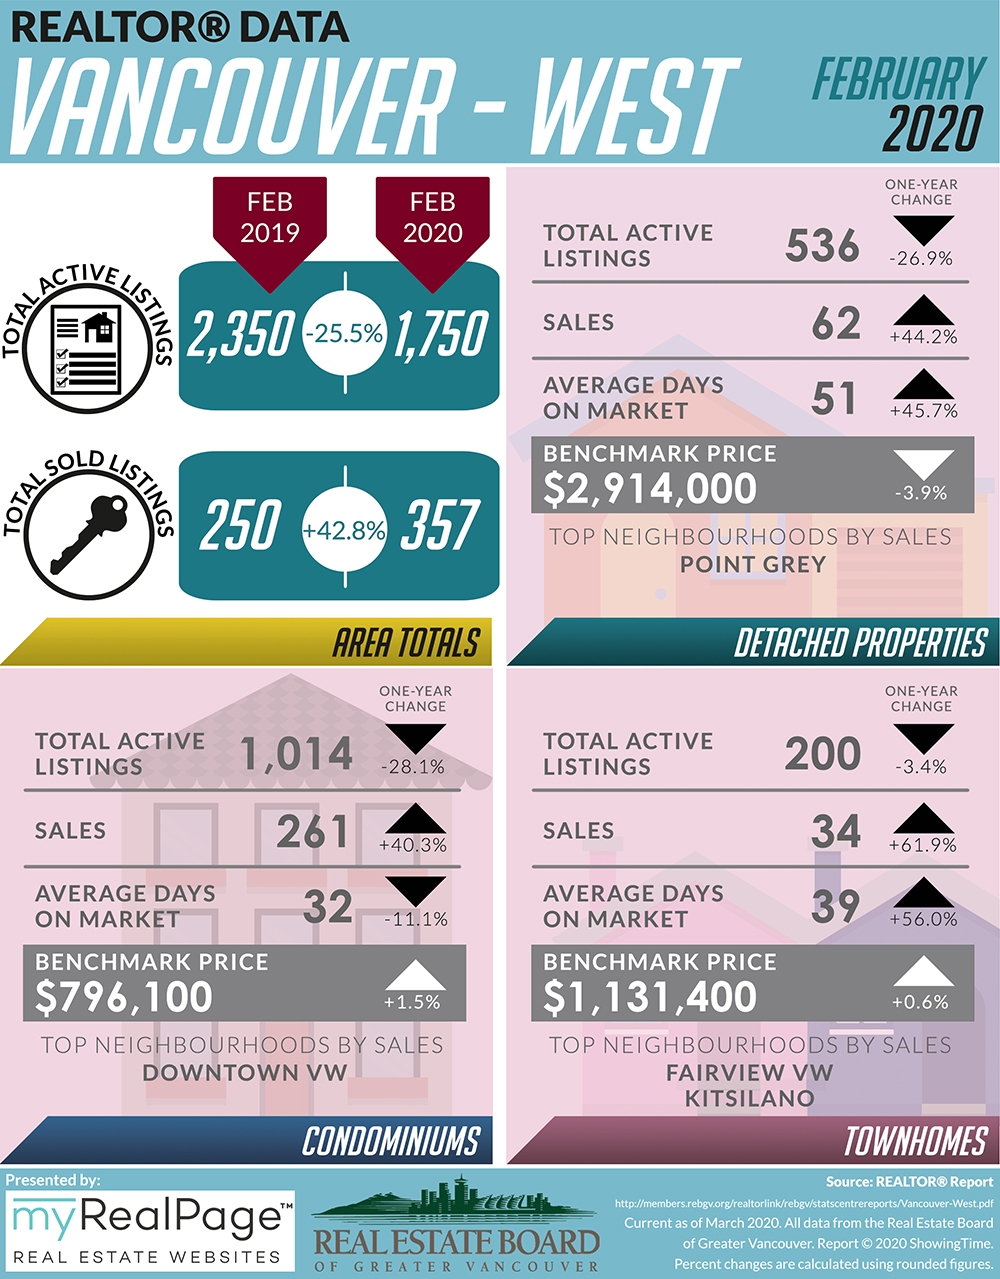
These infographics cover current trends in North Vancouver, West Vancouver, Vancouver East, and Vancouver West.
Click on the images for a larger view!
(Protip: Make sure to grab the printable PDF versions, too! It fits best when printed on A4-sized sheets, AND we’ve added an area on the sheet where you can attach your business card! 🙂 )
Download Printable Version – REBGV February 2020 Data Infographics

(Image from: REBGV.org)

(Image Source: REBGV Twitter)
Last Updated on July 25, 2022 by myRealPage
