INFOGRAPHICS: January 2020 REBGV Greater Vancouver Market Reports

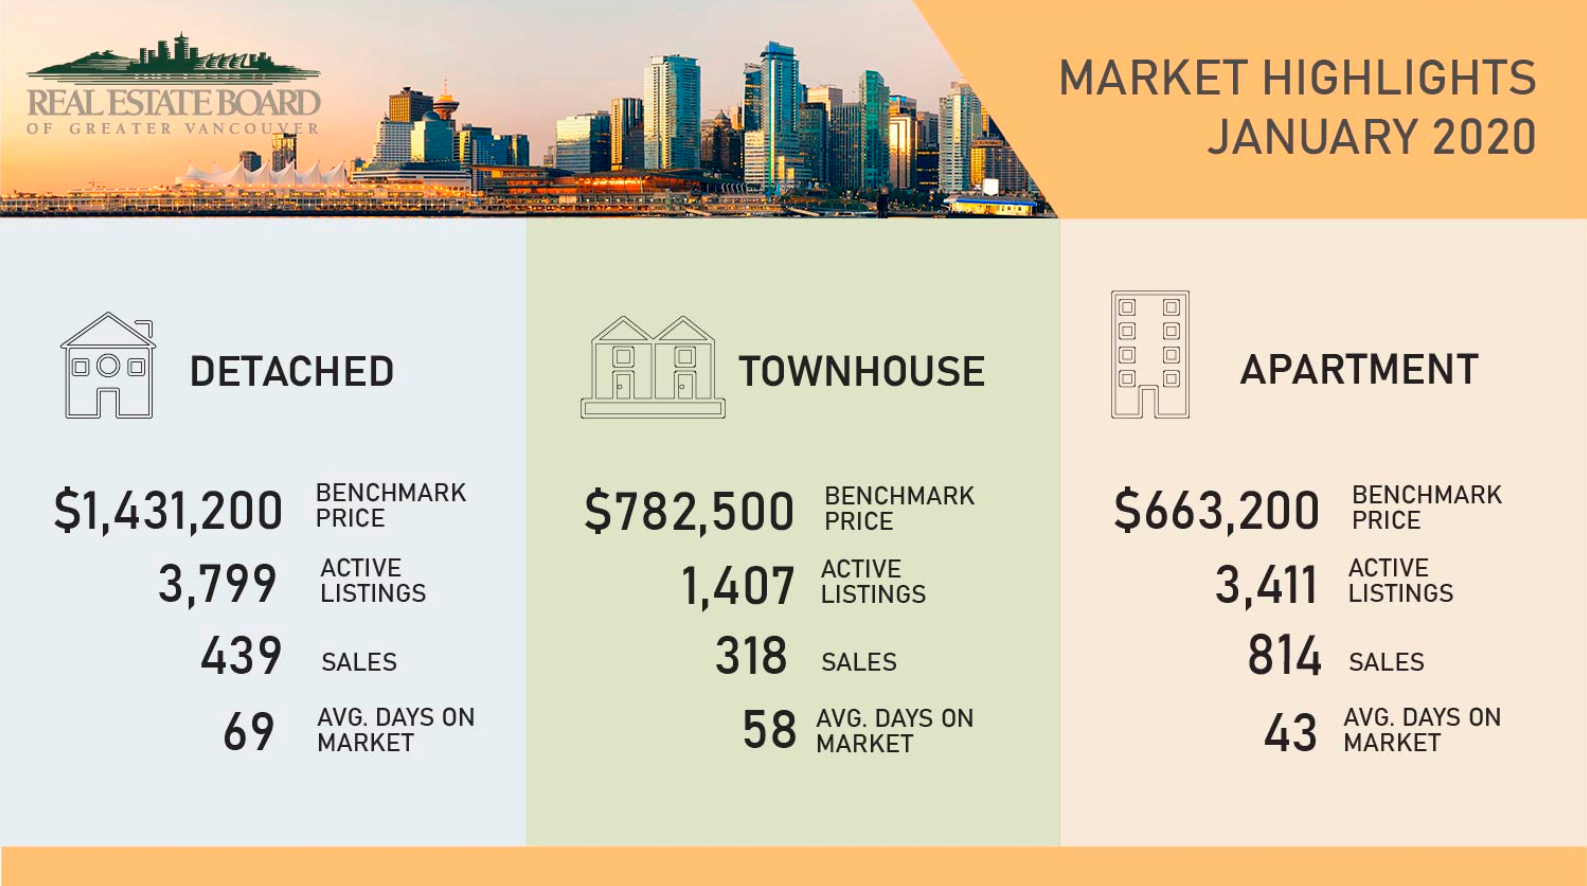
Here’s our monthly market update for areas covered by the Real Estate Board of Greater Vancouver (REBGV)!
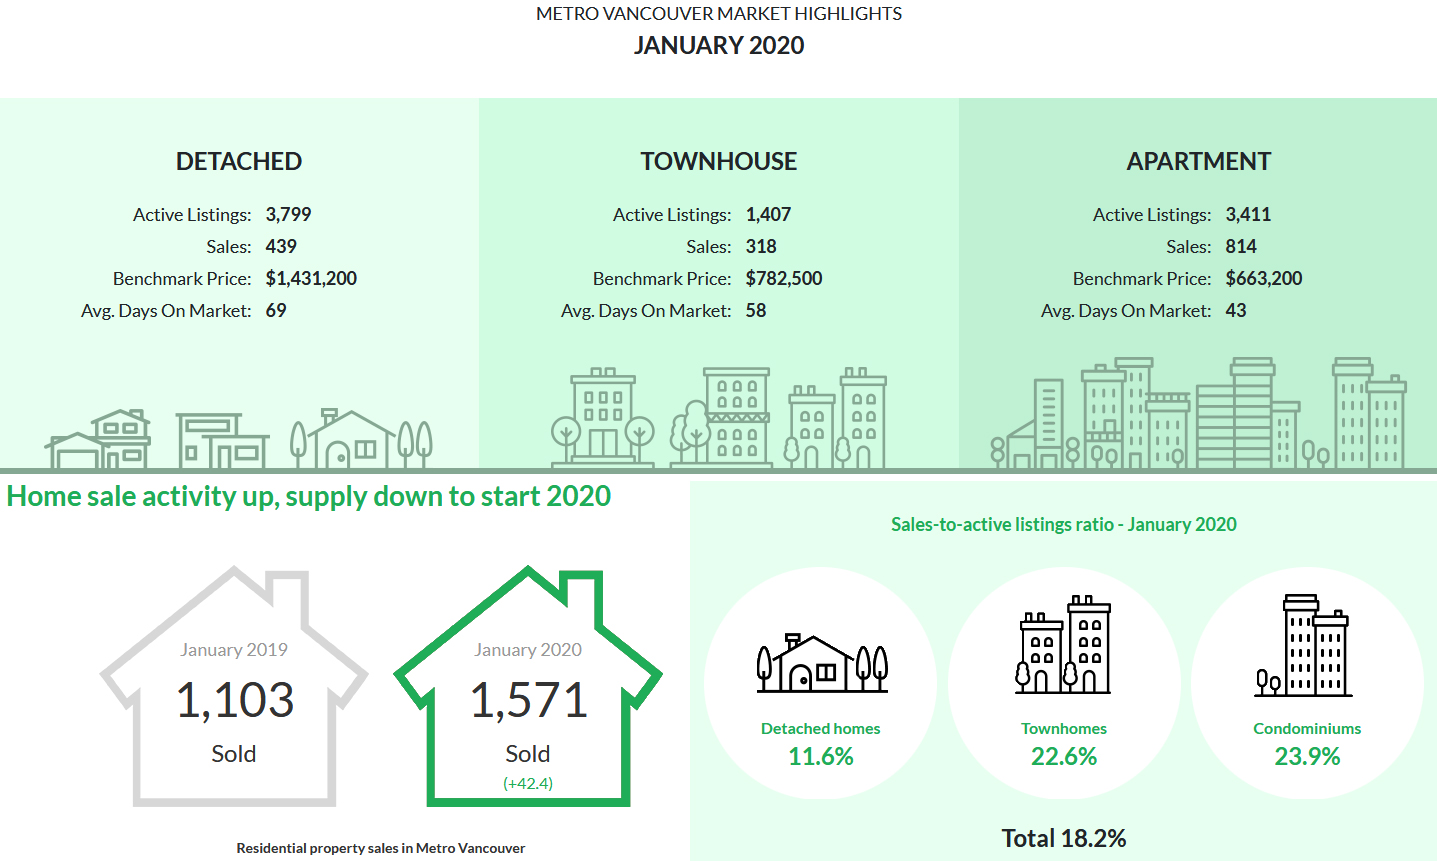
As per their latest news release, 2020 is starting out with home sale activity up, and supply down.
The REBGV reports that residential home sales in the region totalled 1,571 in January 2020, a 42.4% increase from the 1,103 sales recorded in January 2019, and a 22.1% decrease from the 2,016 homes sold in December 2019.
Last month’s sales were 7.3% below the 10-year January sales average.
There were 3,872 detached, attached and apartment properties newly listed for sale on the Multiple Listing Service® (MLS®) in Metro Vancouver in January 2020. This represents a 20.1% decrease compared to the 4,848 homes listed in January 2019 and a 143.8% increase compared to December 2019 when 1,588 homes were listed.
Last month’s new listings were 17.4% below January’s 10-year average.
The total number of homes currently listed for sale on the MLS® system in Metro Vancouver is 8,617, a 20.3% decrease compared to January 2019 (10,808) and a 0.2% increase compared to December 2019 (8,603), and is 13.7% below the 10-year January average.
For all property types, the sales-to-active listings ratio for January 2020 is 18.2%. By property type, the ratio is 11.6% for detached homes, 22.6% for townhomes, and 23.9% for apartments.
Ashley Smith, REBGV president, notes,
“We’ve begun 2020 with steady home buyer demand that tracks close to the region’s long-term average. Looking at supply, we’re seeing fewer homes listed for sale than is typical for this time of year. As we approach the traditionally more active spring market, we’ll keep a close eye on supply to see if the number of homes being listed is keeping pace with demand.”
The following data is a comparison between January 2019 and January 2020 numbers, and is current as of February 2020. For last month’s update, you can check out our previous post for December 2019 data.
Or follow this link for all our REBGV Infographics!
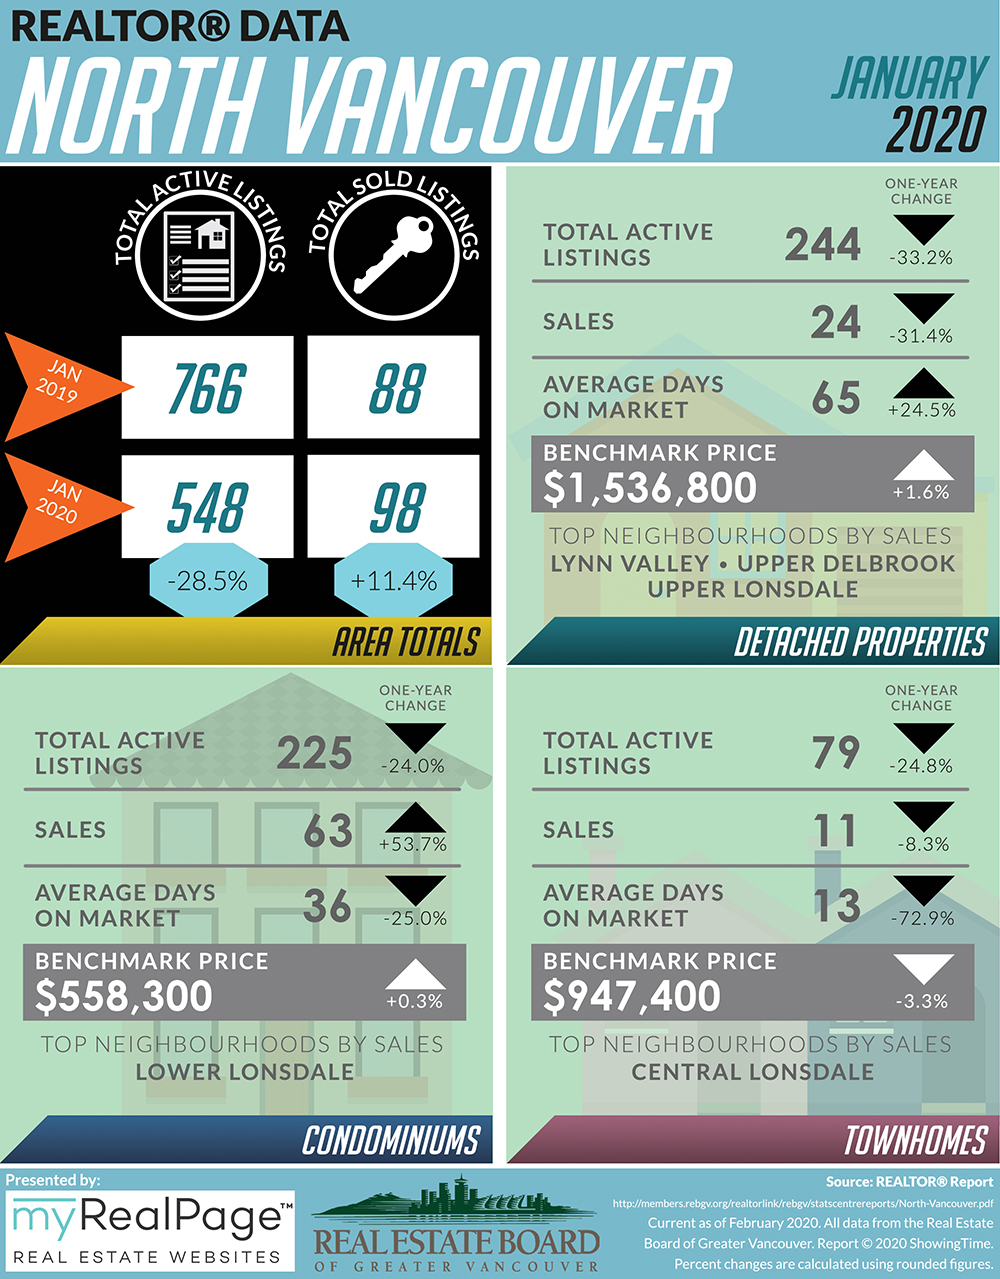
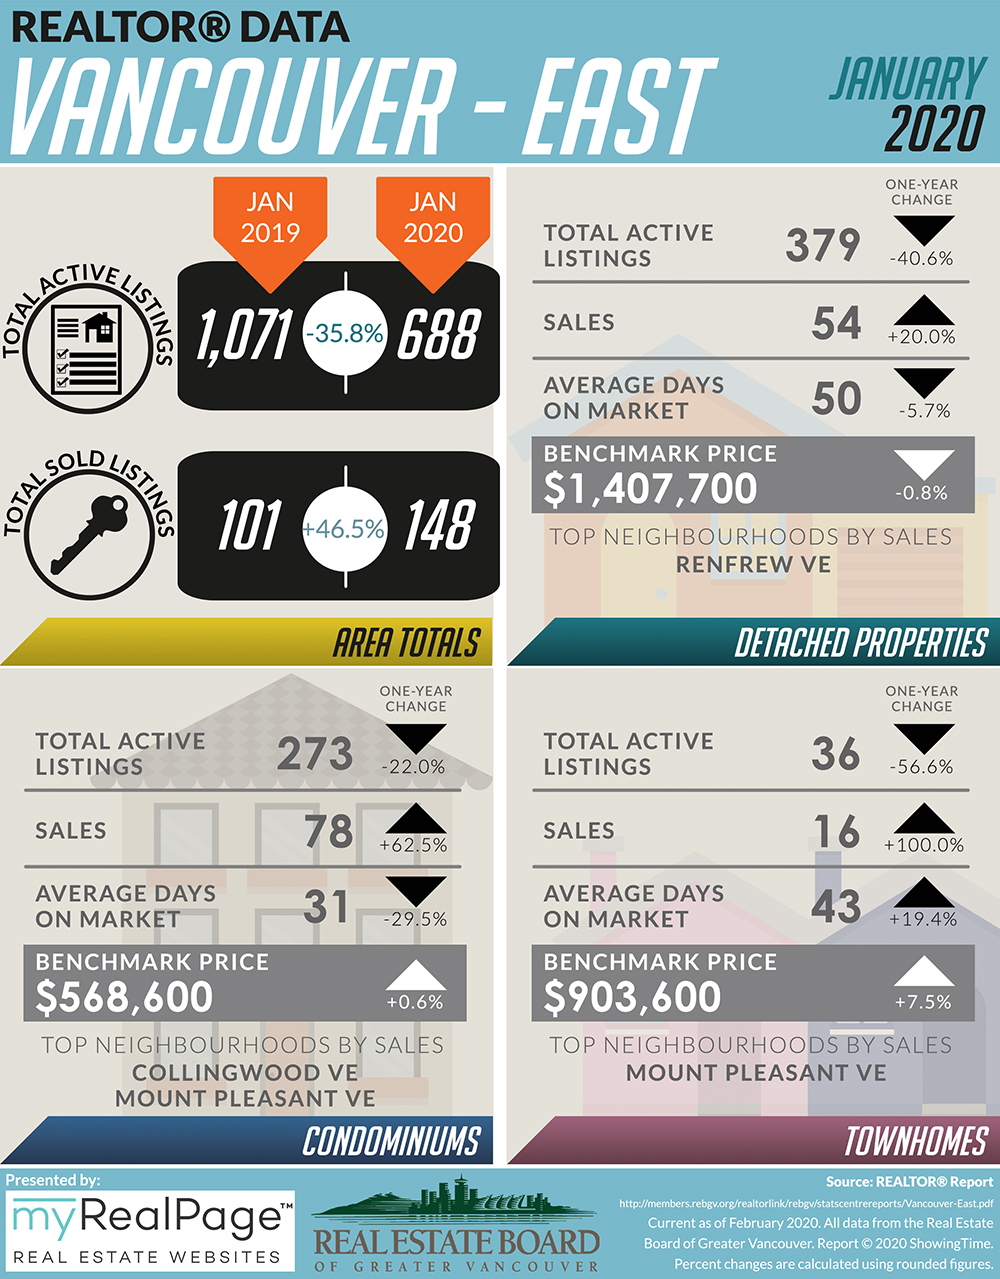
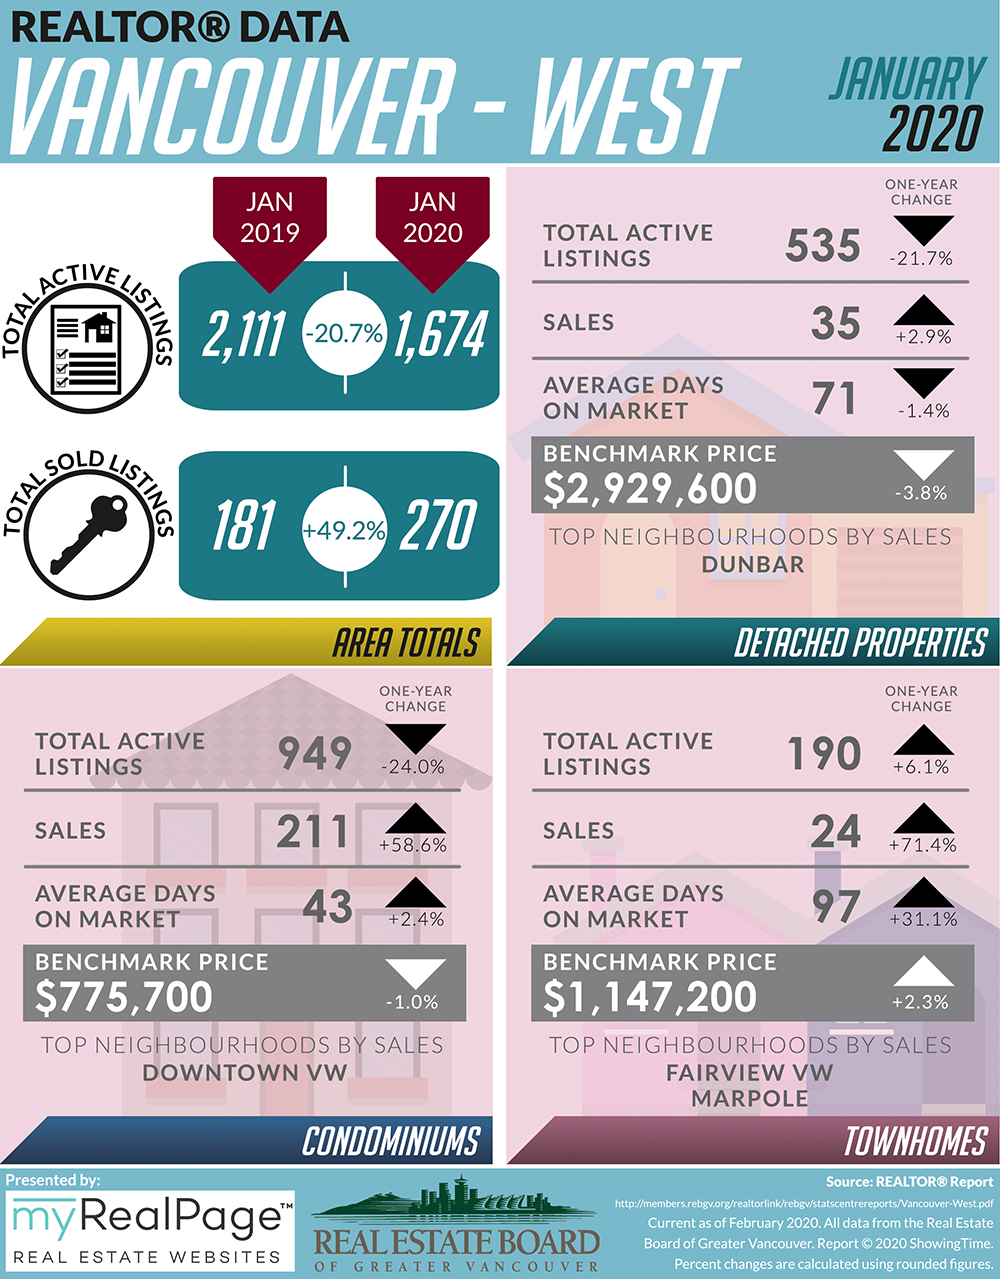
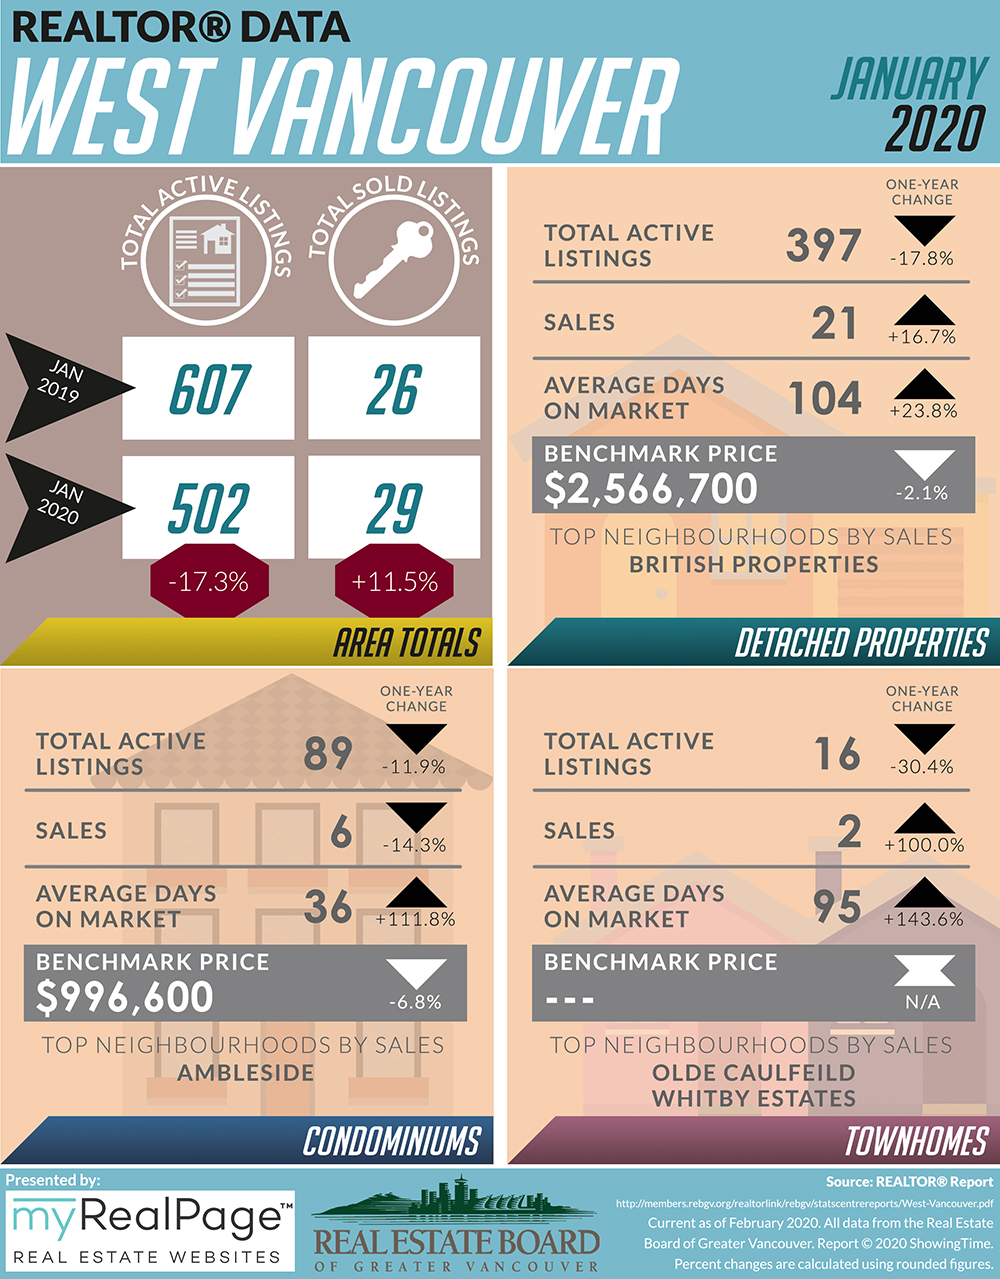
These infographics cover current trends in North Vancouver, West Vancouver, Vancouver East, and Vancouver West.
Click on the images for a larger view!
(Protip: Make sure to grab the printable PDF versions, too! It fits best when printed on A4-sized sheets, AND we’ve added an area on the sheet where you can attach your business card! 🙂 )
Download Printable Version – REBGV January 2020 Data Infographics
(Image from: REBGV.org)
(Image Source: REBGV Twitter)
Last Updated on July 25, 2022 by myRealPage
