INFOGRAPHICS: February 2023 TRREB Toronto Market Reports

GTA HOME SALES AND LISTINGS DROP IN FEBRUARY
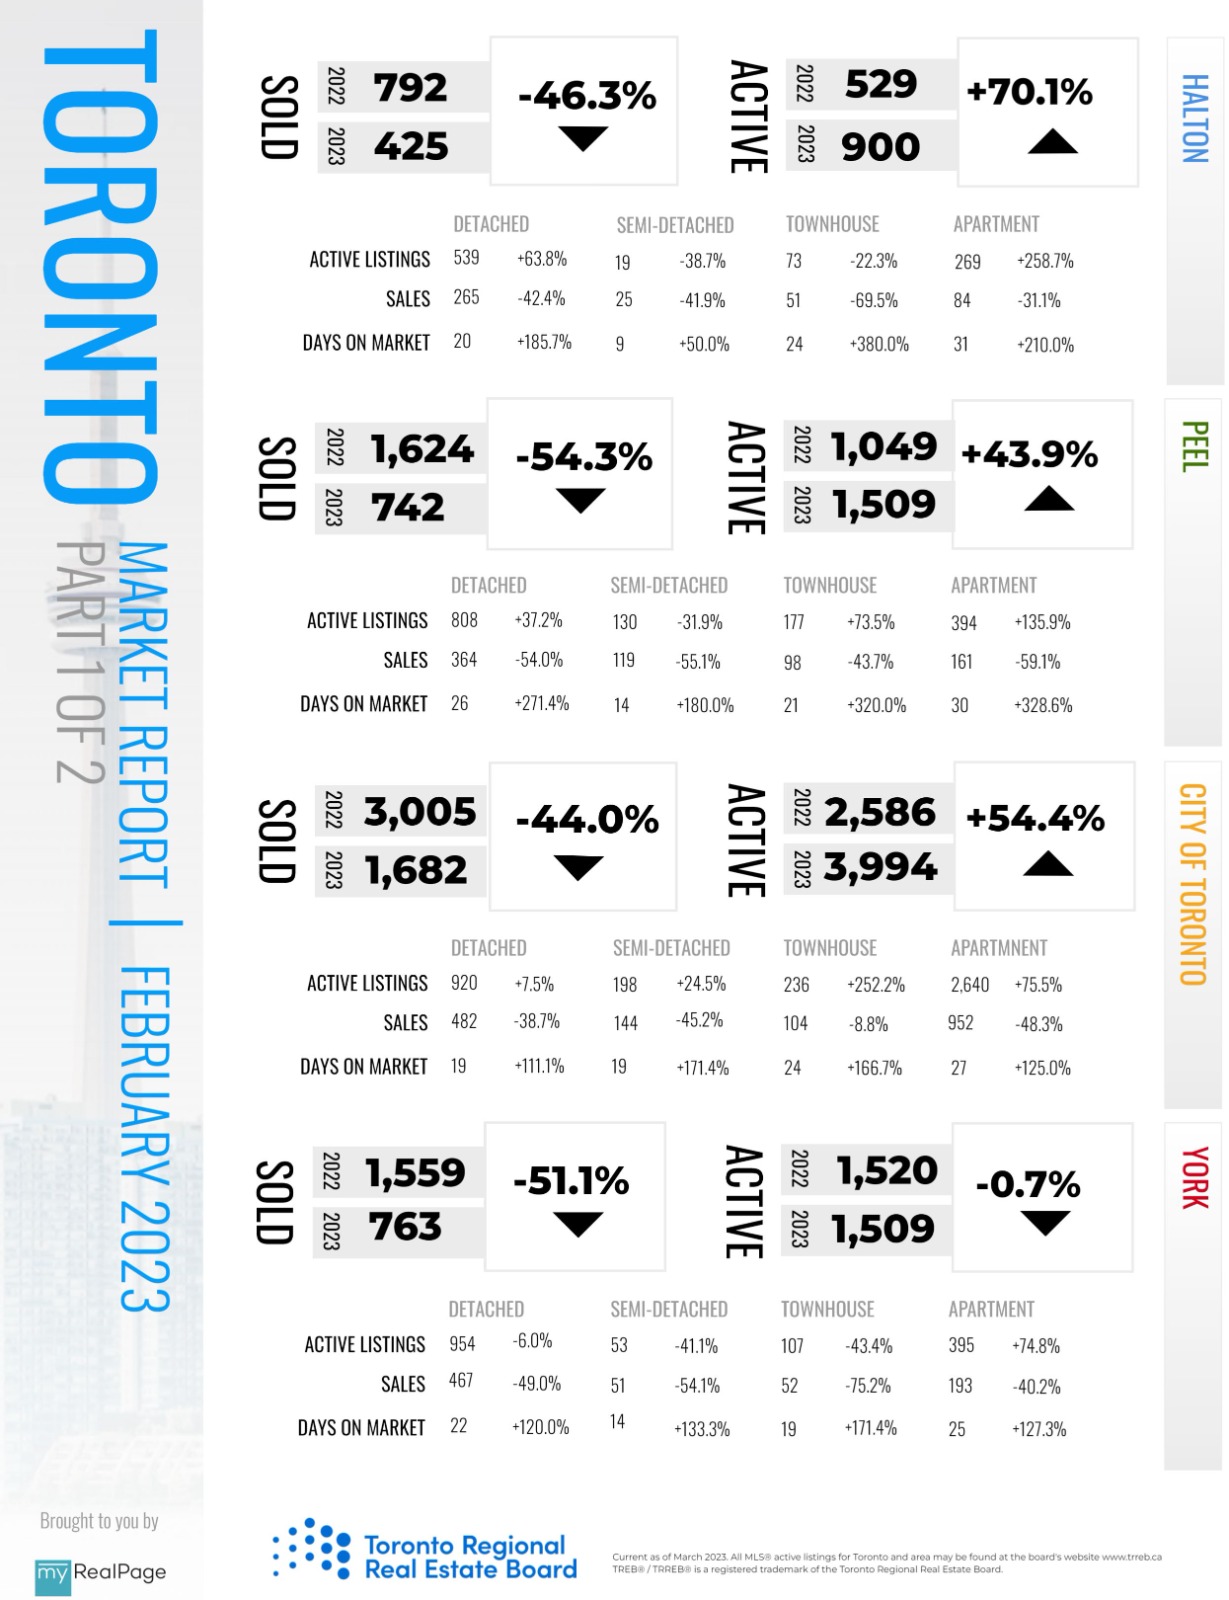
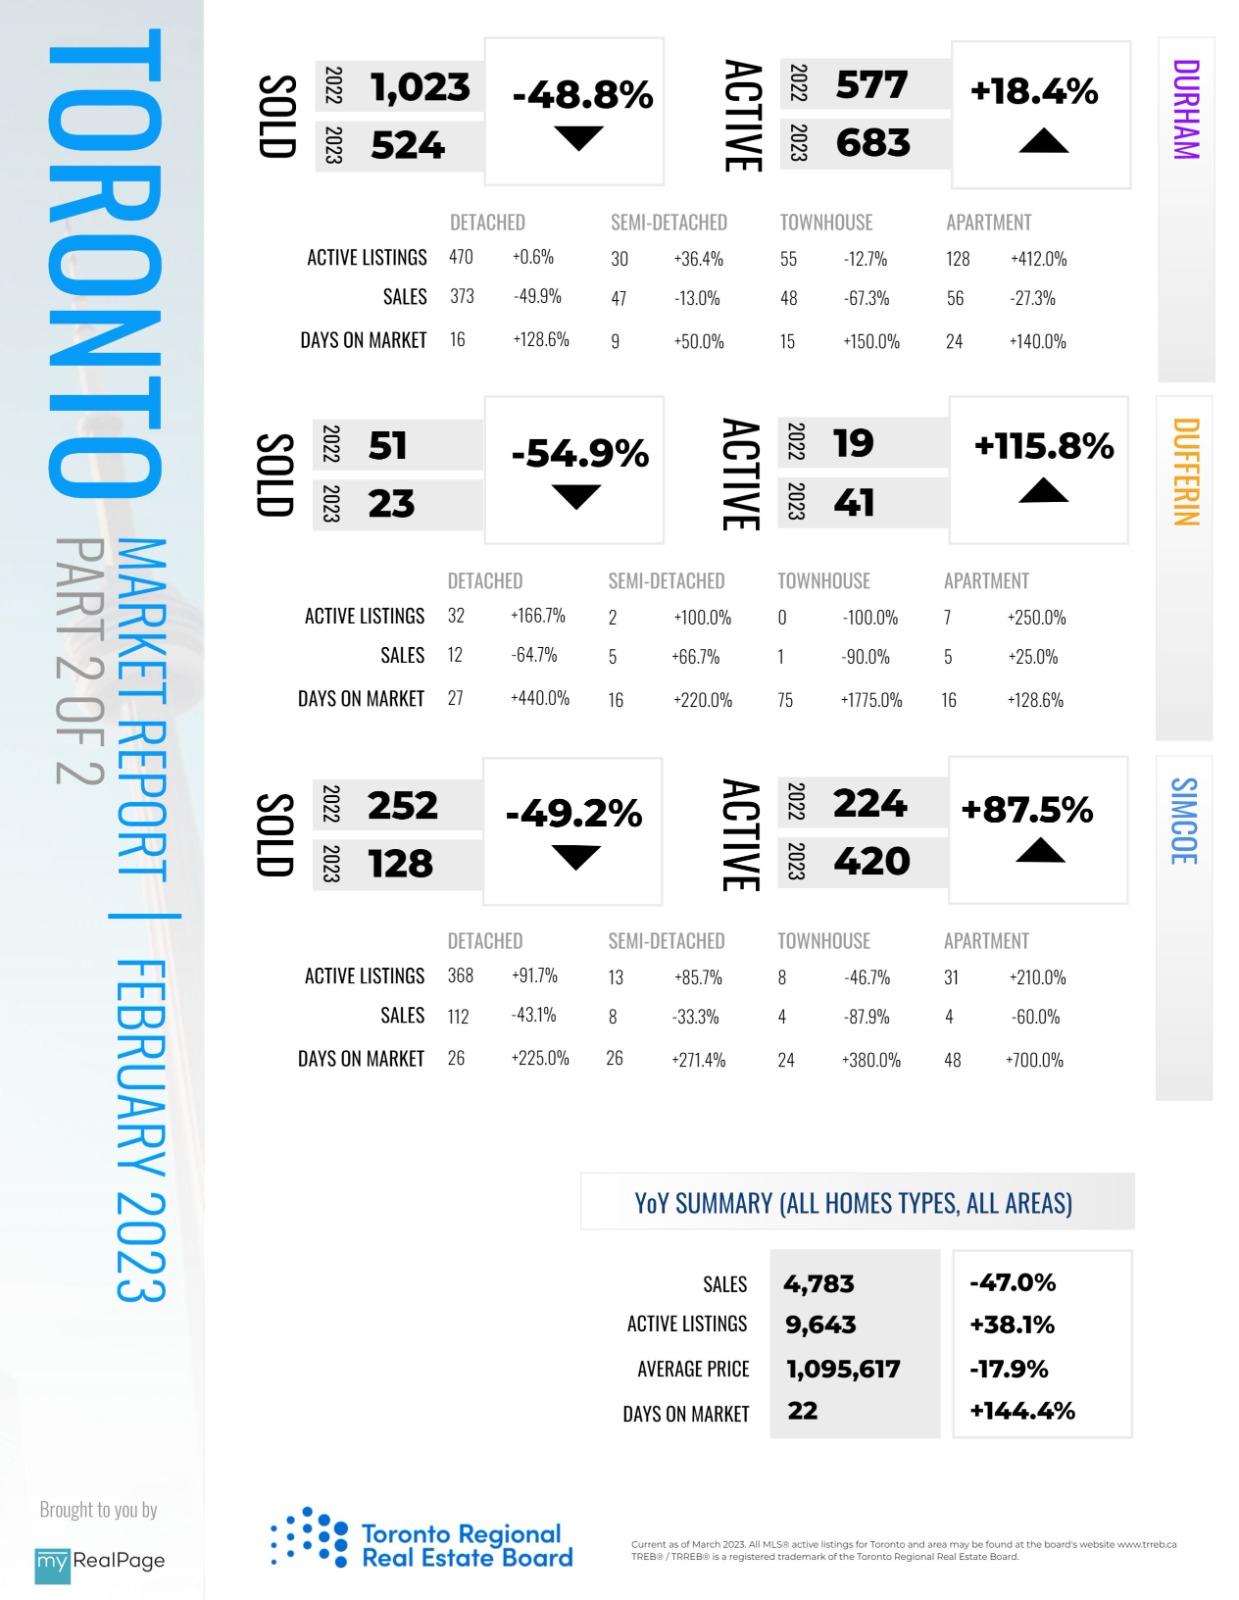
February sales in the Greater Toronto Area (GTA) were down substantially from the pre-rate hike levels of early 2022. However, the number of new listings also dropped substantially year-over-year. The result was that the average selling price and MLS® HPI continued to level off after trending lower through the spring and summer of last year.
“It has been almost a year since the Bank of Canada started raising interest rates. Home prices have dropped over the last year from the record peak in February 2022, mitigating the impact of higher borrowing costs. Many homebuyers have also decided to purchase a lower priced home to help offset higher borrowing costs. The share of home purchases below one million dollars is up substantially compared to this time last year,” said Toronto Regional Real Estate Board (TRREB) President Paul Baron.
GTA REALTORS® reported 4,783 sales through TRREB’s MLS® System in February 2023 – down 47 per cent compared to February 2022, the last full month before the onset of interest rate hikes. The number of new listings entered into the system was down by a similar annual rate of 40.9 per cent to 8,367.
Read the full report on TRREB website!
The following data is a comparison between February 2023 and February 2022 numbers, and is current as of March 2023. For last month’s numbers, check out our previous infographic!
Or follow this link for all our TREB / TRREB Infographics!
Download Printable Version – February 2023 TRREB, Toronto Market Report Part 1
Download Printable Version – February 2023 TRREB, Toronto Market Report Part 2
Last Updated on November 28, 2023 by myRealPage
