INFOGRAPHICS: July 2022 TRREB Toronto Market Reports

GTA Home Sales and Listings Trend Downwards in July
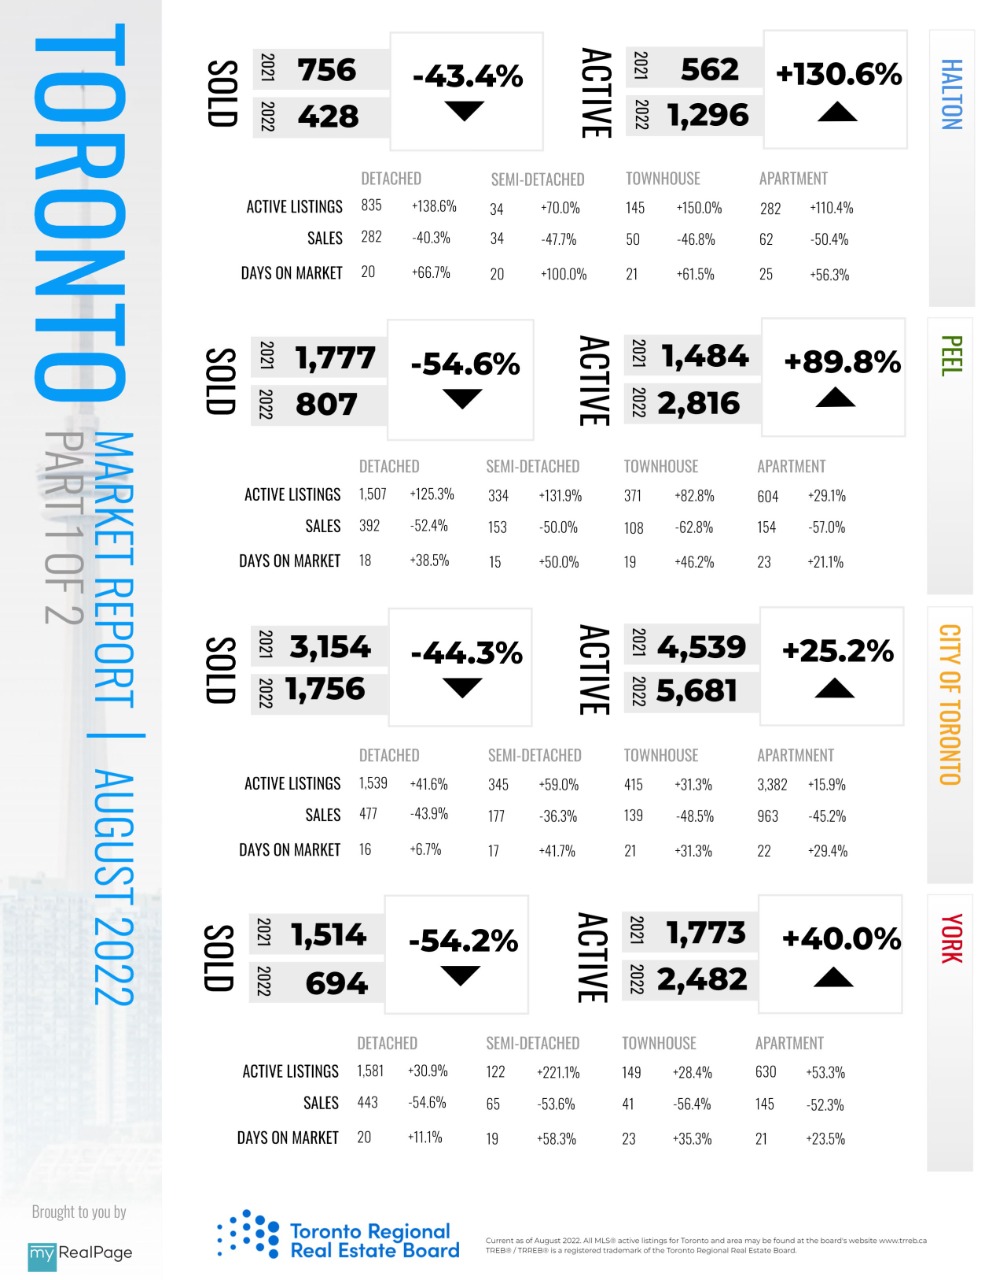
There were 4,912 home sales reported through the Toronto Regional Real Estate Board (TRREB) MLS® System in July 2022 – down by 47 per cent compared to July 2021. Following the regular seasonal trend, sales were also down compared to June.
New listings also declined on a year-over-year basis in July, albeit down by a more moderate four per cent. The expectation is that the trend for new listings will continue to follow the trend for sales, as we move through the second half of 2022 and into 2023.
Market conditions remained much more balanced in July 2022 compared to a year earlier. As buyers
continued to benefit from more choice, the annual rate of price growth has moderated. The MLS®
Home Price Index (HPI) Composite Benchmark was up by 12.9 per cent year-over-year. The average
selling price was up by 1.2 per cent compared to July 2021 to $1,074,754. Less expensive home types,
including condo apartments, experienced stronger rates of price growth as more buyers turned to these segments to help mitigate the impact of higher borrowing costs.
Read the full report on TRREB website!
The following data is a comparison between July 2022 and July 2021 numbers, and is current as of August 2022. For last month’s numbers, check out our previous infographic!
Or follow this link for all our TREB / TRREB Infographics!
Download Printable Version – June 2022 TRREB, Toronto Market Report Part 1
Download Printable Version – June 2022 TRREB, Toronto Market Report Part 2

Last Updated on November 28, 2023 by myRealPage
