INFOGRAPHICS: June 2022 TRREB Toronto Market Reports

GTA REALTORS® Release June Stats
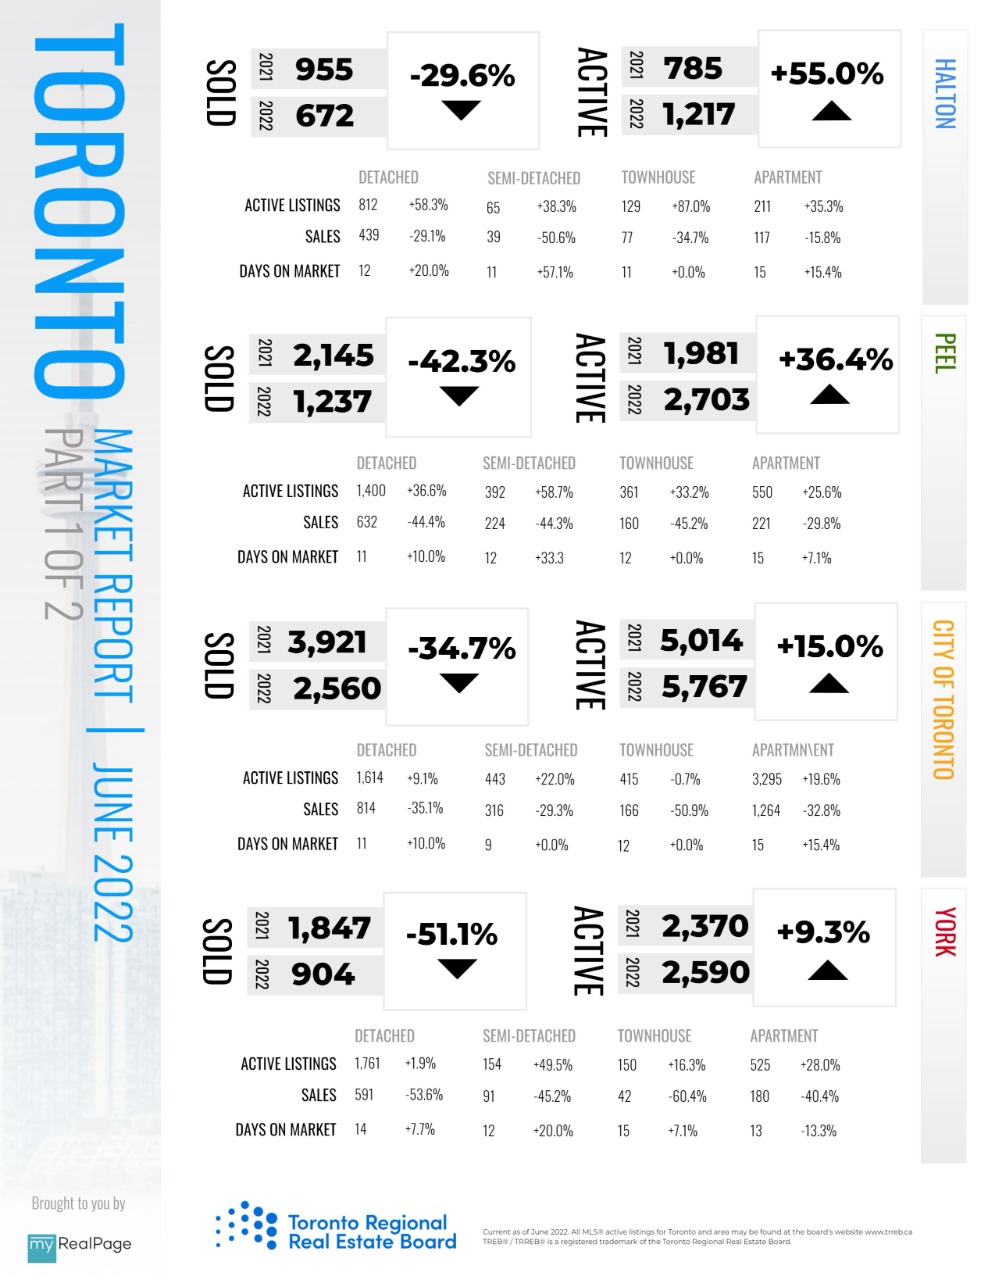
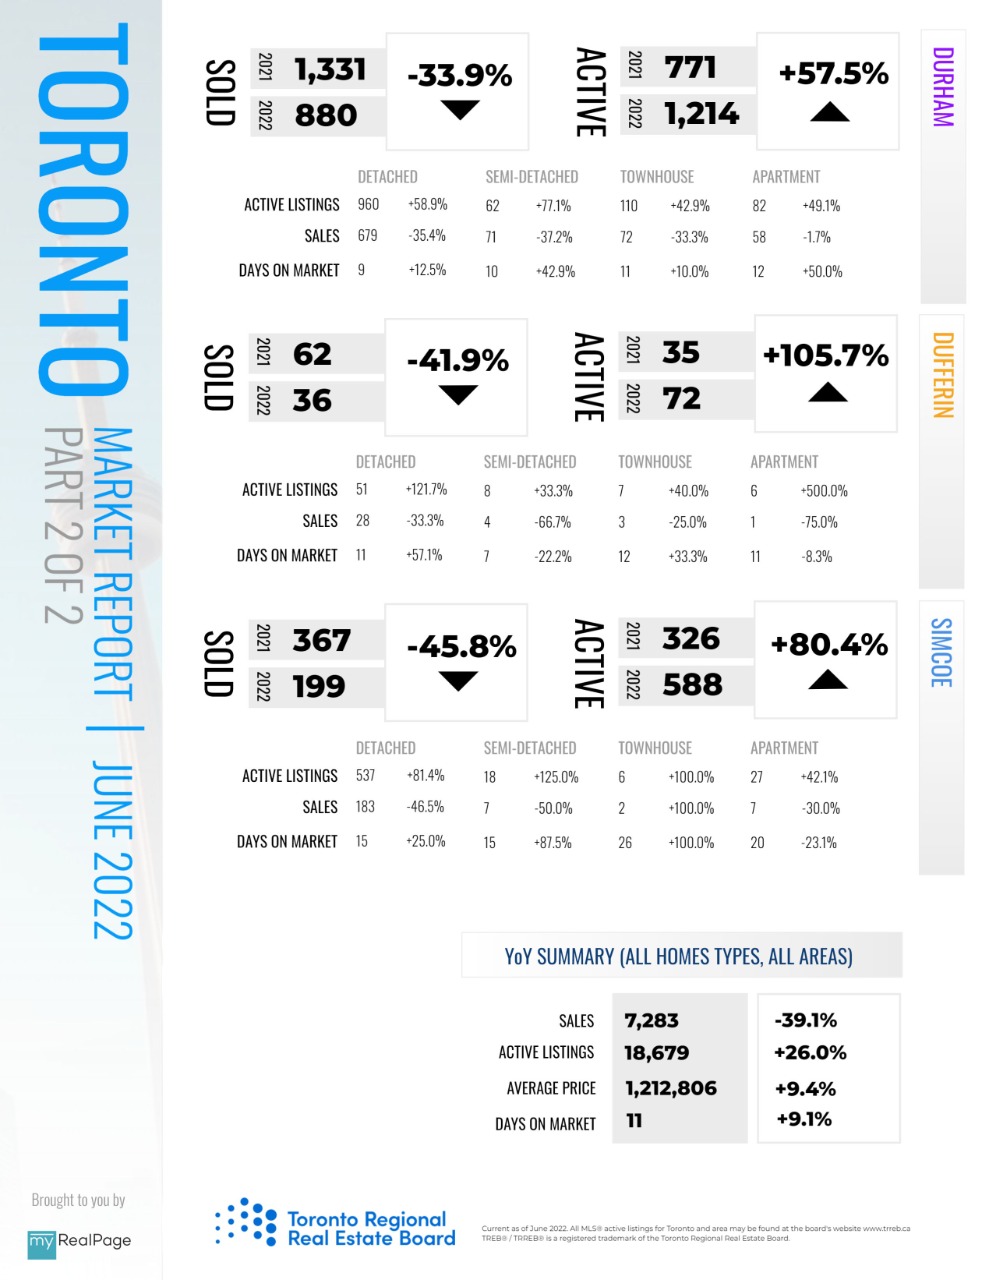
Higher borrowing costs continued to impact home sales in June 2022. Sales totalled 6,474 – down by 41 per cent compared to last year’s strong result. The number of transactions was also down compared to May 2022, but this is often the case due to the seasonal nature of the market.
The average selling price, at $1,146,254, remained 5.3 per cent above the June 2021 level, but continued to trend lower on a monthly basis. The MLS® Home Price Index Composite benchmark was up by 17.9 per cent year-over-year, but also experienced a month-over-month dip compared to May. Annual price growth was driven more so by less expensive market segments, including townhouses and condominium apartments.
Read the full report on TRREB website!
The following data is a comparison between June 2022 and June 2021 numbers, and is current as of July 2022. For last month’s numbers, check out our previous infographic!
Or follow this link for all our TREB / TRREB Infographics!
Download Printable Version – June 2022 TRREB, Toronto Market Report Part 1
Download Printable Version – June 2022 TRREB, Toronto Market Report Part 2
Last Updated on November 28, 2023 by myRealPage
