INFOGRAPHICS: May 2022 TRREB Toronto Market Reports

Market Continues to Balance out as Borrowing Costs Trend Higher
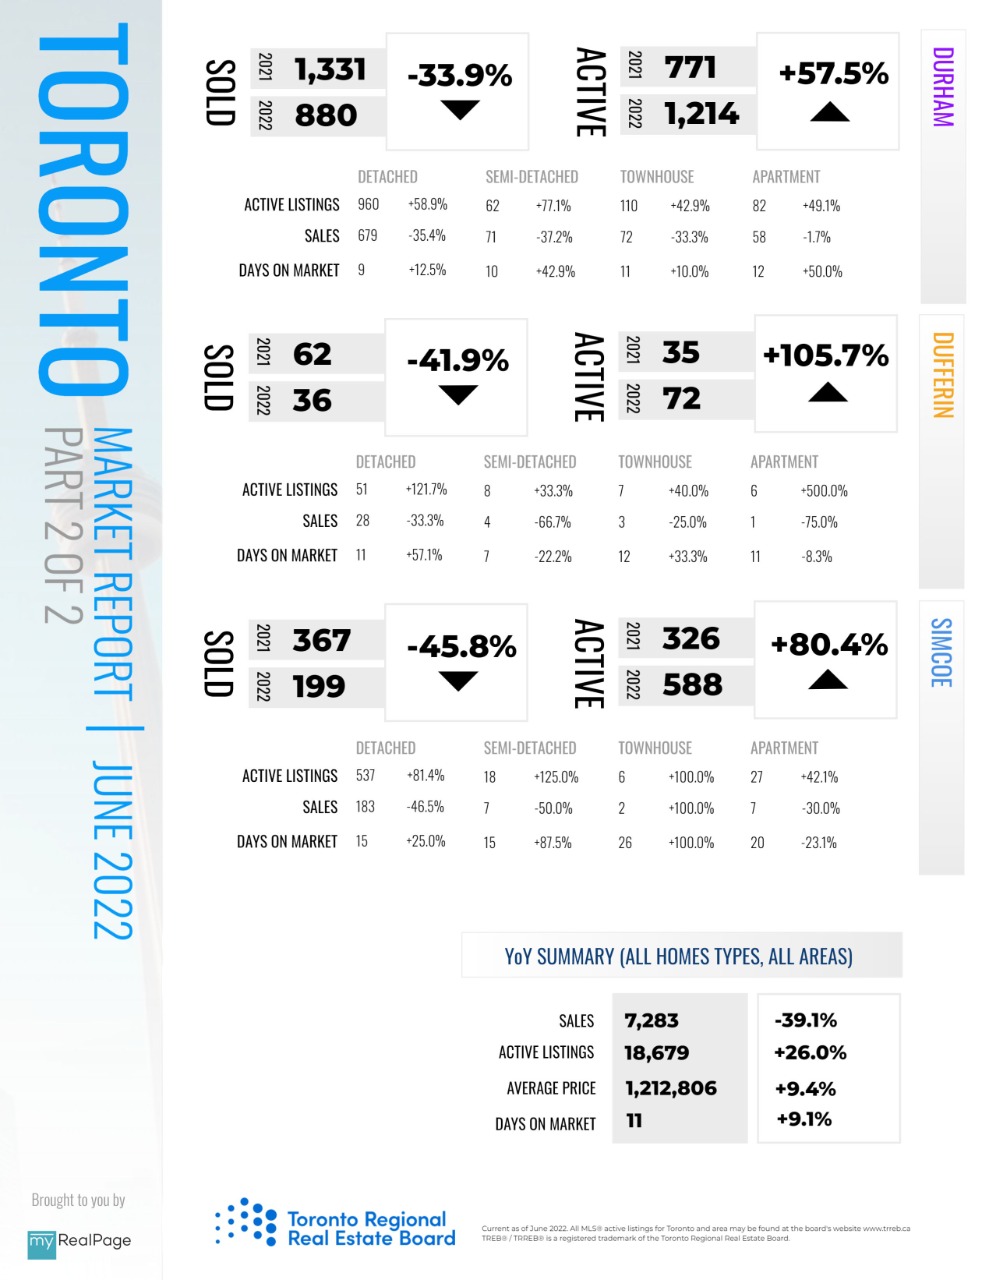
Greater Toronto Area (GTA) housing market conditions continued to evolve in response to higher borrowing costs. Similar to April results, May 2022 sales were down on a monthly and annual basis. Conversely, active listings at the end of May were up on a monthover-month and year-over-year basis. More balanced market conditions have provided buyers with more negotiating power. As a result, while benchmark and average home prices were up substantially compared to last year, selling prices trended lower on a month-over-month basis.
Read the full report on TRREB website!
The following data is a comparison between May 2022 and May 2021 numbers, and is current as of June 2022. For last month’s numbers, check out our previous infographic!
Or follow this link for all our TREB / TRREB Infographics!
Download Printable Version – May 2022 TRREB, Toronto Market Report Part 1
Download Printable Version – May 2022 TRREB, Toronto Market Report Part 2

Last Updated on November 28, 2023 by myRealPage
