INFOGRAPHICS: June 2019 REBGV Greater Vancouver Market Reports

July is here, and as always, here’s our monthly market update for areas covered by the Real Estate Board of Greater Vancouver (REBGV)!
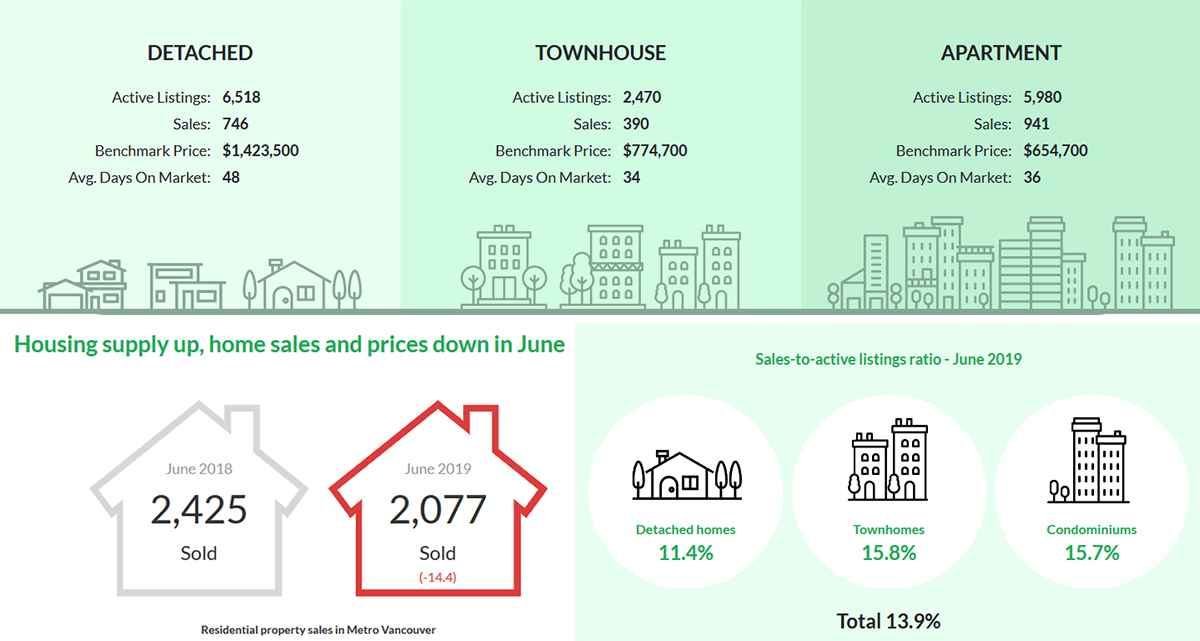
According to their most recent market update, housing supply is up, while home sales and prices are both down in June.
The Real Estate Board of Greater Vancouver (REBGV) reports that residential home sales in the region totalled 2,077 in June 2019, a 14.4% decrease from the 2,425 sales recorded in June 2018 and a 21.3% decrease from the 2,638 homes sold in May 2019.
Last month’s sales were 34.7% below the 10-year June sales average. This is the lowest total for the month since 2000.
As noted by REBGV President Ashley Smith,
“We’re continuing to see an expectation gap between home buyers and sellers in Metro Vancouver. Sellers are often trying to get yesterday’s values for their homes while buyers are taking a cautious, wait-and-see approach. Home buyers haven’t had this much selection to choose from in five years. For sellers to be successful in today’s market, it’s important to work with your local REALTOR® to make sure you’re pricing your home for these conditions.”
On the supply side, there were 4,751 detached, attached and apartment properties newly listed for sale on the Multiple Listing Service® (MLS®) in Metro Vancouver in June 2019. This represents a 10% decrease compared to the 5,279 homes listed in June 2018 and an 18.9% decrease compared to May 2019 when 5,861 homes were listed.
Generally, analysts say that downward pressure on home prices occurs when the ratio dips below 12% for a sustained period, while home prices often experience upward pressure when it surpasses 20% over several months.
The following data is a comparison between June 2018 and June 2019 numbers, and is current as of July 2019. For last month’s update, you can check out our previous post for May 2019 data.
Or follow this link for all our REBGV Infographics!
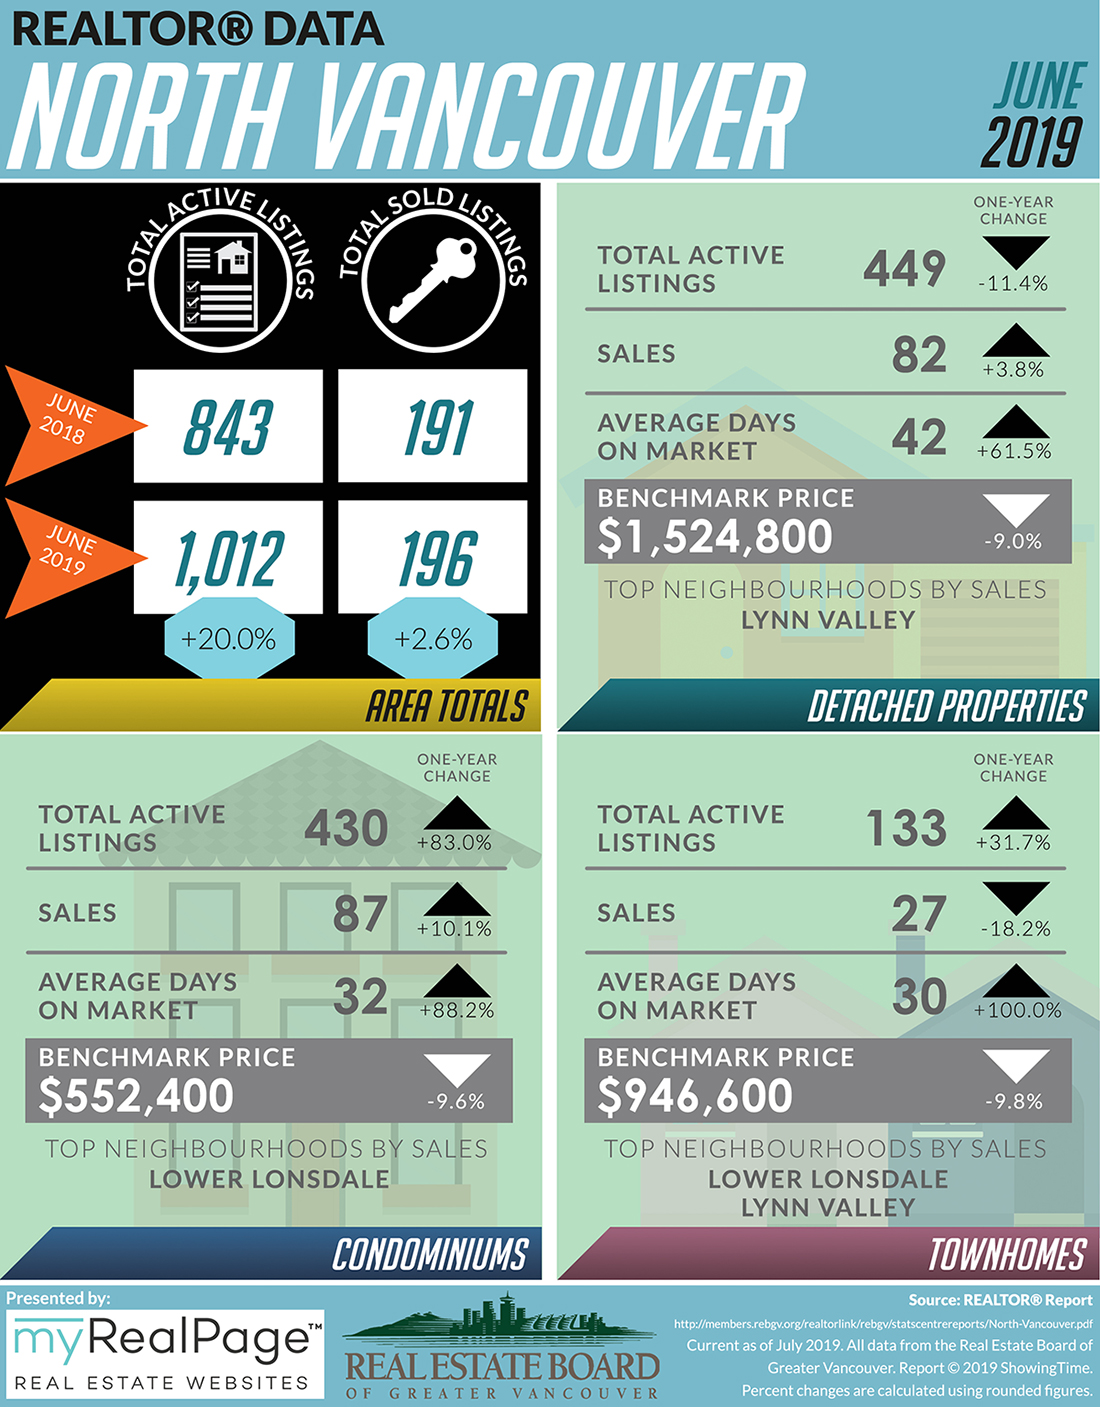
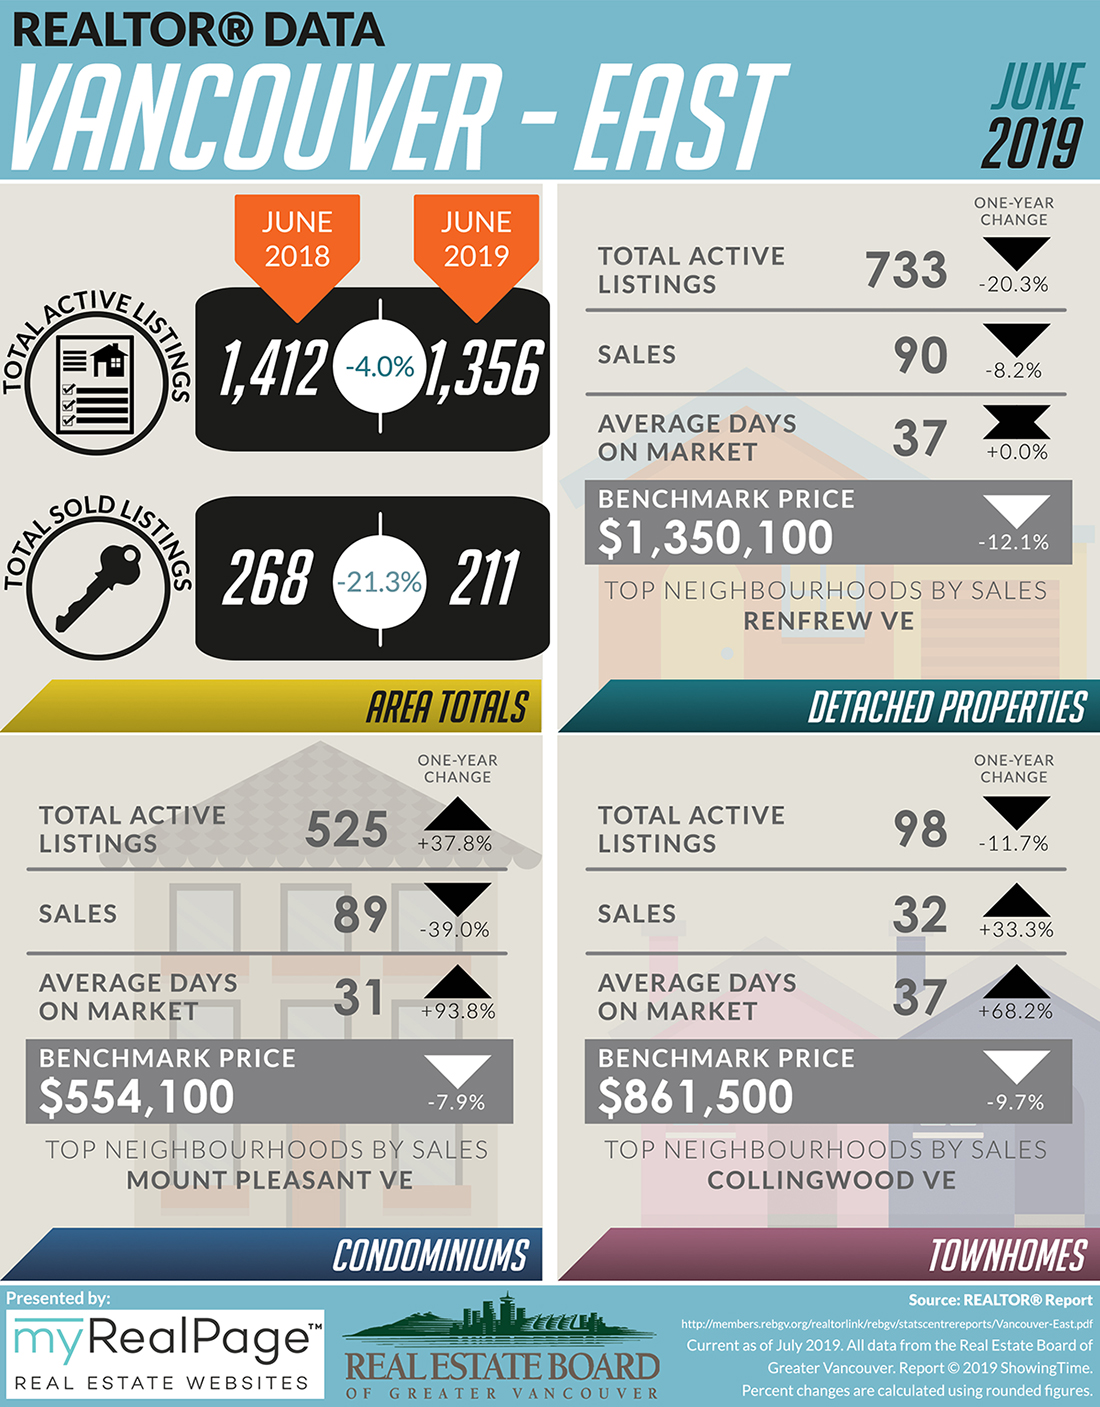
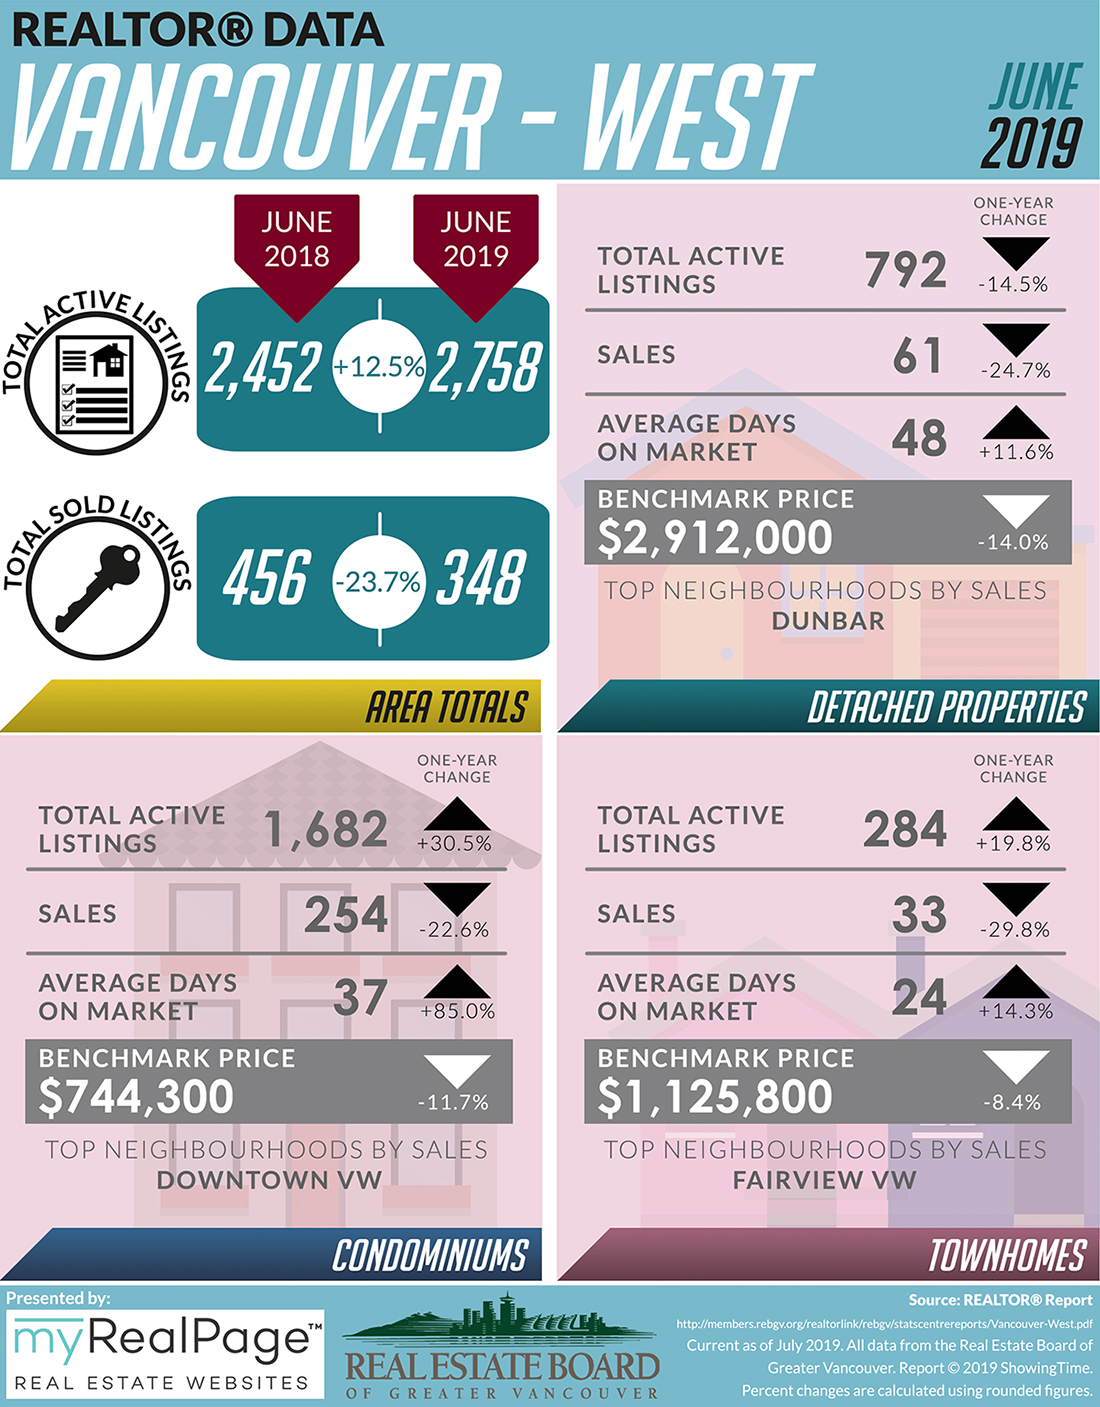
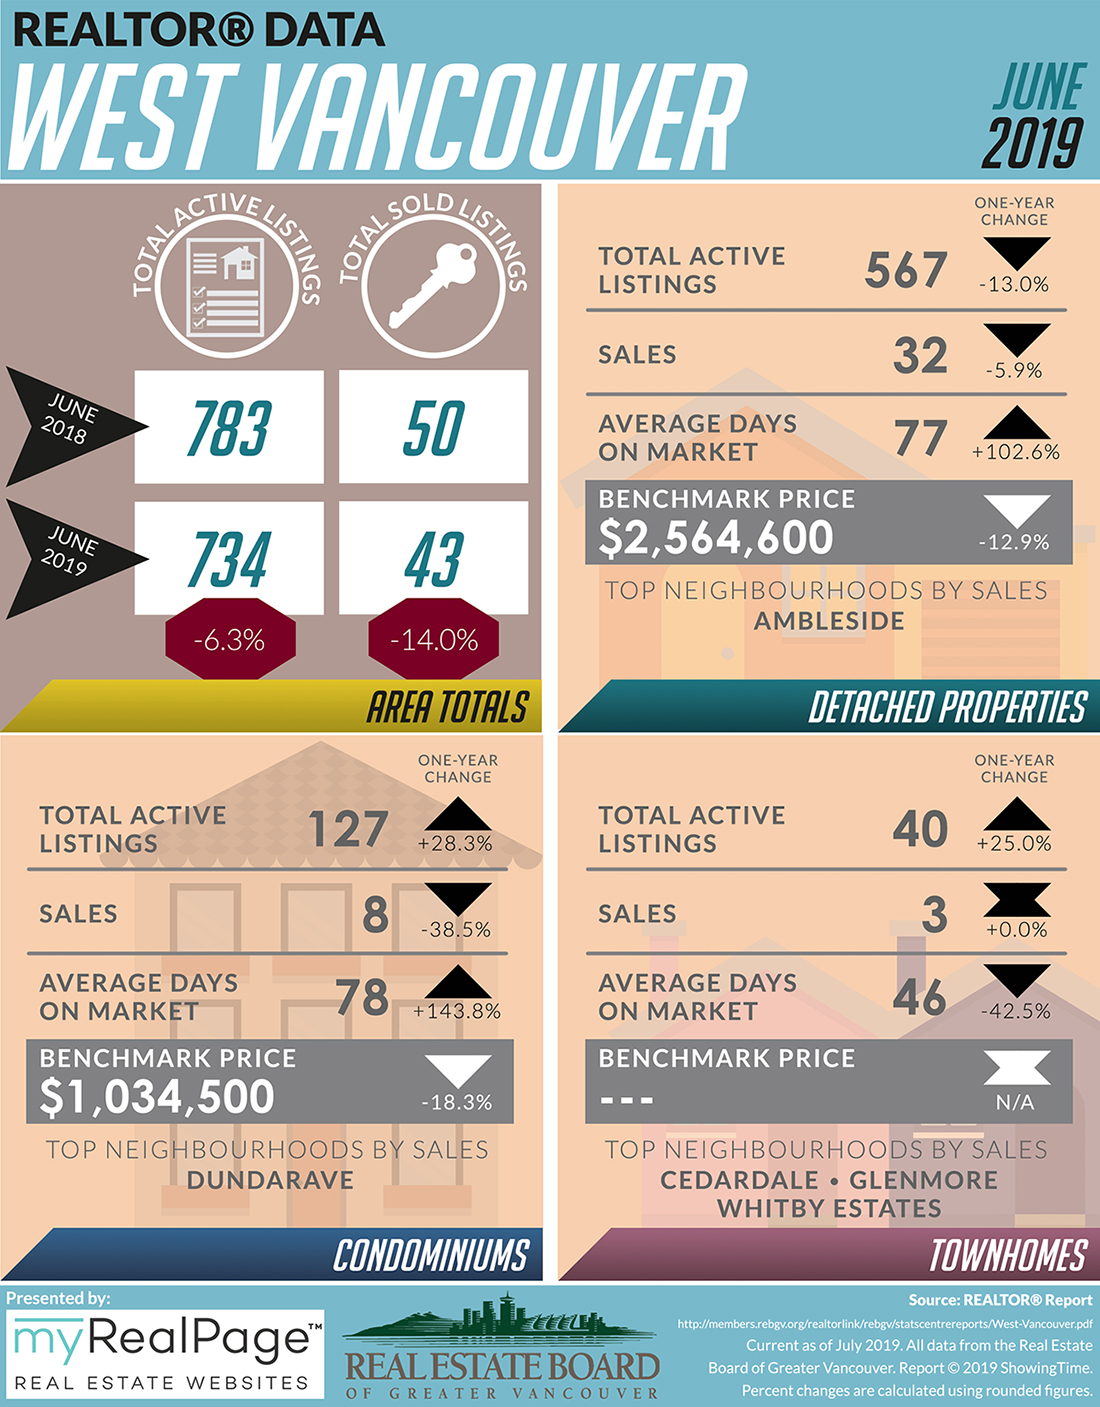
These infographics cover current trends in North Vancouver, West Vancouver, Vancouver East, and Vancouver West.
Click on the images for a larger view!
(Protip: Make sure to grab the printable PDF versions, too! It fits best when printed on A4-sized sheets, AND we’ve added an area on the sheet where you can attach your business card! 🙂 )
Download Printable Version – REBGV June 2019 Data Infographics
(Image Source: REBGV.org)
