INFOGRAPHICS: March 2021 CREB City And Region Market Reports

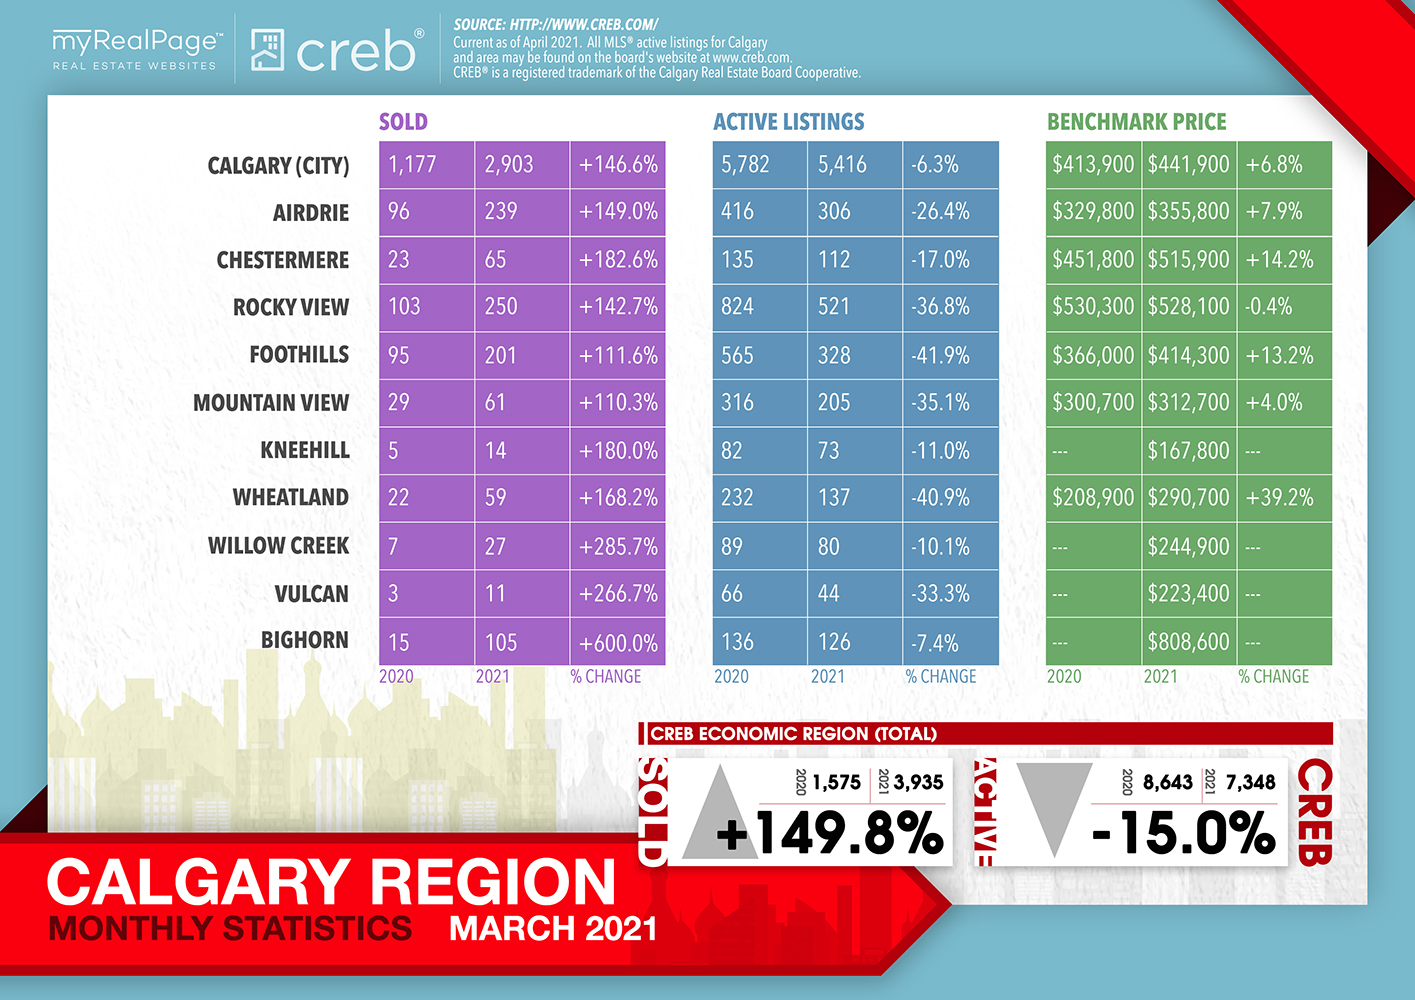
Calgary housing market sees best March sales in over a decade
The initial impact of COVID-19 on the housing market began last March.
One year later, it is not a surprise that March sales in 2021 were higher than in 2020. However, at 2,903 sales, this was the highest March total since 2007.
“Low lending rates and improved savings have supported sales activity,” said CREB® chief economist Ann-Marie Lurie.
“However, sales have been somewhat restricted by the lack of listings. This month there was a jump in new listings, contributing to the strong monthly sales.”
Read the full report on the CREB website!
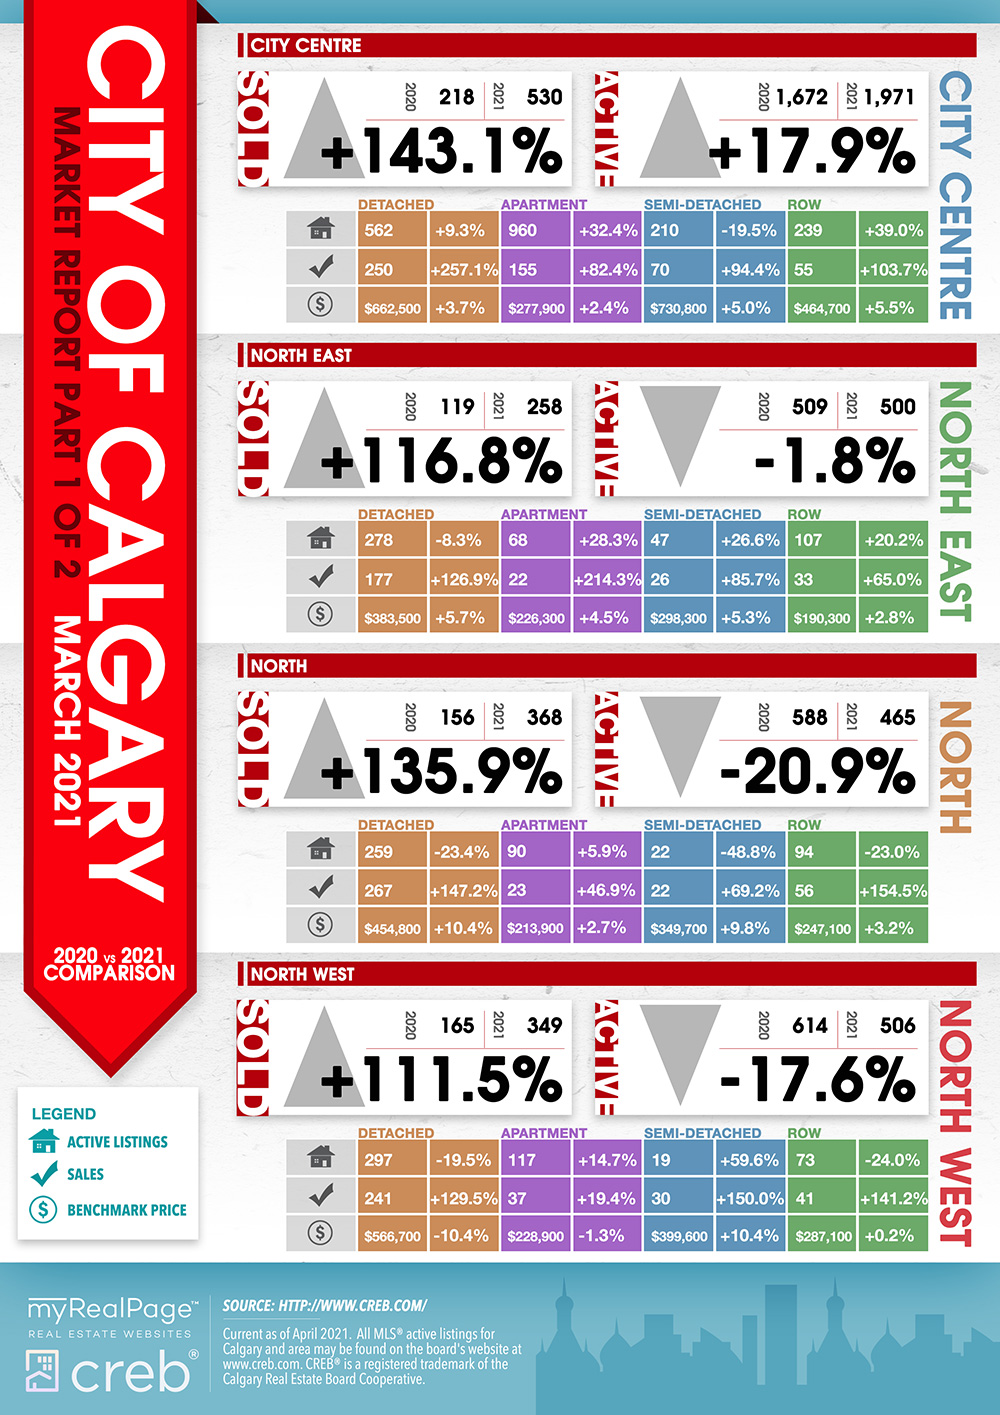
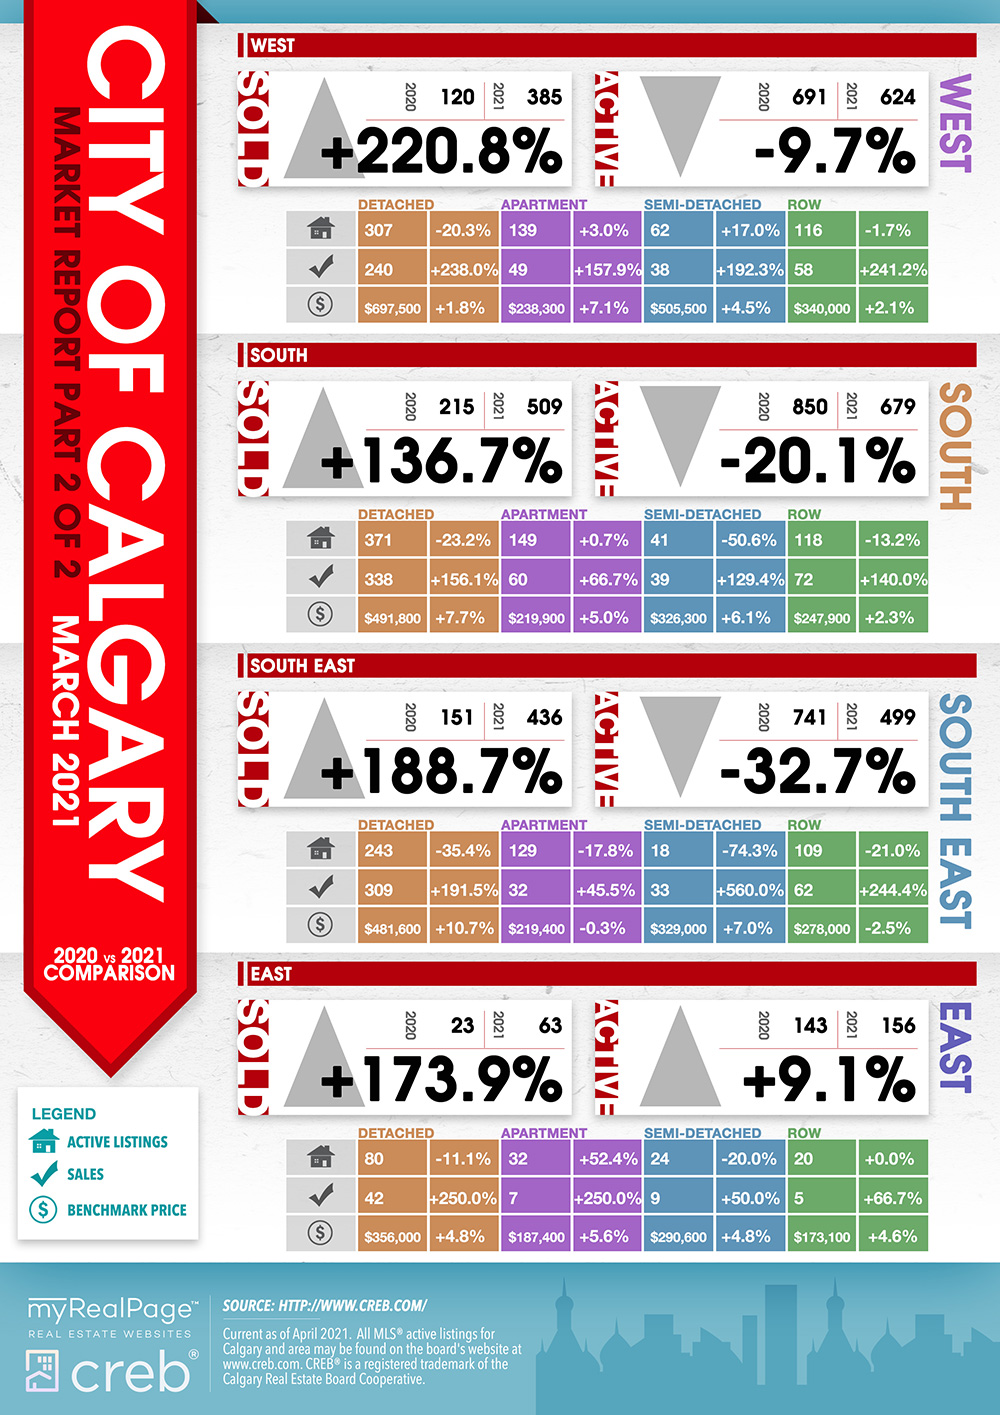
The following data is a comparison between March 2020 and March 2021 numbers, and is current as of April 2021. For last month’s numbers, check out our previous infographic.
Or follow this link for all our CREB Infographics!
Click on the images for a larger view! (Protip: Make sure to grab the printable PDF versions, too! It fits best when printed on A4-sized sheets, AND we’ve added an area on the sheet where you can attach your business card! 🙂 )
Download Printable Version – March 2021 CREB, City of Calgary Report
Download Printable Version – March 2021 CREB, Calgary Region Report
Last Updated on July 25, 2022 by myRealPage
