INFOGRAPHICS: May 2020 FVREB Fraser Valley, South Surrey, Etc. Market Reports

Housing market activity picks up in the Fraser Valley as buyers and sellers adapt to the new environment.
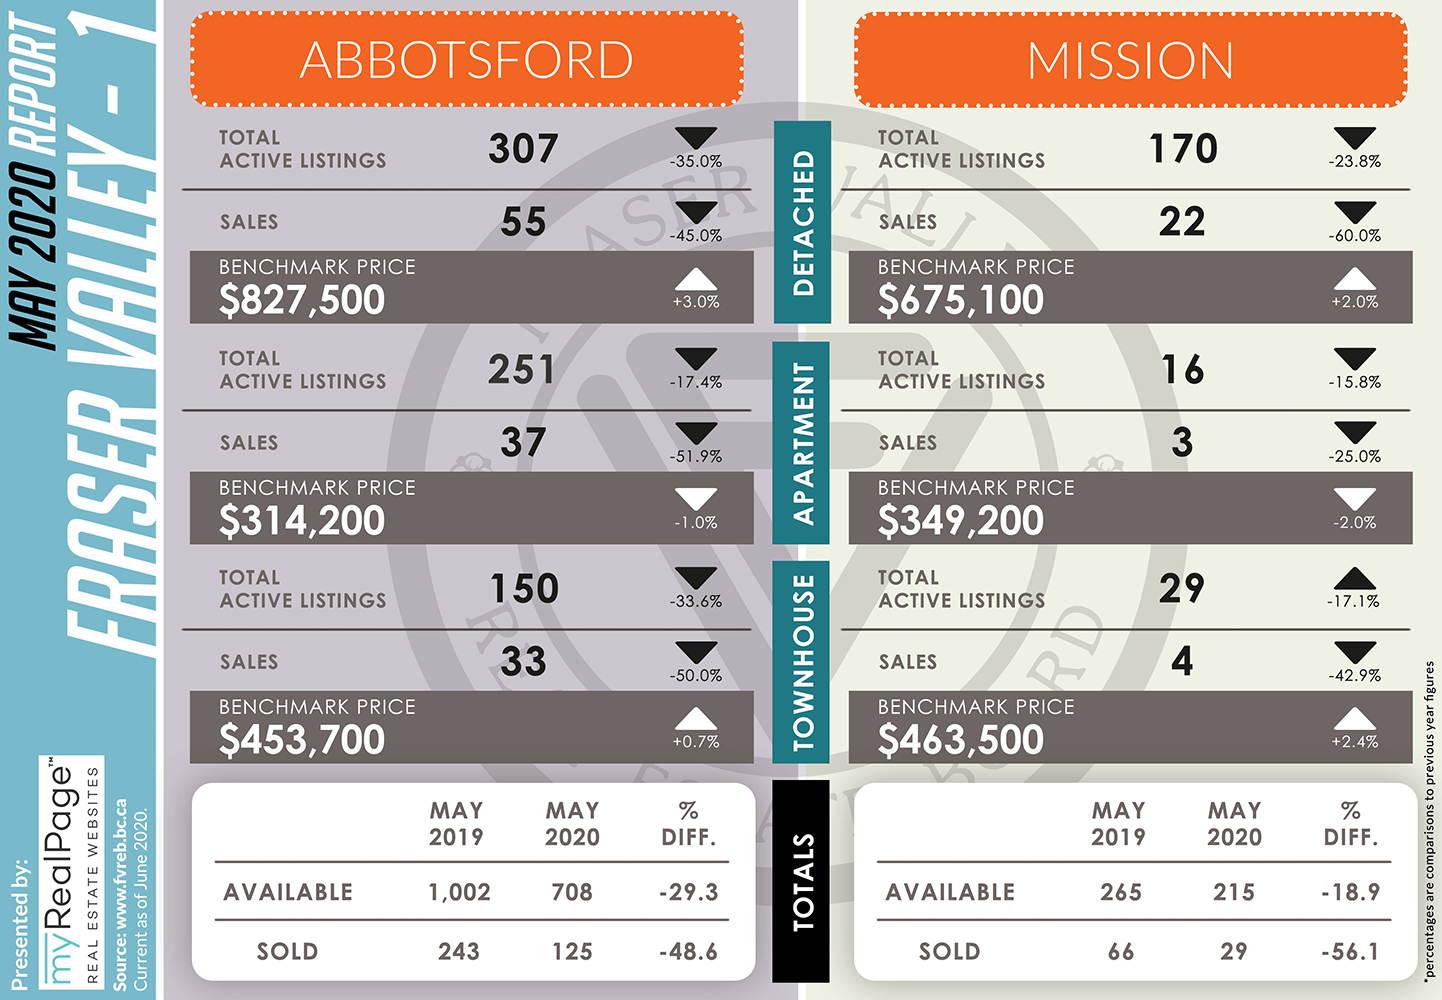
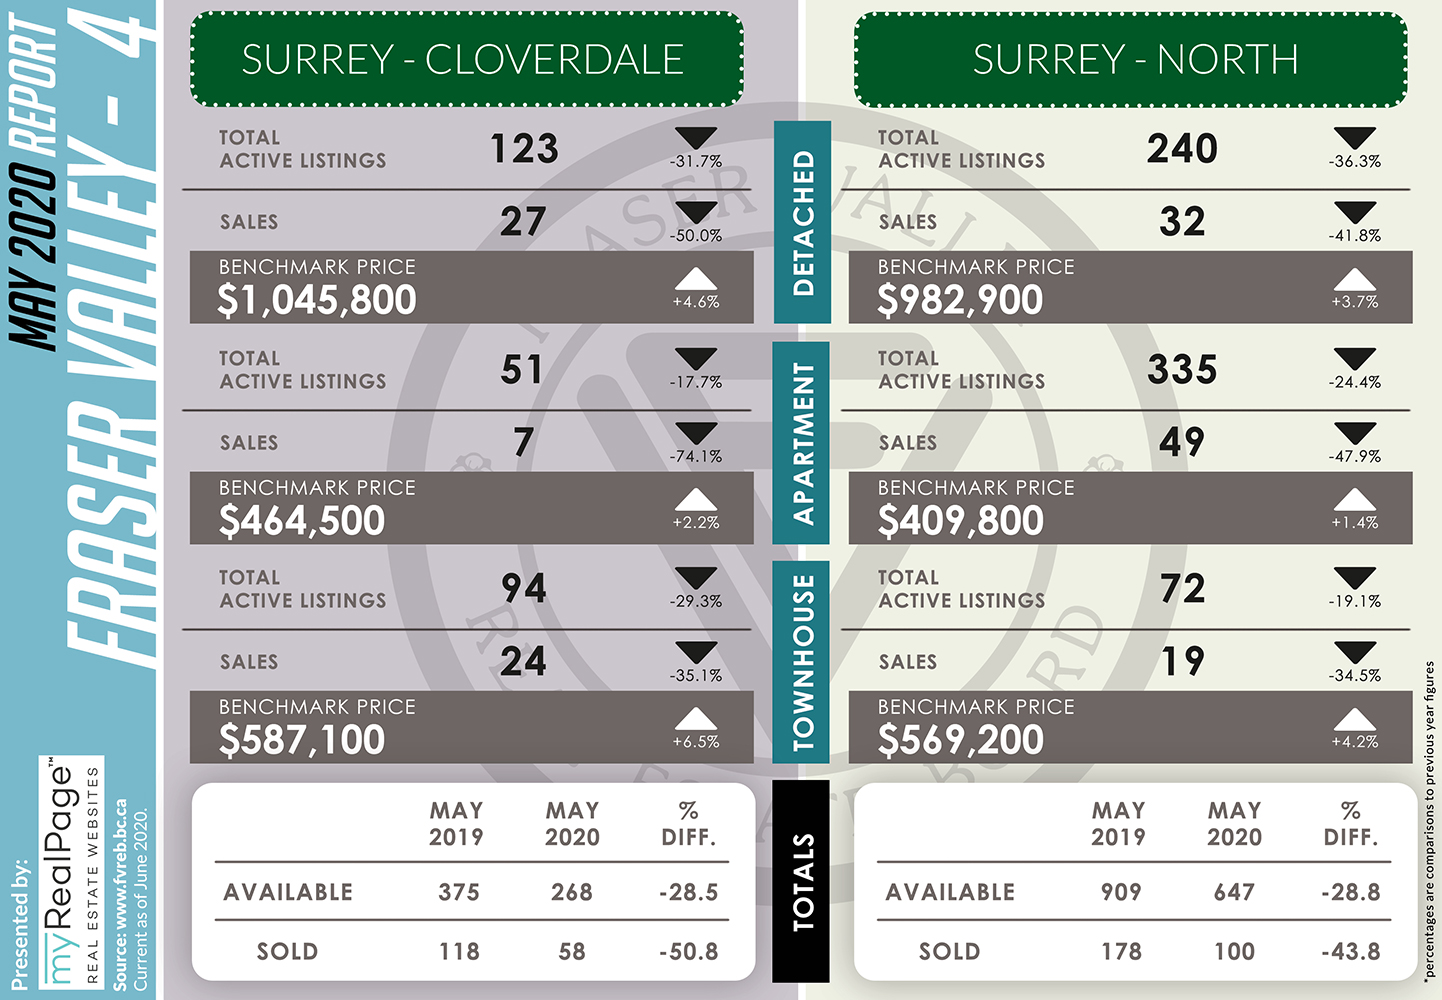
In May, Fraser Valley listings and property sales started to bounce back as REALTORS® helped their clients adjust to the new, necessary safety measures required to buy and sell a home during the provincial state of emergency due to COVID-19.
The Fraser Valley Real Estate Board (FVREB) processed a total of 805 sales on its Multiple Listing Service® (MLS®) in May, an increase of 17% compared to sales in April and a decrease of 47% compared to the 1,517 sales during May of last year.
Read the full report on the FVREB website.
The following data is a comparison between May 2019 and May 2020 numbers, and is current as of June 2020. For last month’s report, check out our previous infographic!
Or follow this link for all our FVREB Infographics!
These infographics cover current trends in Fraser Valley neighbourhoods that are within the FVREB. Click on the images for a larger view! (Protip: Make sure to grab the printable PDF version, too! It fits best when printed on A4-sized sheets, AND we’ve added an area on the sheet where you can attach your business card! 🙂 )
Download Printable Version – FVREB May 2020 Market Report


Last Updated on July 25, 2022 by myRealPage
