INFOGRAPHICS: May 2023 TRREB Toronto Market Reports

GTA REALTORS® Release May Stats
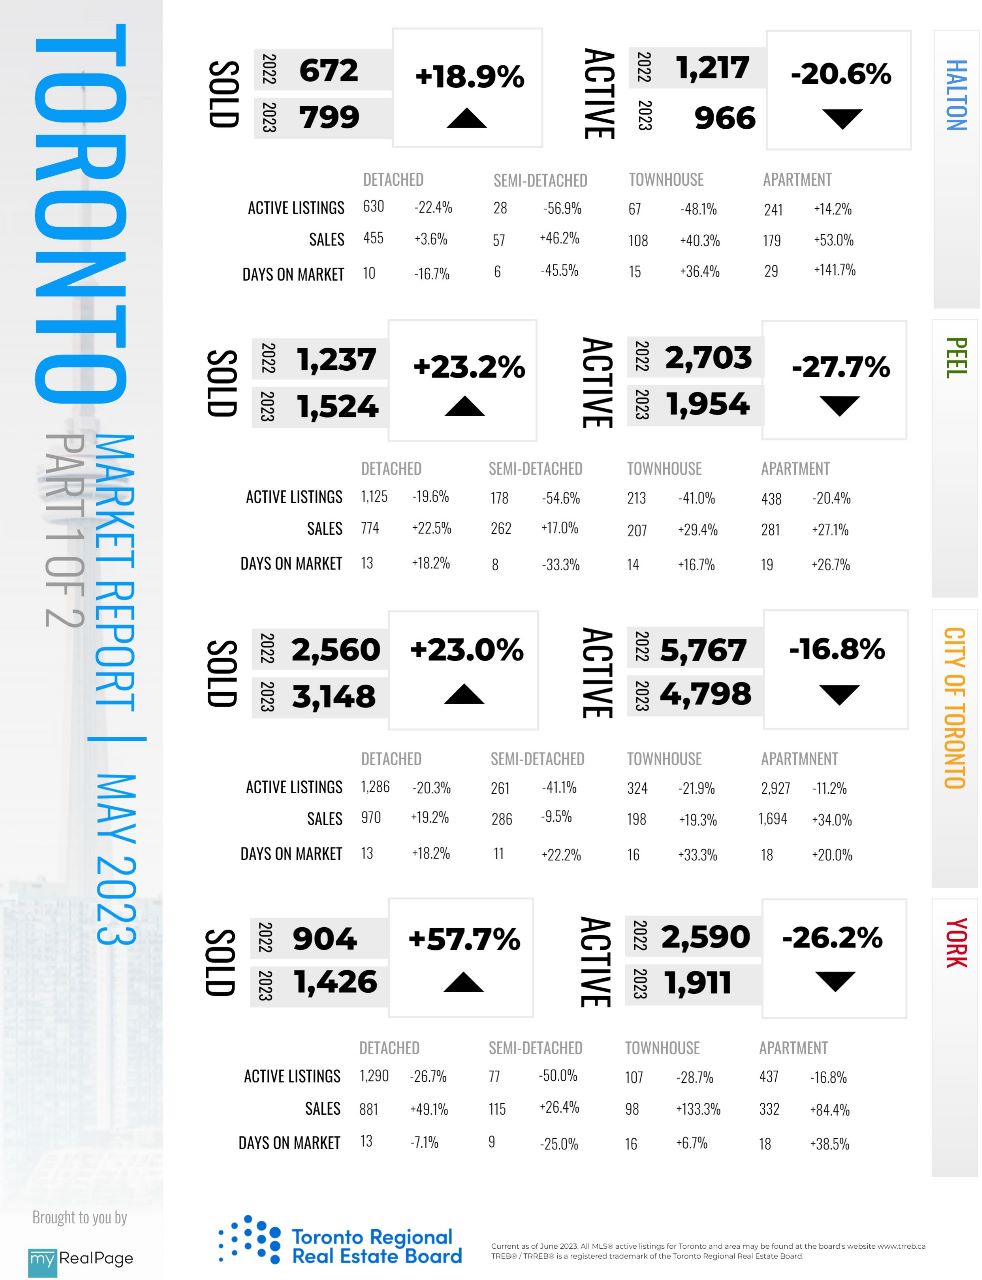
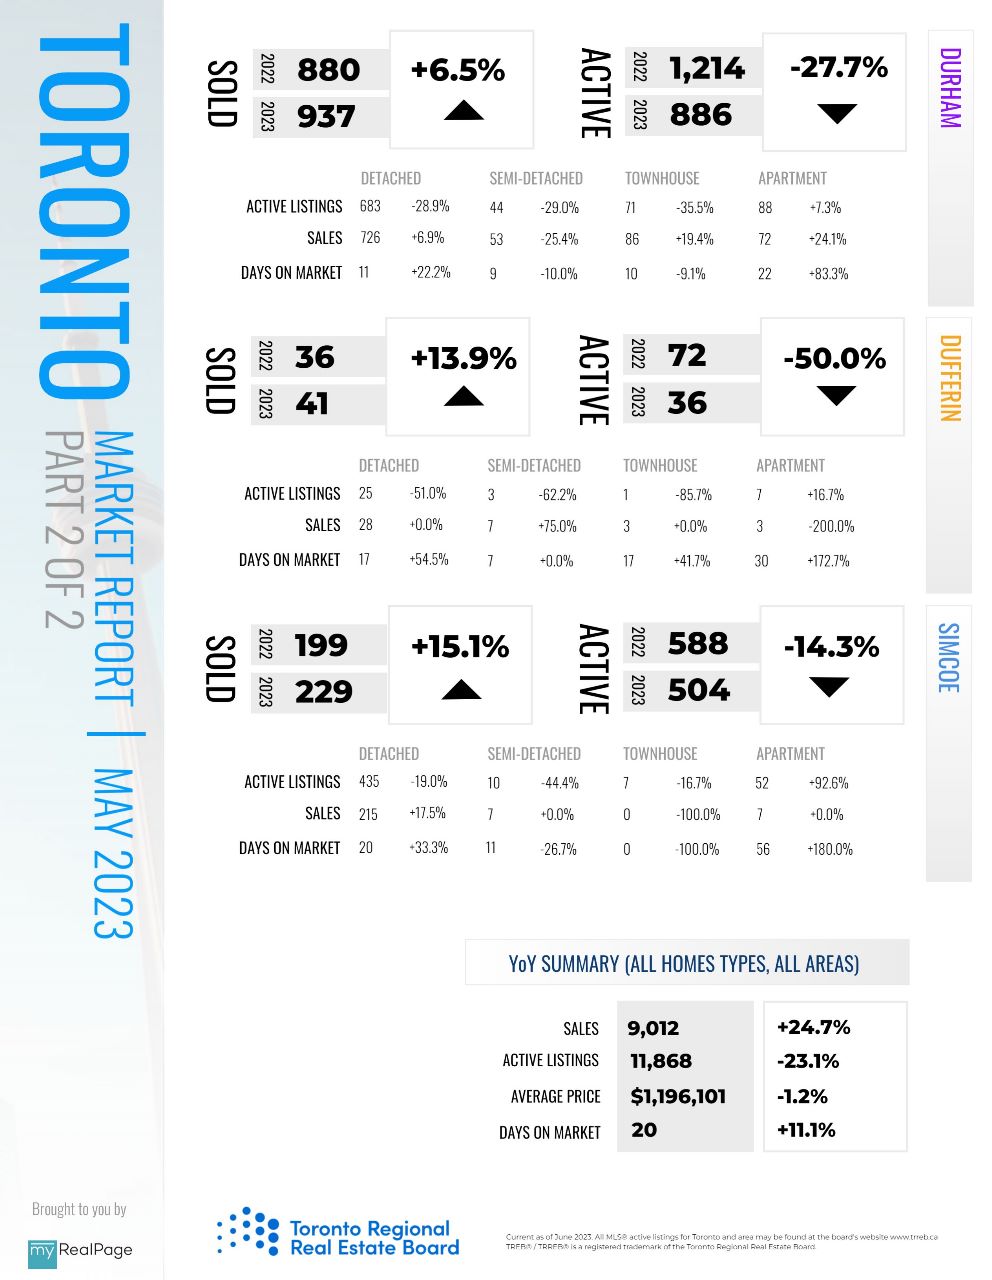
The Greater Toronto Area (GTA) housing market continued to improve from a sales perspective in May 2023. Unfortunately, the supply of homes for sale did not keep up with the demand for ownership housing. Sales as a share of new listings were up dramatically compared to a year ago. This is a clear signal that competition between buyers increased substantially compared to last year, resulting in the average selling price reaching almost $1.2 million last month.
“Despite the fact that we have seen positive policy direction over the last couple of years, governments have been failing on the housing supply front for some time. Recent polling from Ipsos found that City of Toronto residents gave Council a failing grade on housing affordability and pointed to lack of supply as the major issue. This issue is not unique to Toronto. It persists throughout the Greater Golden Horseshoe. If we don’t quickly see housing supply catch up to population growth, the economic development of our region will be hampered as people and businesses look elsewhere to live and invest,” said Toronto Regional Real Estate Board (TRREB) President Paul Baron.
GTA REALTORS® reported 9,012 sales through TRREB’s MLS® System in May 2023 – a 24.7 per cent increase compared to May 2022. Conversely, new listings were down by 18.7 per cent over the same period. On a month-over-month seasonally adjusted basis, sales were up by 5.2 per cent compared to April 2023.
“The demand for ownership housing has picked up markedly in recent months. Many homebuyers have recalibrated their housing needs in the face of higher borrowing costs and are moving back into the market. In addition, strong rent growth and record population growth on the back of immigration has also supported increased home sales. The supply of listings hasn’t kept up with sales, so we have seen upward pressure on selling prices during the spring,” said TRREB Chief Market Analyst Jason Mercer.
Read the full report on TRREB website!
The following data is a comparison between May 2023 and May 2022 numbers, and is current as of June 2023. For last month’s numbers, check out our previous infographic!
Or follow this link for all our TREB / TRREB Infographics!
Download Printable Version – May 2023 TRREB, Toronto Market Report Part 1
Download Printable Version – May 2023 TRREB, Toronto Market Report Part 2
Last Updated on November 28, 2023 by myRealPage
