INFOGRAPHICS: October 2020 REBGV Greater Vancouver Market Reports

Home sale and listing resurgence extends into the fall
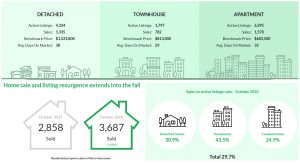
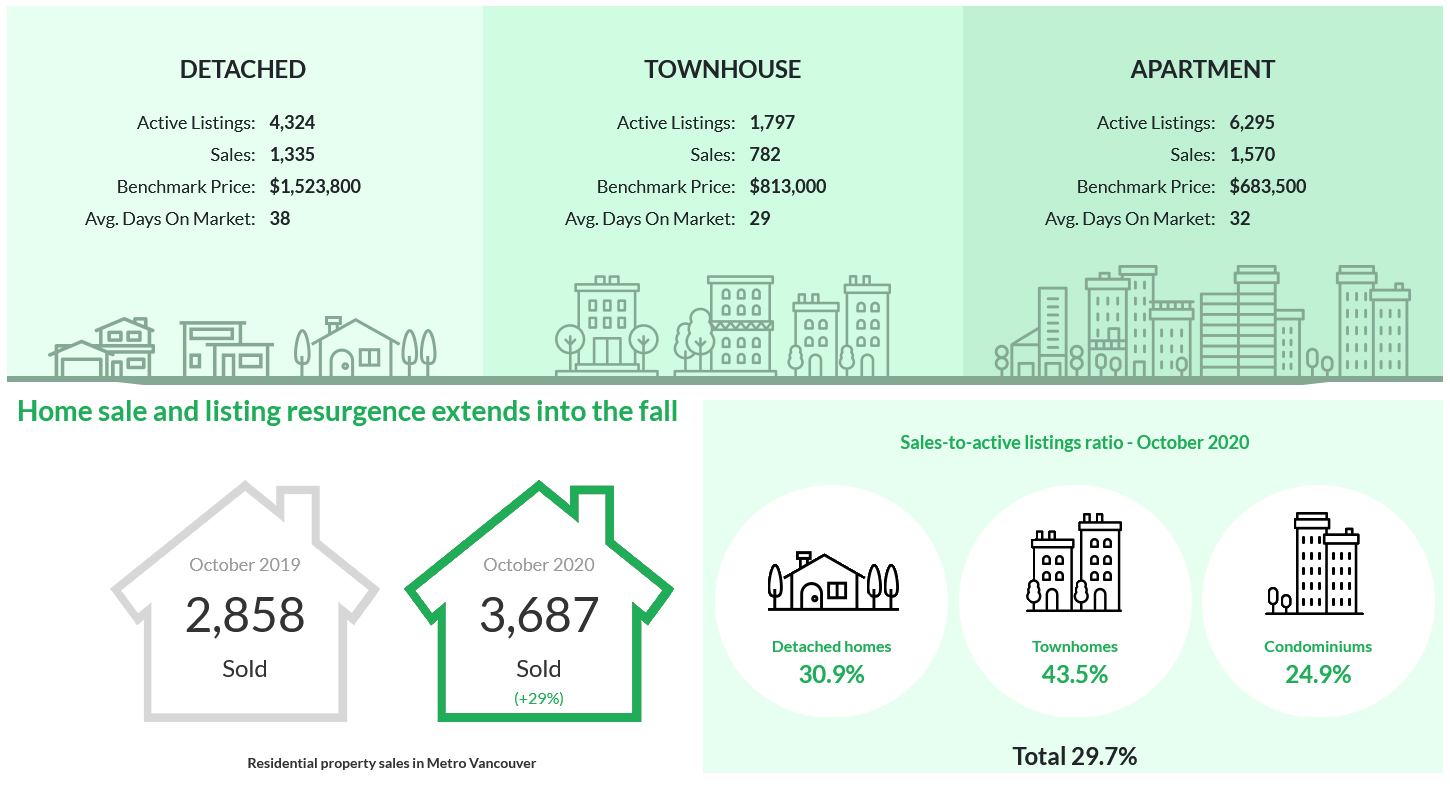
Home sale and new listing activity remained at near record levels across Metro Vancouver in October.
The Real Estate Board of Greater Vancouver (REBGV) reports that residential home sales in the region totalled 3,687 in October 2020, a 29% increase from the 2,858 sales recorded in October 2019, and a 1.2% increase from the 3,643 homes sold in September 2020.
Last month’s sales were 34.7% above the 10-year October sales average and stands as the second-highest total on record for the month.
Read the full report on the REBGV website.
The following data is a comparison between October 2019 and October 2020 numbers, and is current as of November 2020. For last month’s update, you can check out our previous post for September 2020 data.
Or follow this link for all our REBGV Infographics!
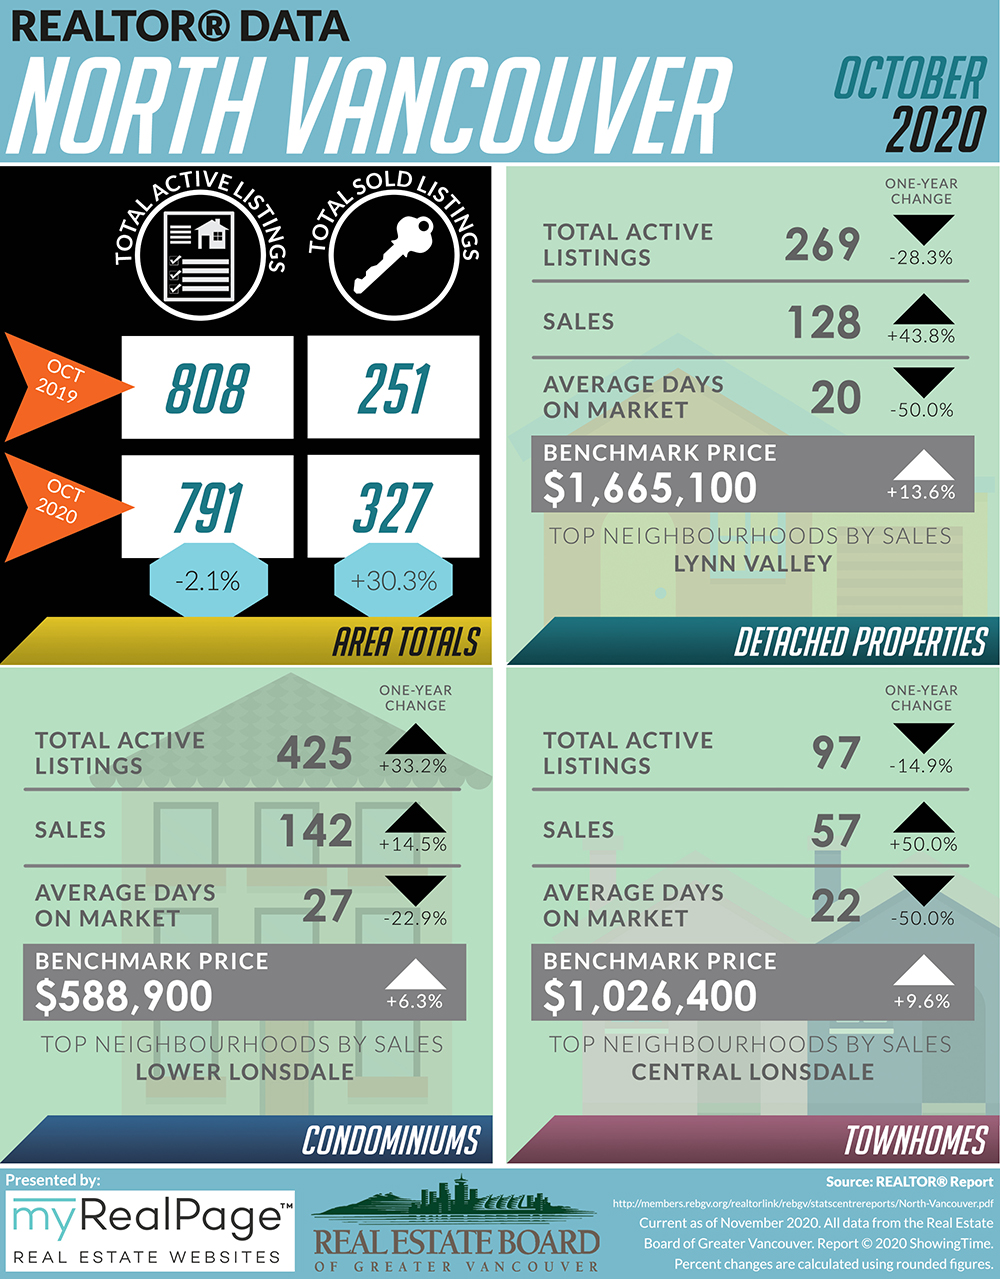
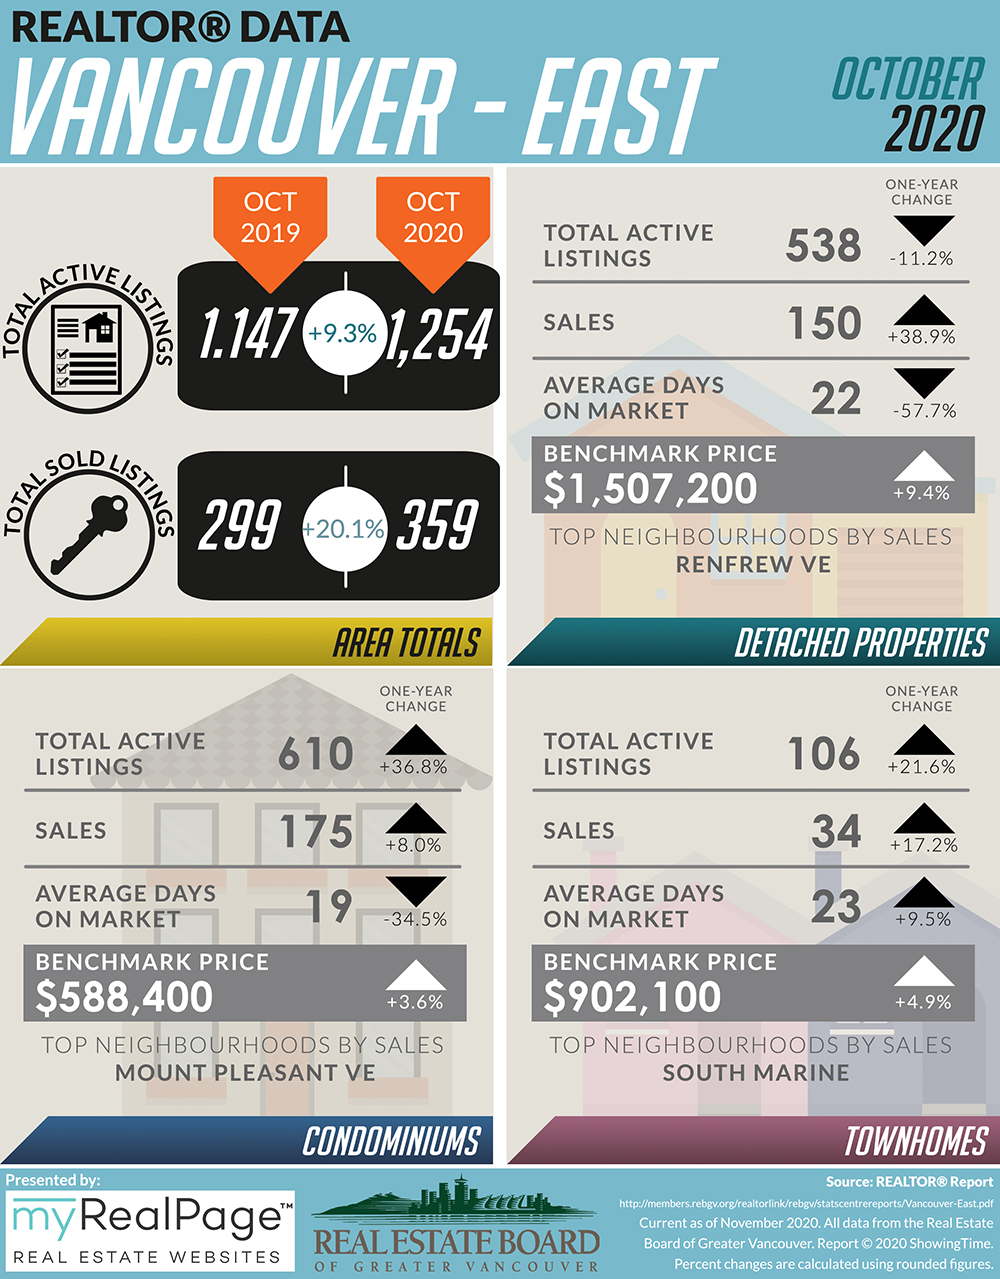
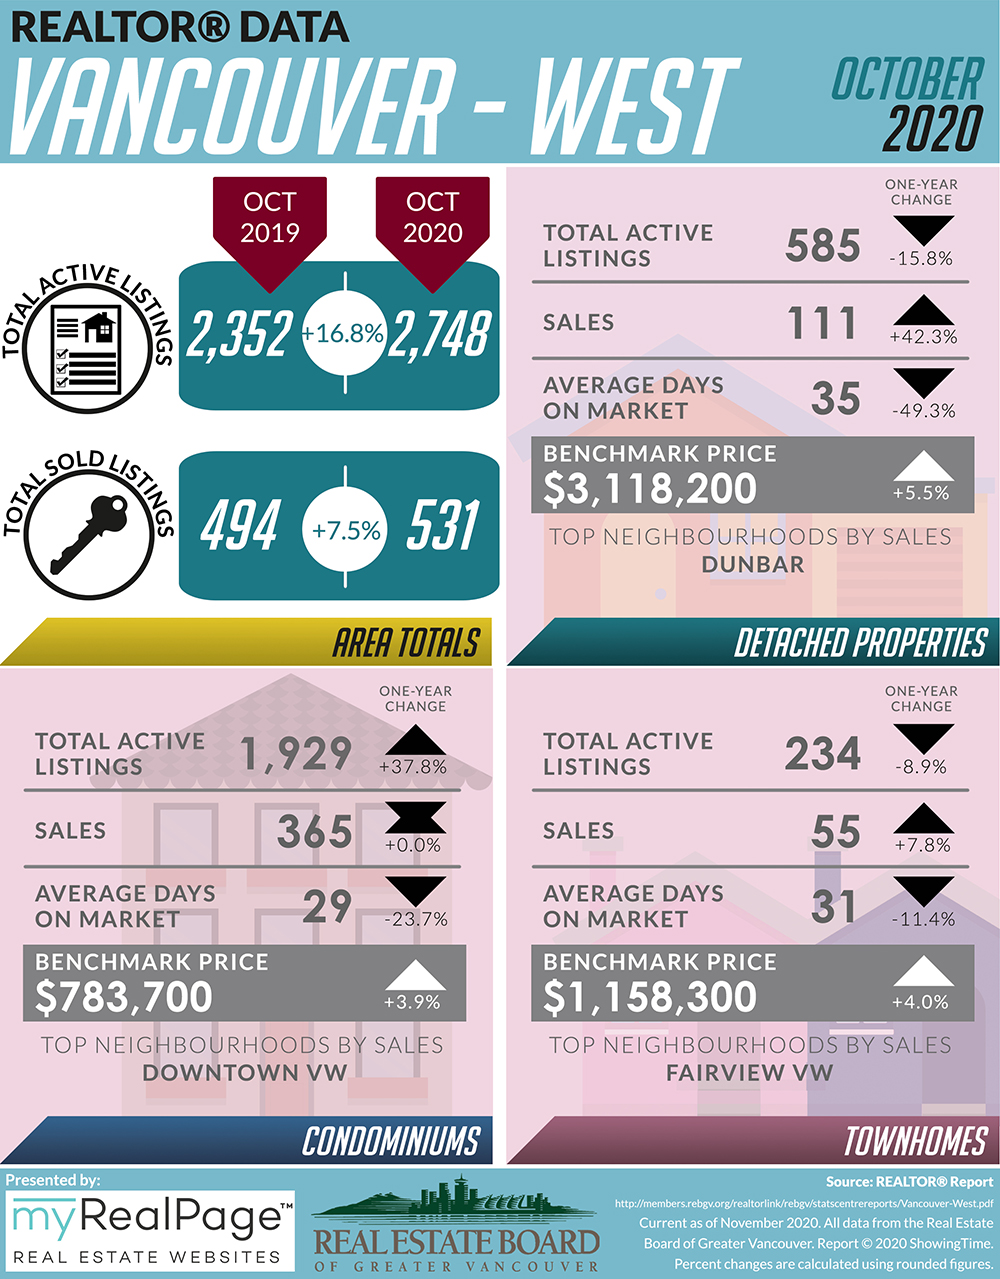
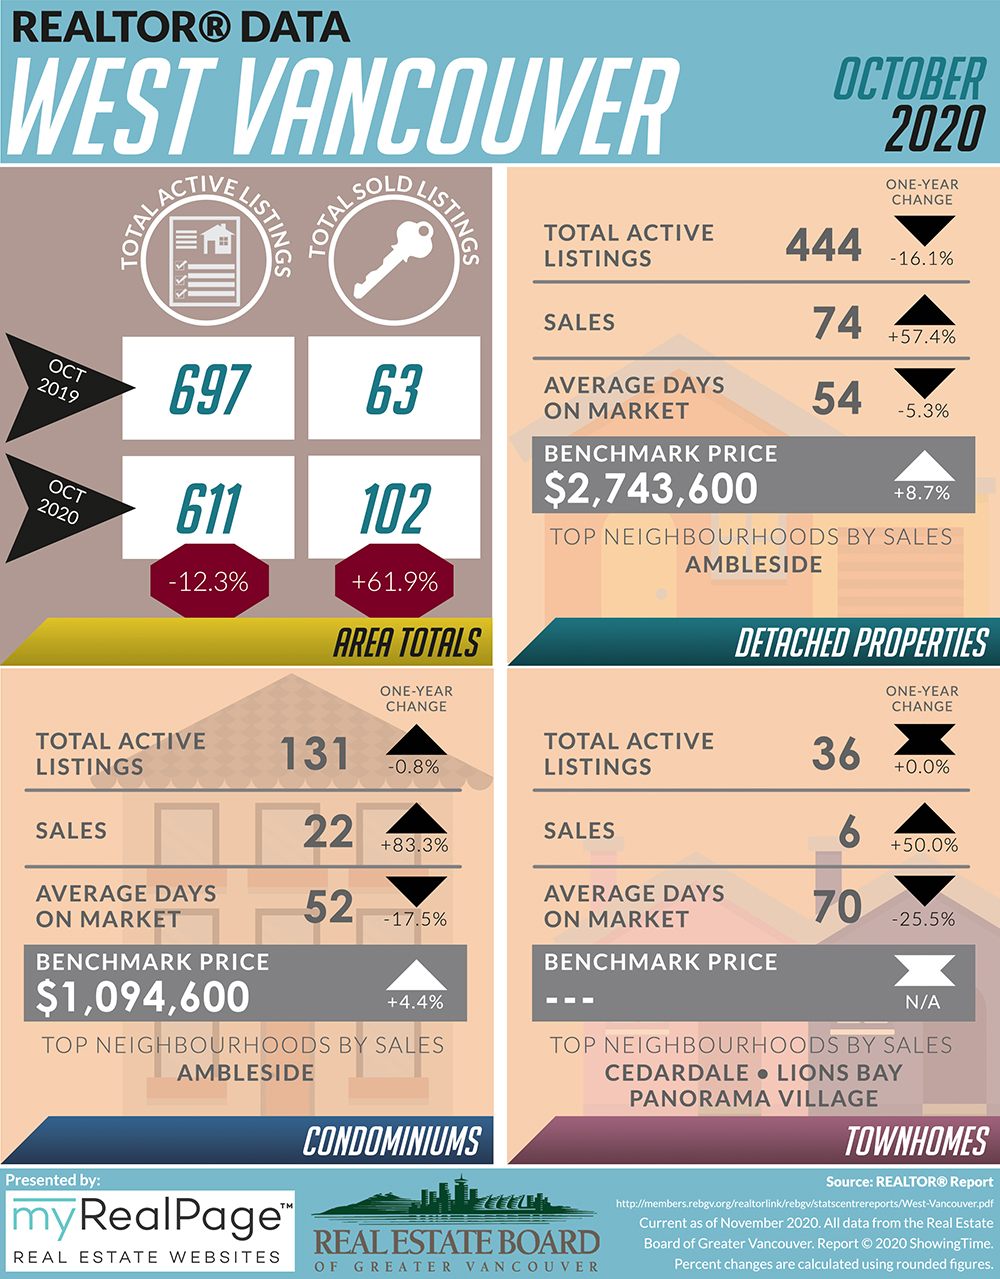
These infographics cover current trends in North Vancouver, West Vancouver, Vancouver East, and Vancouver West. Click on the images for a larger view! (Protip: Make sure to grab the printable PDF versions, too! It fits best when printed on A4-sized sheets, AND we’ve added an area on the sheet where you can attach your business card! 🙂 )
Download Printable Version – REBGV October 2020 Data Infographics
-
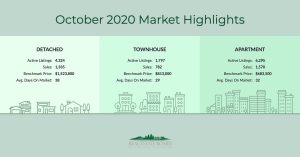
- (Image from REBGV website)
-
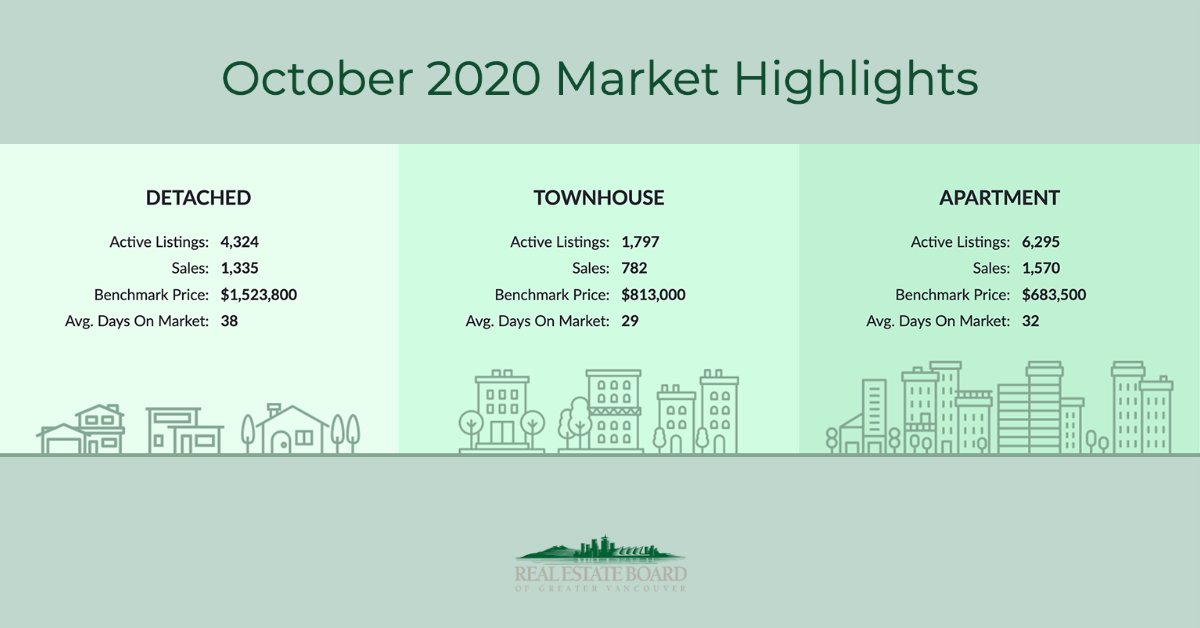
- (Image from REBGV Twitter)
Last Updated on July 25, 2022 by myRealPage
