INFOGRAPHICS: October 2022 FVREB Fraser Valley, South Surrey, Etc. Market Reports

Housing prices remain soft, sales flat, throughout the Fraser Valley
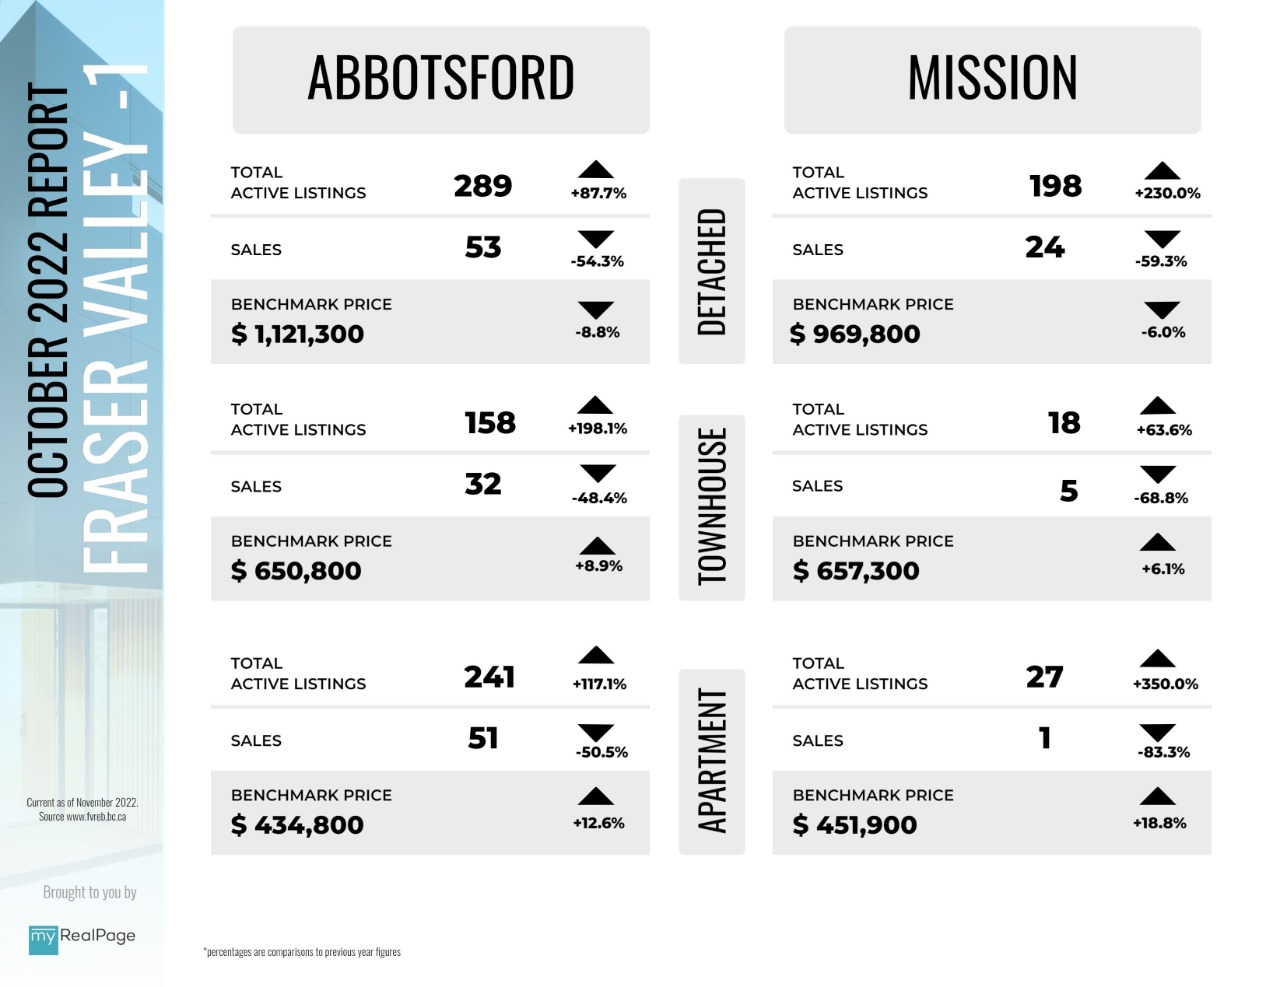
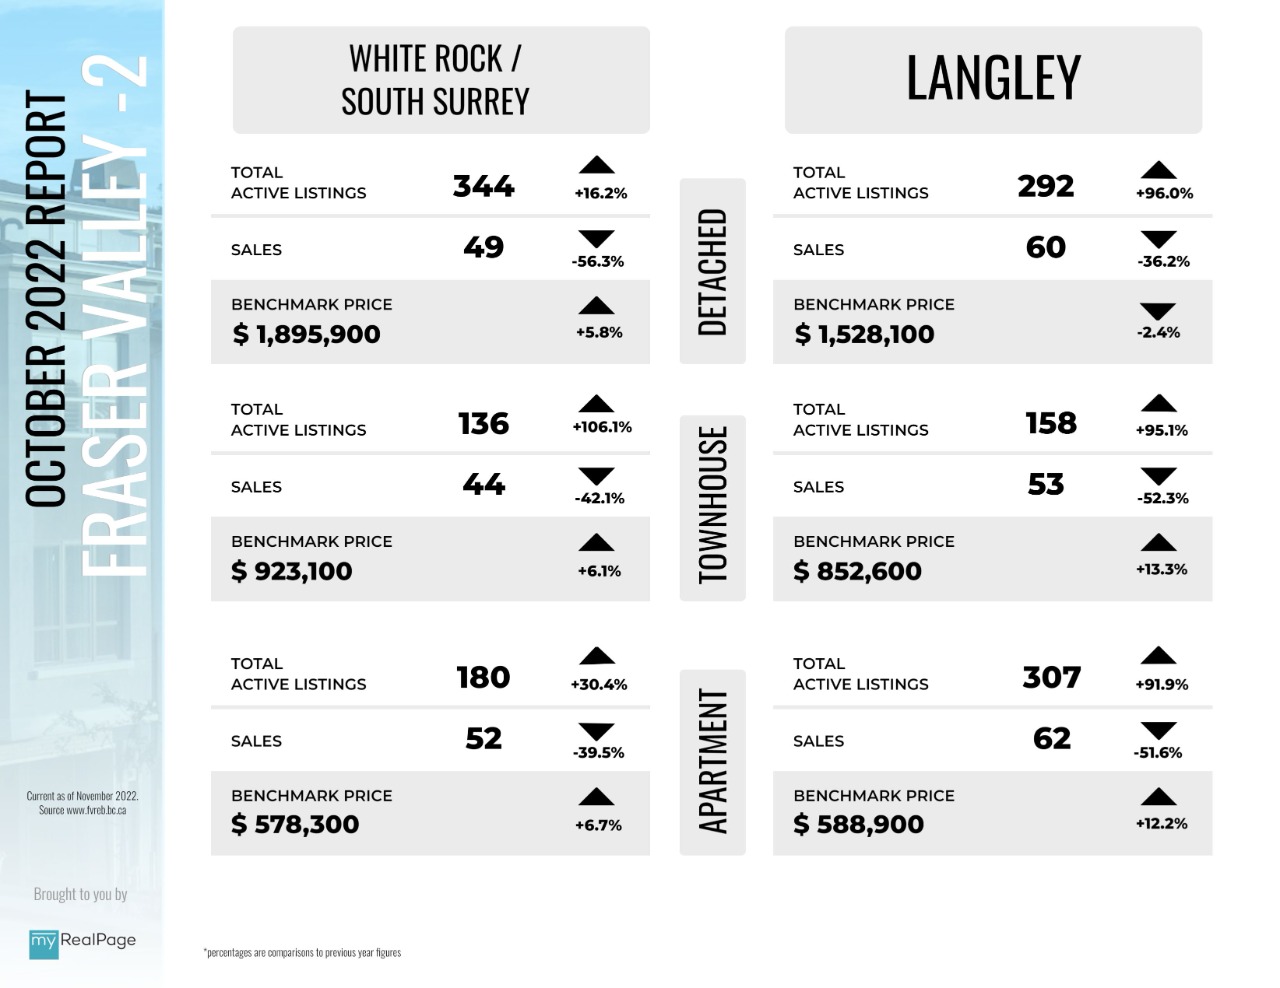
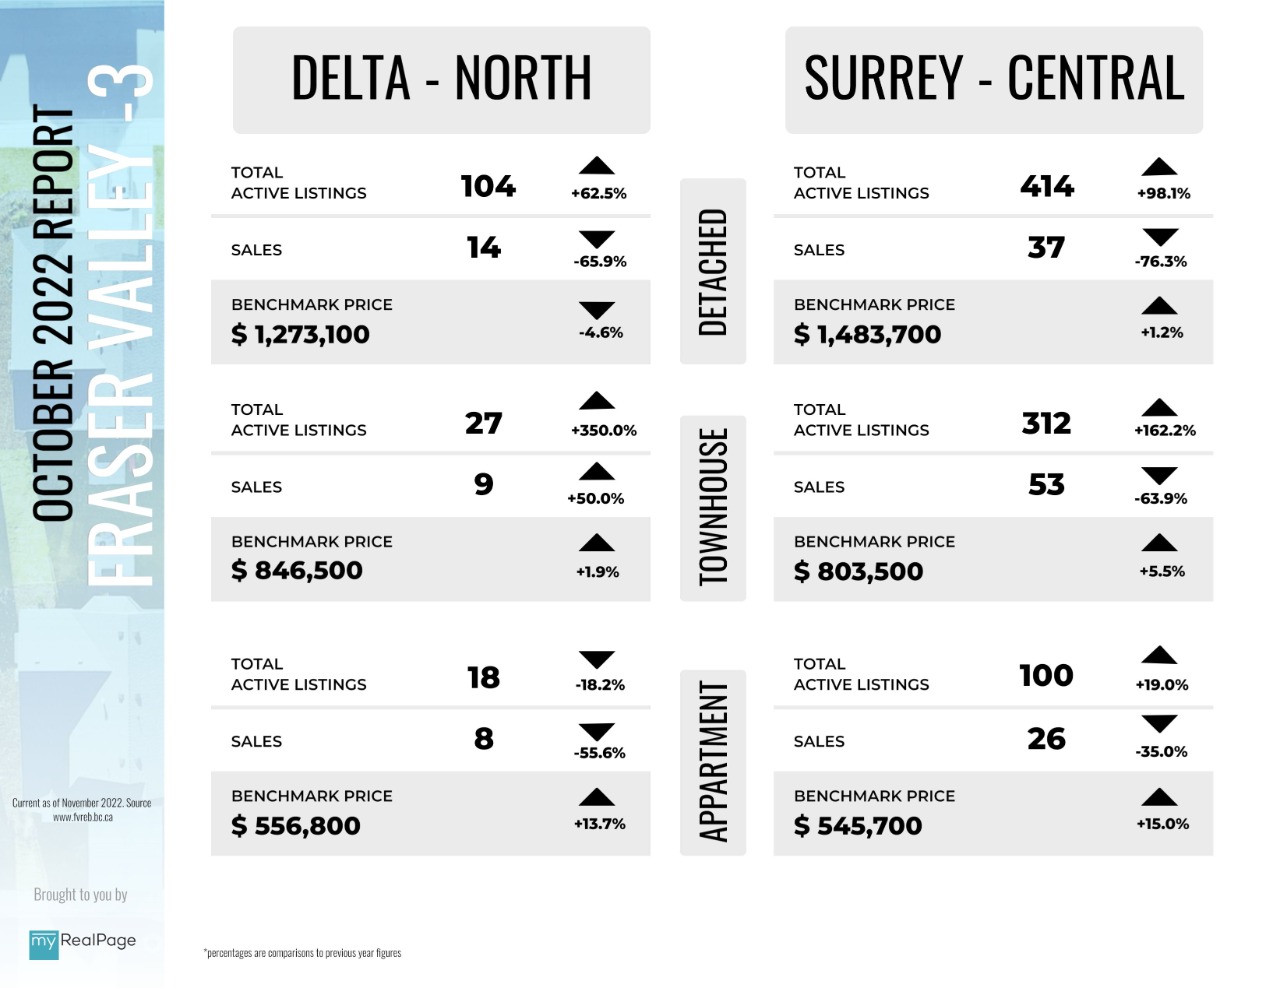
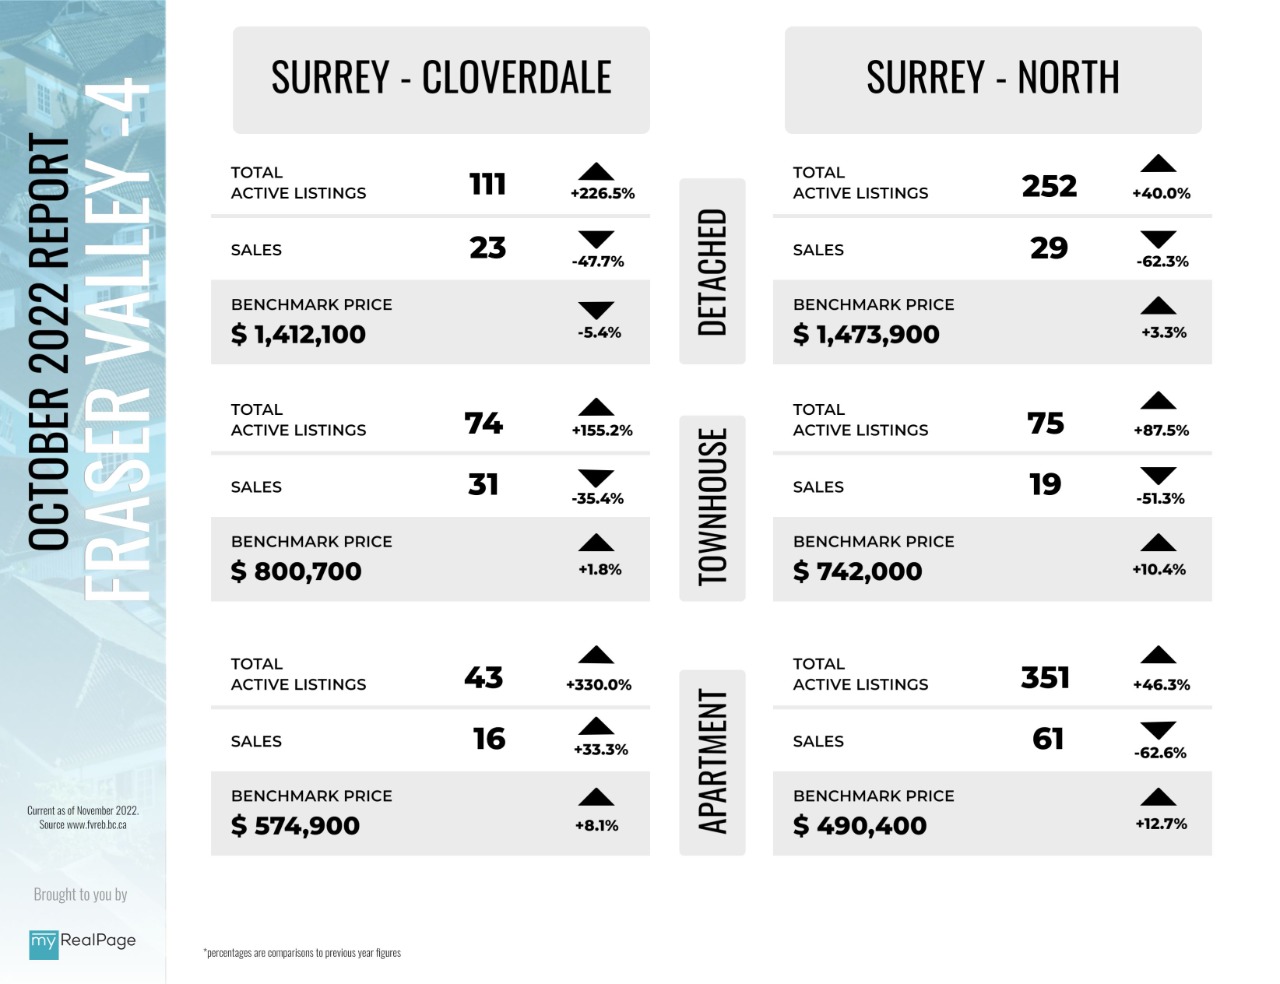
Fraser Valley housing market sales for October remained relatively unchanged from last month as prices dipped slightly across all categories.
In October, the Fraser Valley Real Estate Board (FVREB) processed 901 sales on its Multiple Listing Service® (MLS®), an increase of 0.4 per cent compared to last month and a 53.5 per cent decrease compared to this time last year.
The Board received 2,186 new listings in October, a decrease of 3.8 per cent compared to September, and on par with October 2021. The month ended with a total active inventory of 5,642, a decrease of 2.8 per cent from last month but up 63.7 per cent compared to October 2021.
Read the full report on the FVREB website!
The following data is a comparison between October 2022 and October 2021 numbers, and is current as of November 2022. For last month’s report, check out our previous infographic!
Or follow this link for all our FVREB Infographics!
These infographics cover current trends in Fraser Valley neighbourhoods that are within the FVREB. Click on the images for a larger view!
Download Printable Version – FVREB October 2022 Market Report 1
Download Printable Version – FVREB October 2022 Market Report 2
Download Printable Version – FVREB October 2022 Market Report 3
Download Printable Version – FVREB October 2022 Market Report 4
Last Updated on November 3, 2022 by myRealPage
