INFOGRAPHICS: September 2018 CREB City And Region Market Reports

In this month’s updates for movement within areas covered by the Calgary Real Estate Board (CREB), sales continue to decline as there has been no change in the region’s economic climate.
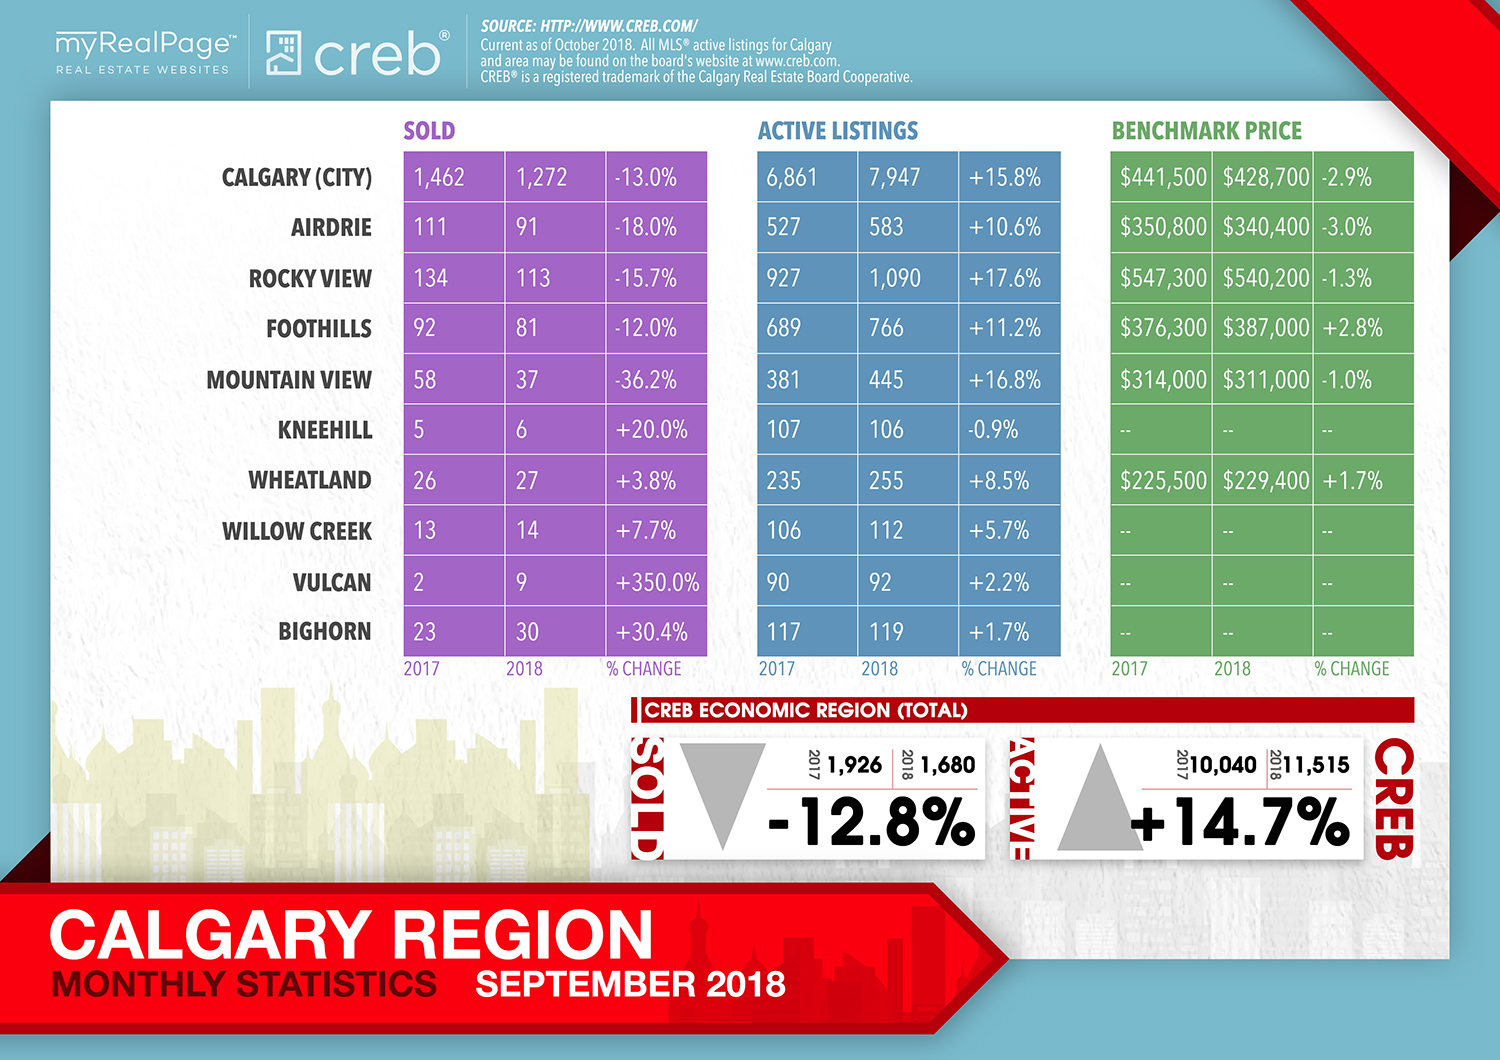
According to CREB’s latest press release, total sales activity has shown a 13% decrease versus the previous year, and is “well below long-term averages.”
CREB’s Chief Economist, Ann-Marie Lurie, stated that
“Calgary’s economy continues to struggle with unemployment, which rose again last month to over eight per cent. Concerns in the employment market, higher lending rates and shaken confidence are weighing on housing demand. At the same time, supply levels continue to remain high, resulting in persistent oversupply and price declines.”
Meanwhile CREB President Tom Westcott has noted that this is “the new normal” for the region’s real estate market. He also cautions,
“Some potential buyers may want to take advantage of the market conditions, but they face difficulties selling their existing home based on their expectations. This prevents them from purchasing something else.”
There is, however, a hint of optimism as the rental market has shown signs of improvement, which could possibly slow reduction in the overall housing supply.
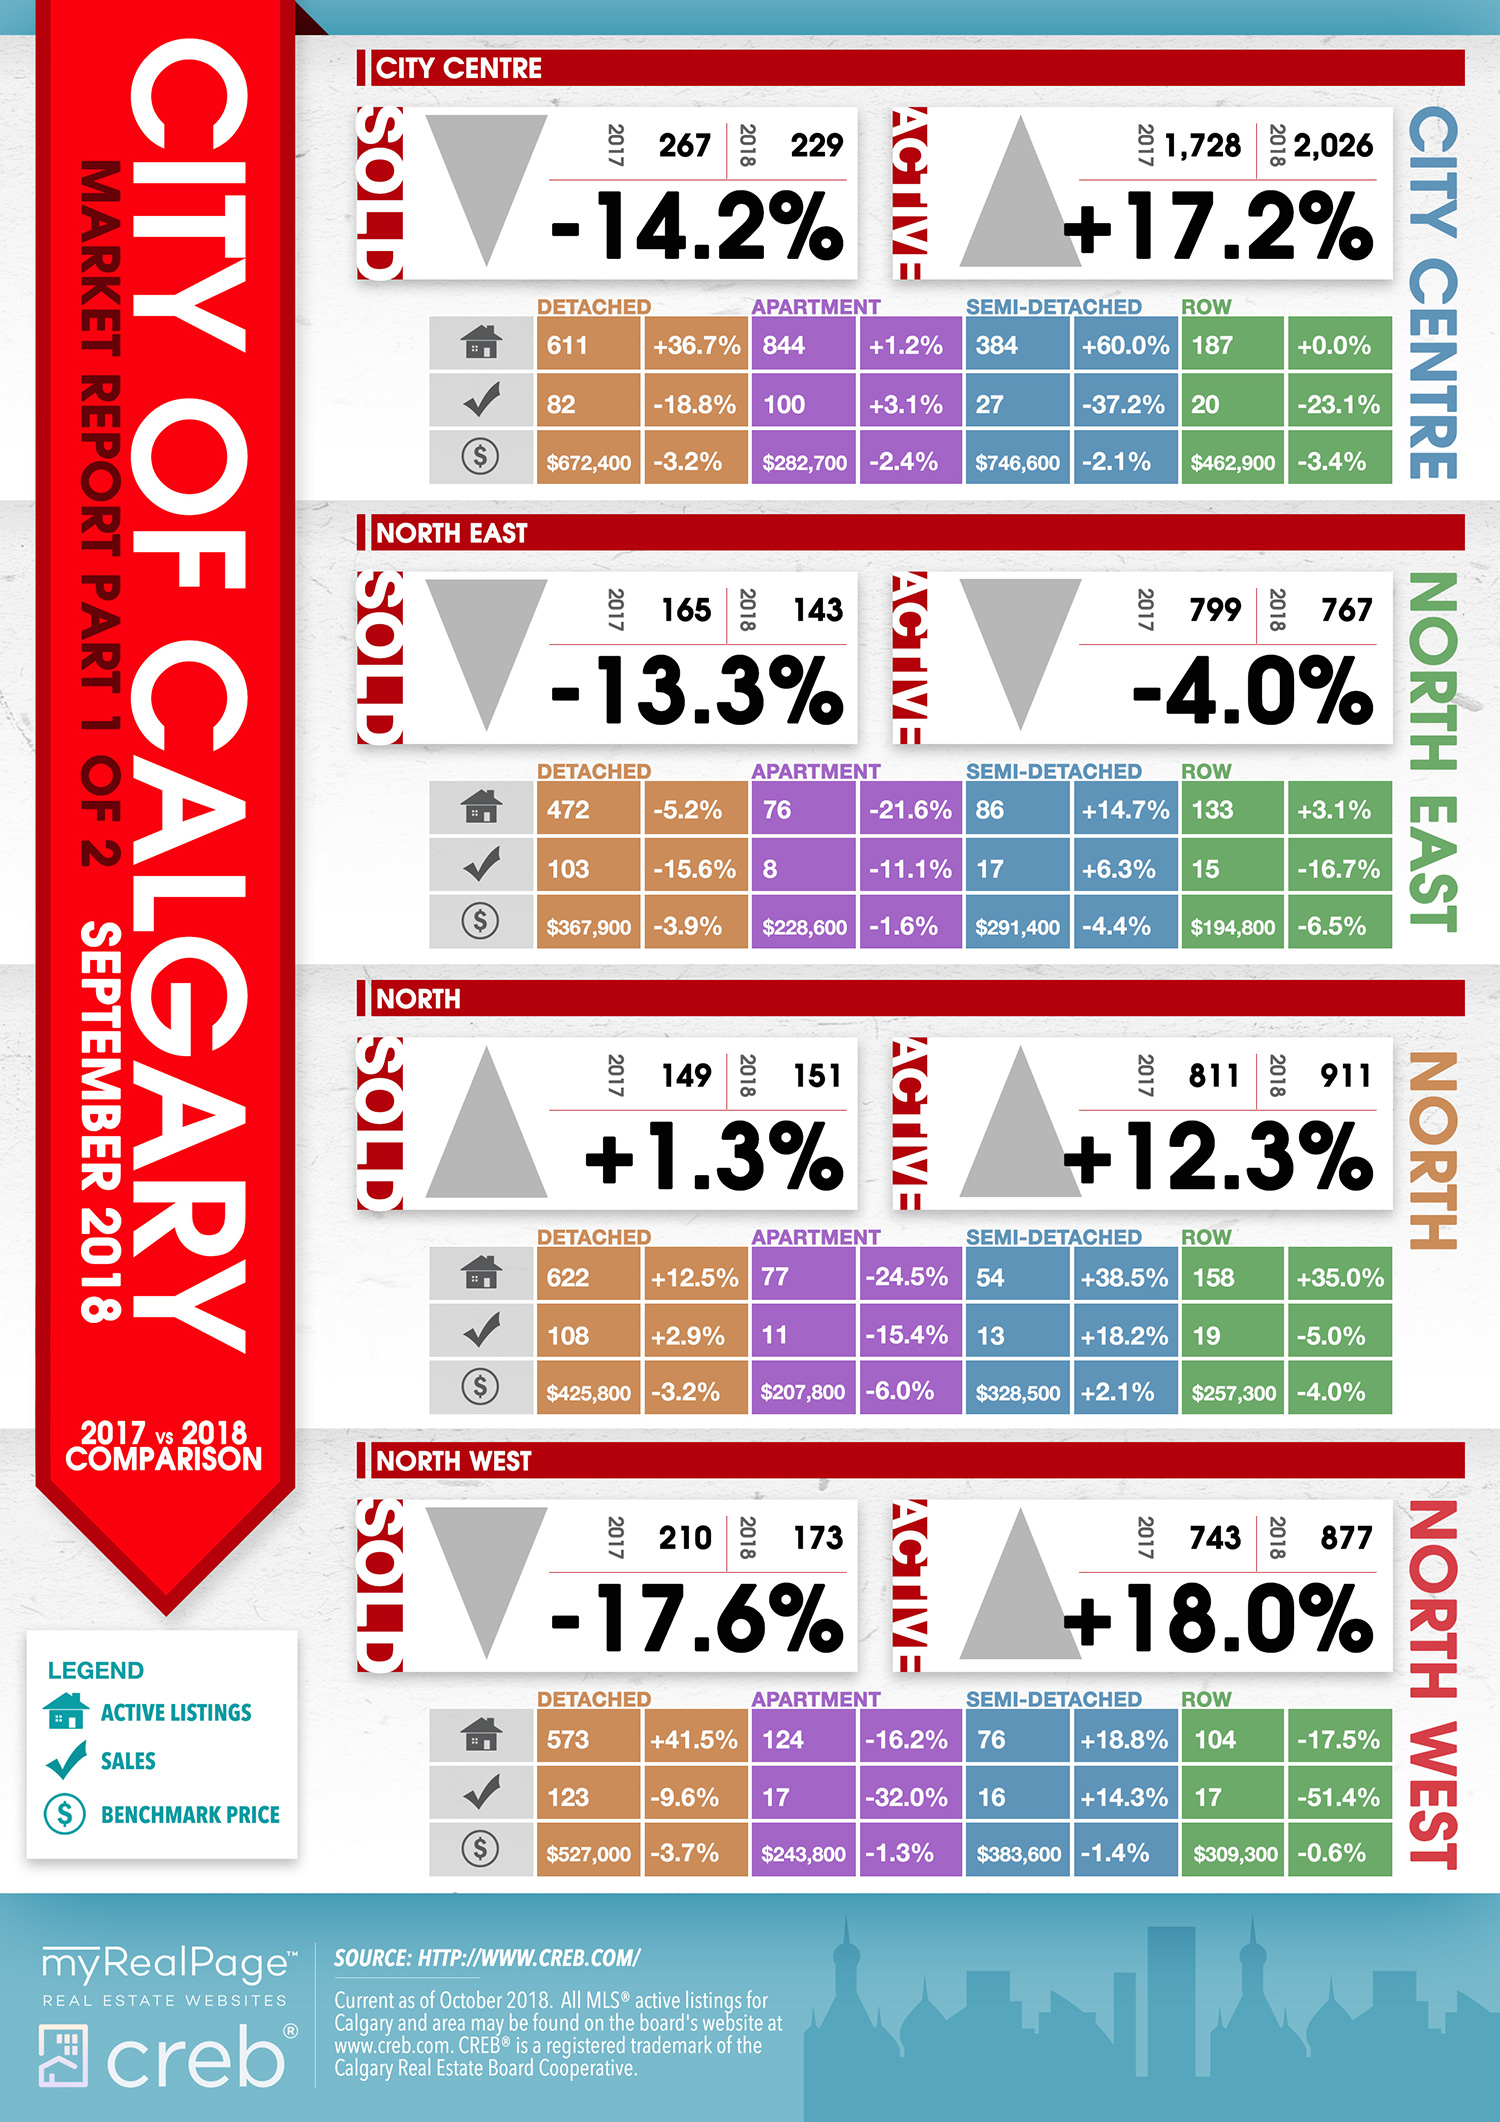
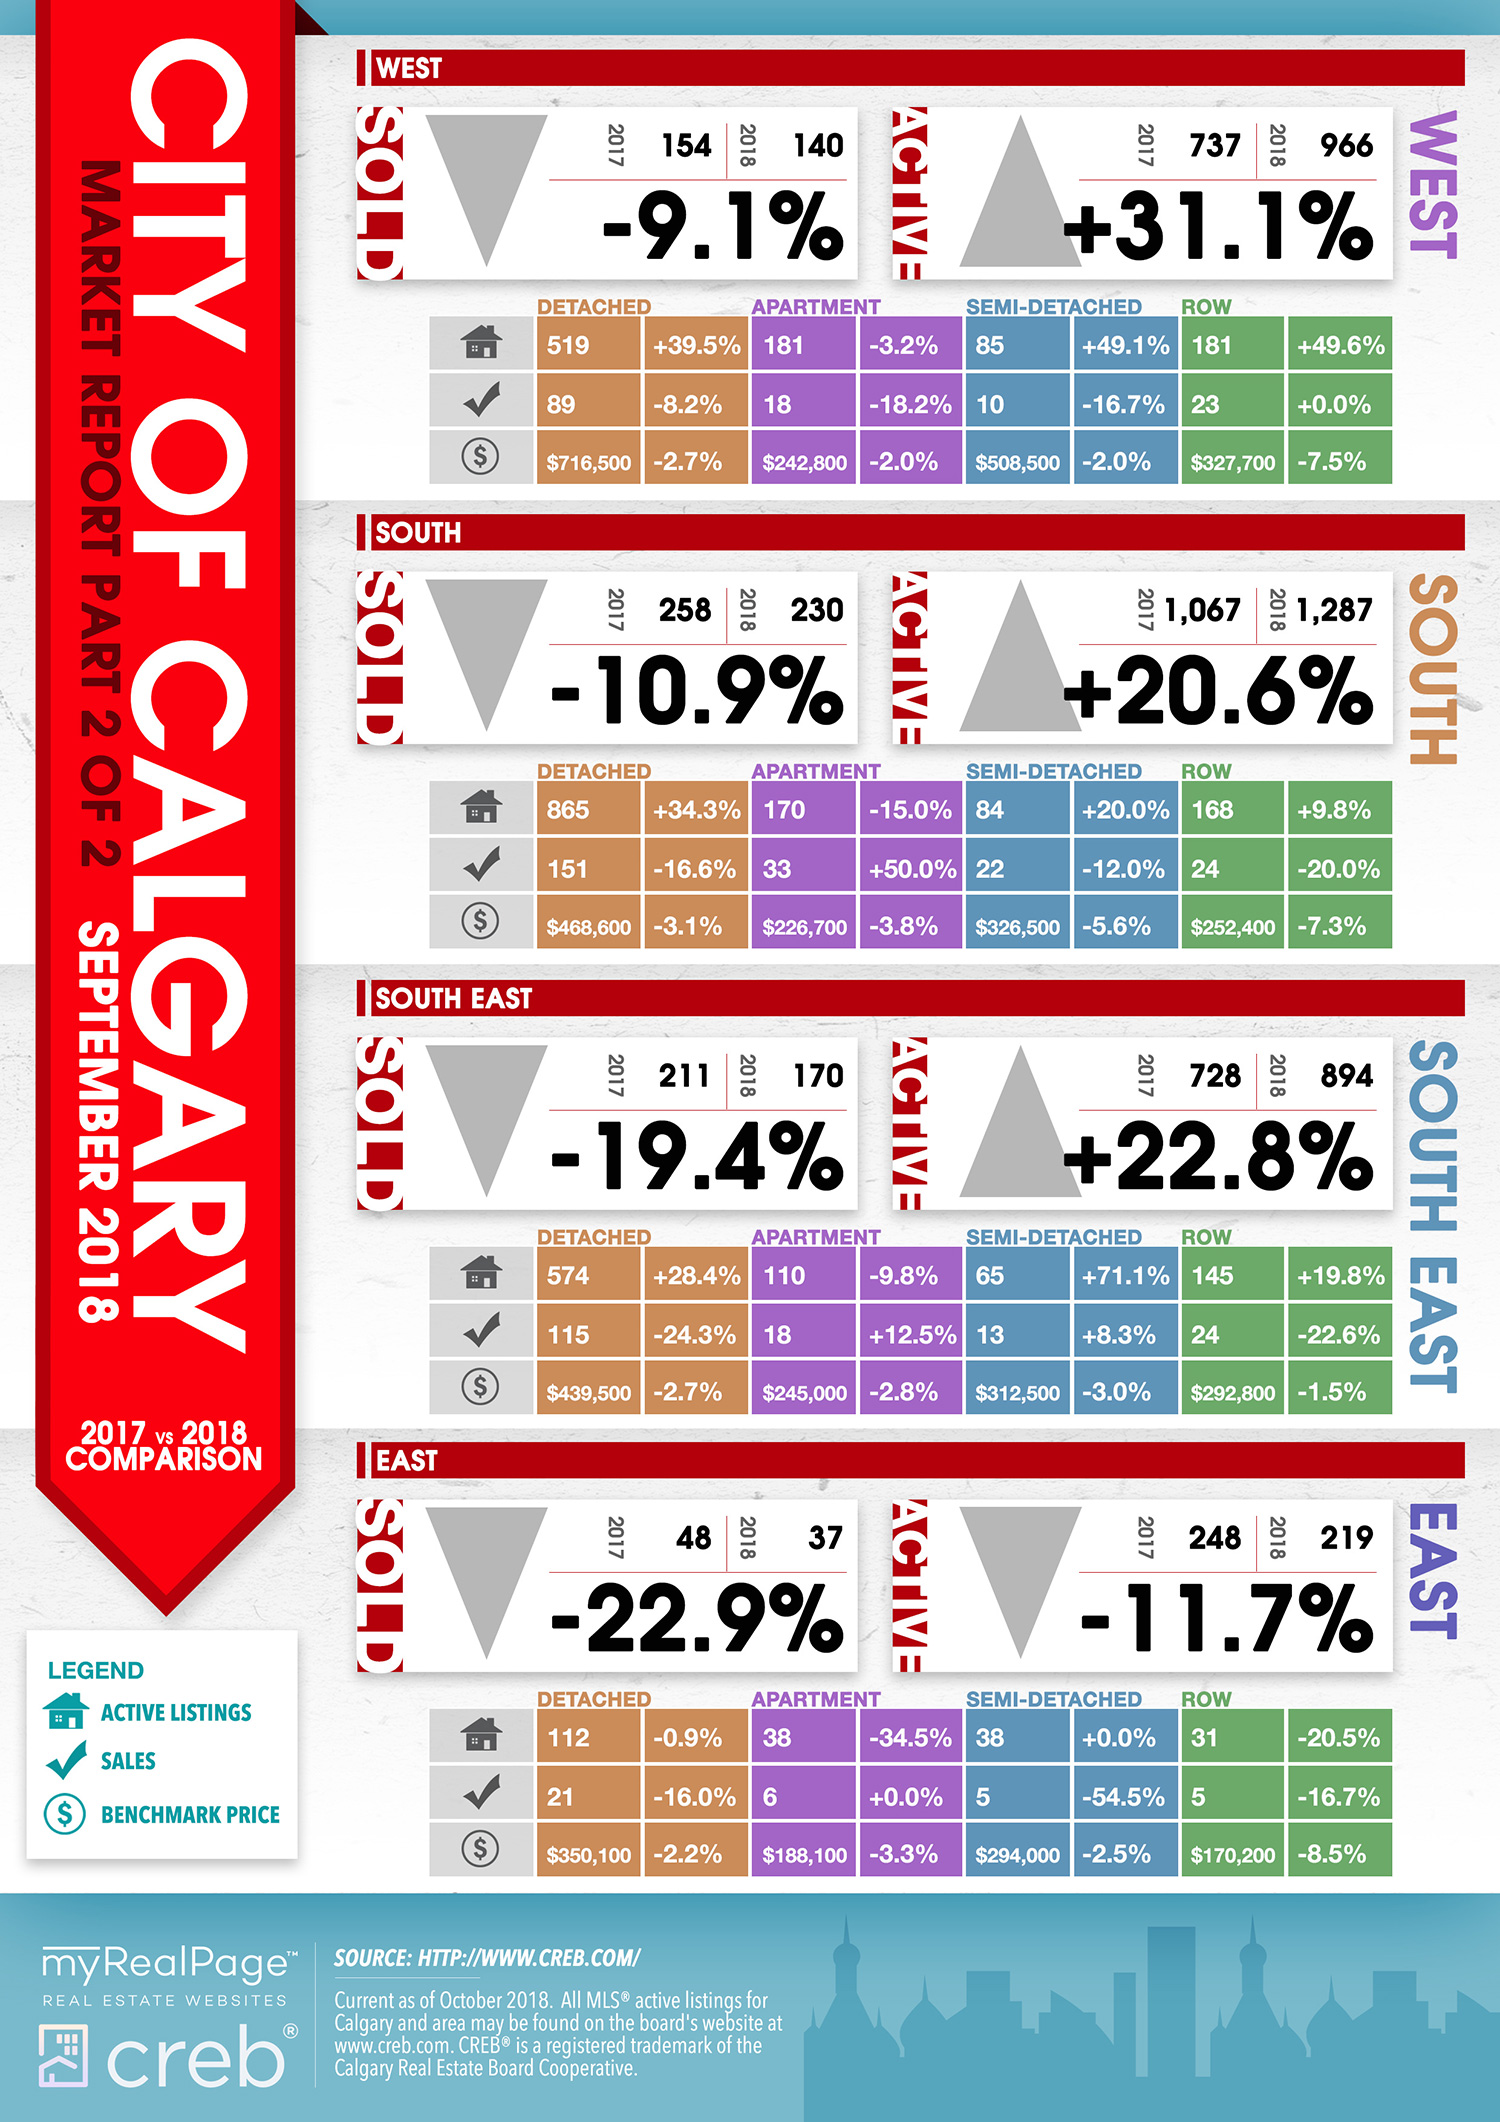
The following data is a comparison between September 2017 and September 2018 numbers, and is current as of October 2018. For last month’s numbers, check out our previous infographic. Or follow this link for all our CREB Infographics!
Click on the images for a larger view!
(Protip: Make sure to grab the printable PDF versions, too! It fits best when printed on A4-sized sheets, AND we’ve added an area on the sheet where you can attach your business card! 🙂 )
Download Printable Version – September 2018 CREB, City of Calgary Report
Download Printable Version – September 2018 CREB, Calgary Region Report
Last Updated on July 25, 2022 by myRealPage
