INFOGRAPHICS: September 2019 FVREB Fraser Valley, South Surrey, Etc. Market Reports

As the weather cools down, the FVREB market is warming up! Here are this month’s market updates for the Fraser Valley Real Estate Board (FVREB).
As noted in their most recent market report, FVREB has announced that property sales in Fraser Valley have recovered, bringing the market into balance.
For the third straight month, home sales in the Fraser Valley surpassed 2018 levels bringing the market back in line with long-term averages.
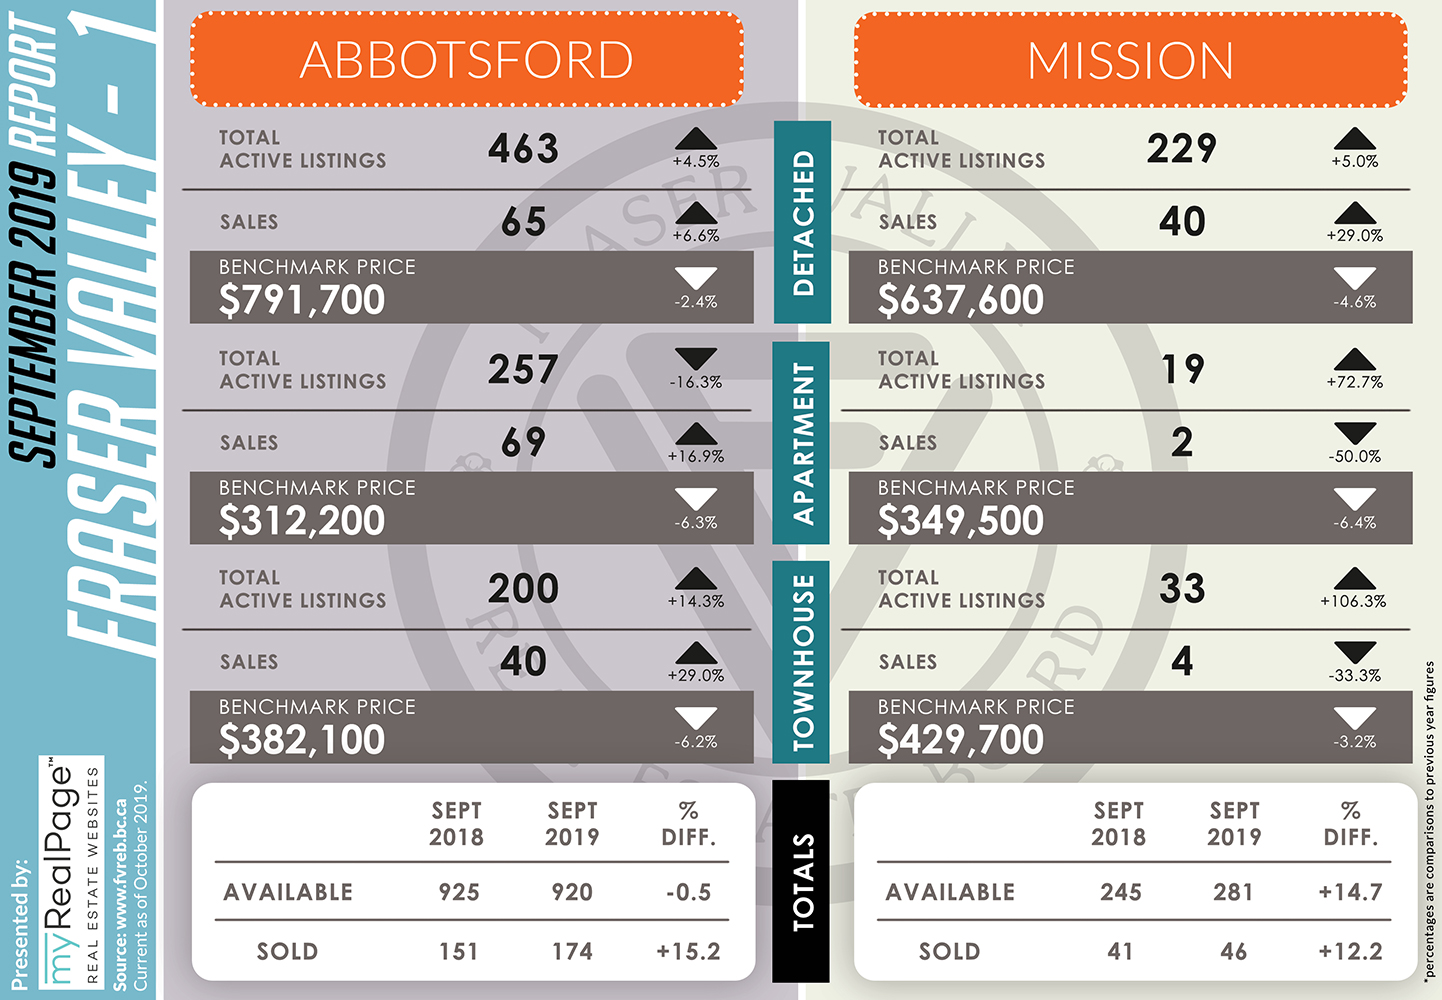
The Fraser Valley Real Estate Board processed 1,343 sales of all property types on its Multiple Listing Service® (MLS®) in September, a 3.5% increase compared to sales in August 2019, and a 29.8% increase compared to the 1,035 sales in September of last year.
There were 7,946 active listings available in the Fraser Valley at the end of September, an increase of 3.9% compared to September of last year and a decrease of 1.2% compared to August 2019. The Board received 2,769 new listings in September, a 17.5% increase compared to August 2019’s intake of 2,357 new listings and a 6% decrease compared to September of last year.
As noted by Darin Germyn, President of the Board,
“The market’s return to balance is good news for both buyers and sellers, however it’s important to put the 30% year-over-year increase in sales into context. September’s sales went from amongst the worst in 10 years to just above our 10-year average.
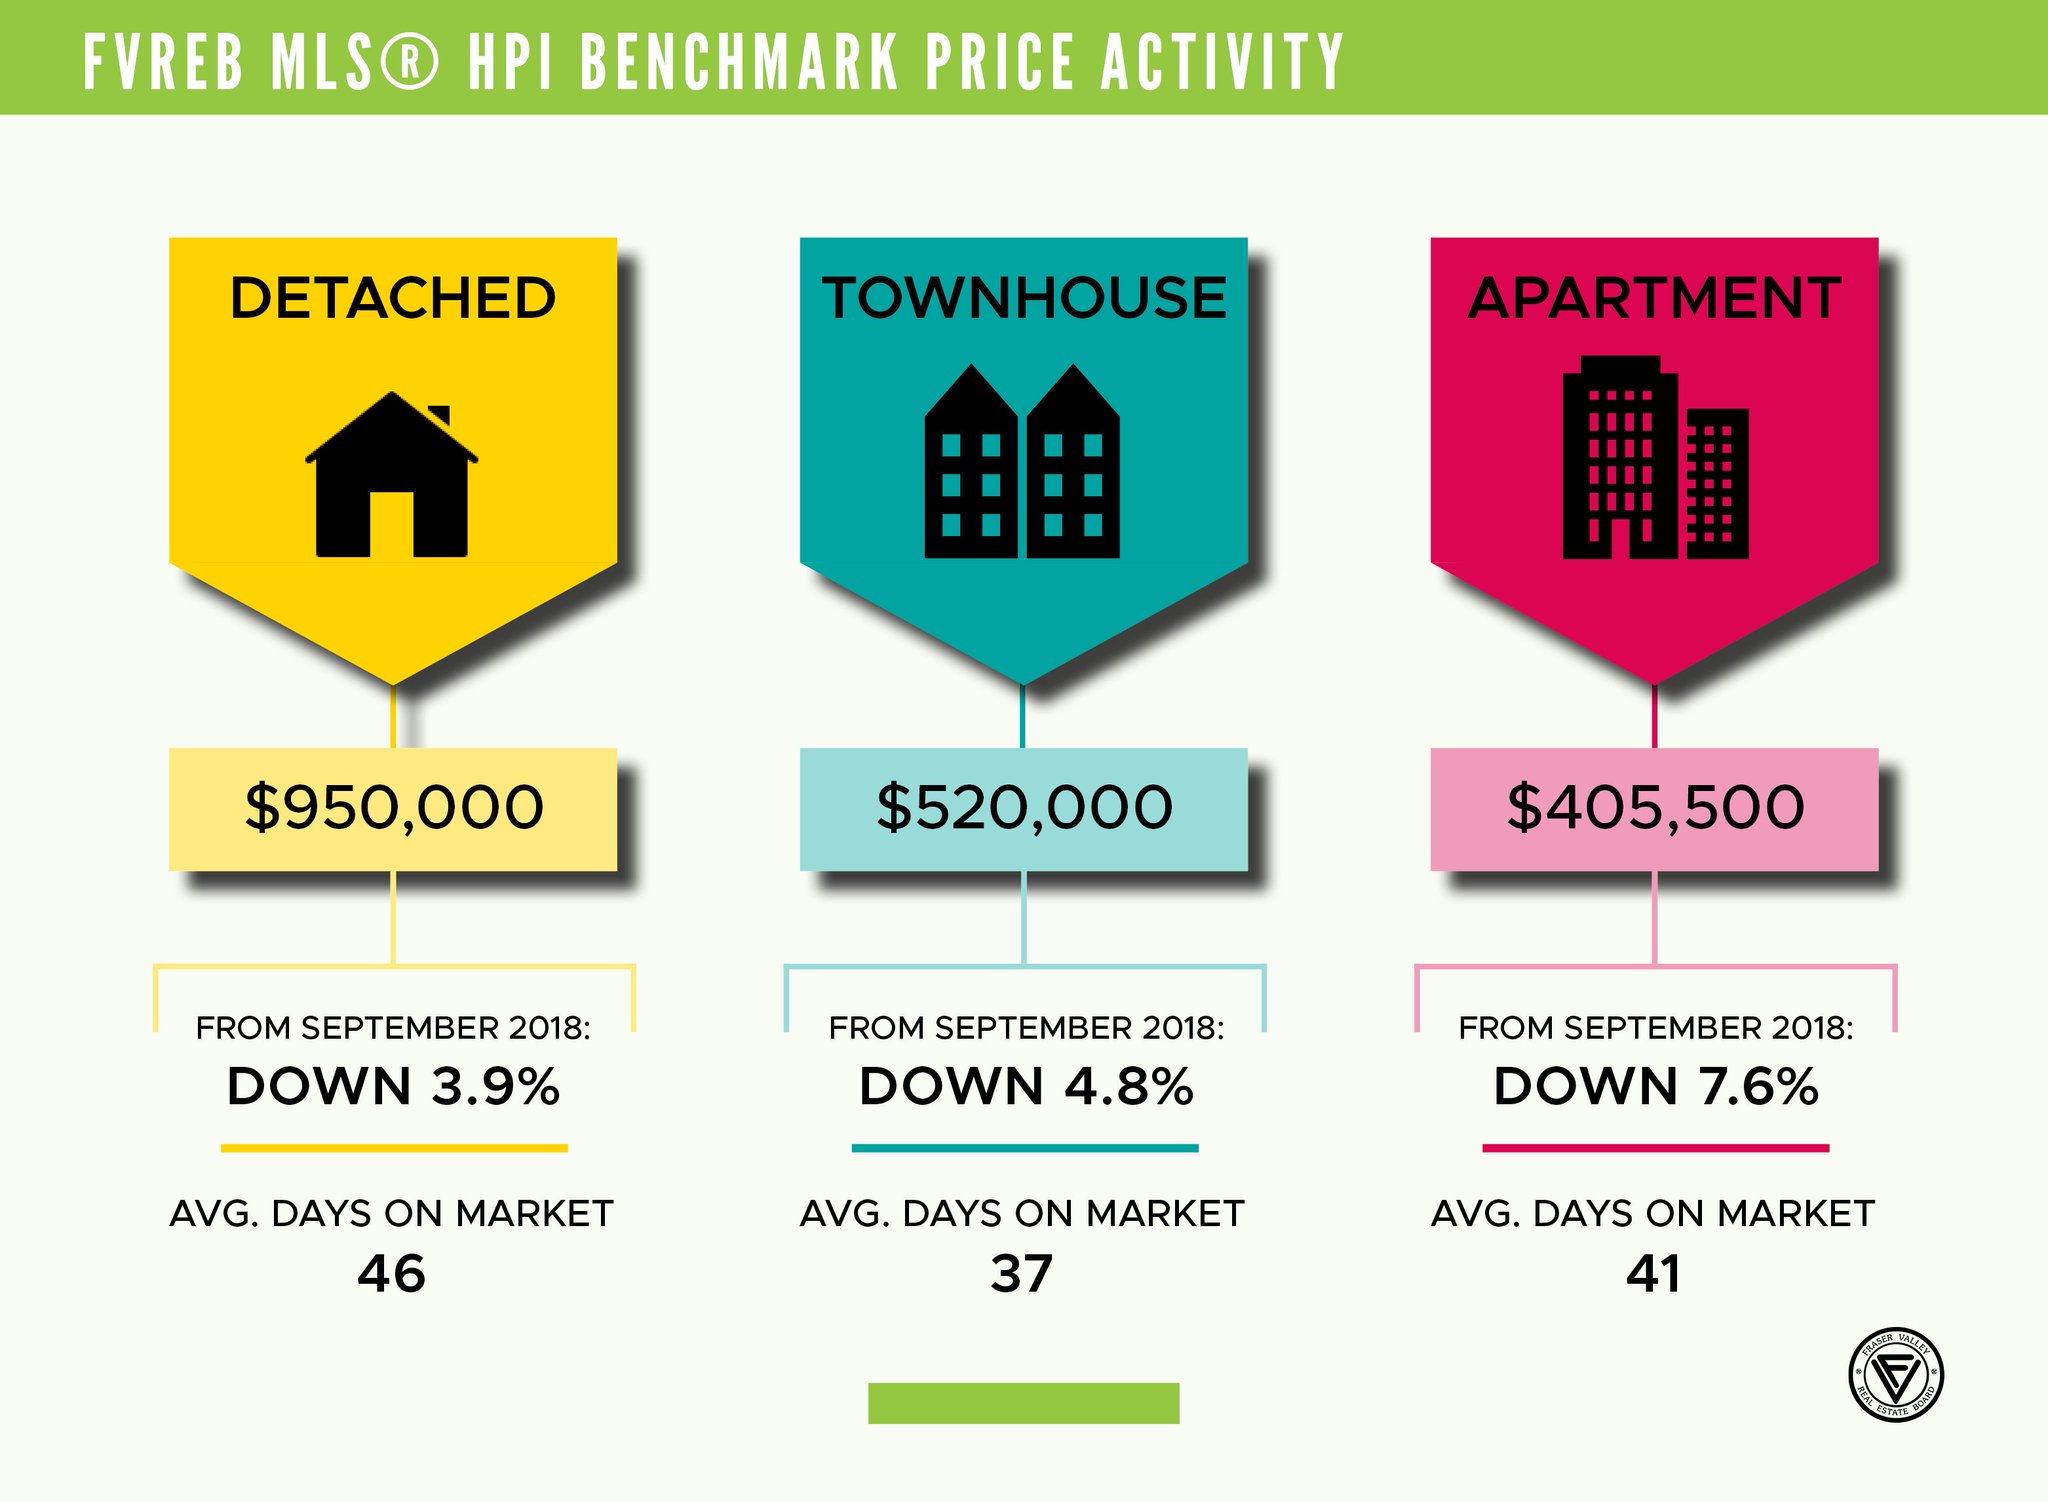
“Home prices are still dropping compared to a year ago, but on a month-to-month basis, prices are moderating because supply is shrinking. Our incoming supply of new listings has dropped consistently for the last four months pushing our total inventory in the Fraser Valley to the lowest it’s been since April, which has had an impact on prices.
Financing is still a challenge for many clients, but fortunately in a balanced market like this, REALTORS® have the time to work with clients and advise them of the best strategies for them, whether they are buying or selling.”
The following data is a comparison between September 2018 and September 2019 numbers, and is current as of October 2019. For last month’s report, check out our previous infographic!
Or follow this link for all our FVREB Infographics!
These infographics cover current trends in Fraser Valley neighbourhoods that are within the FVREB.
Click on the images for a larger view!
(Protip: Make sure to grab the printable PDF version, too! It fits best when printed on A4-sized sheets, AND we’ve added an area on the sheet where you can attach your business card! 🙂 )
Download Printable Version – FVREB September 2019 Market Report

(Image Source: FVREB Twitter)
Last Updated on July 25, 2022 by myRealPage
