INFOGRAPHICS: September 2020 FVREB Fraser Valley, South Surrey, Etc. Market Reports
Consumer demand for real estate in the Fraser Valley remained robust for the fourth consecutive month, with overall sales and new listings reaching record breaking numbers in September.
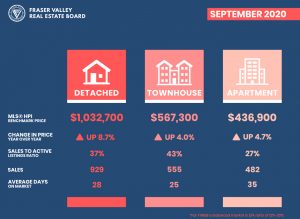
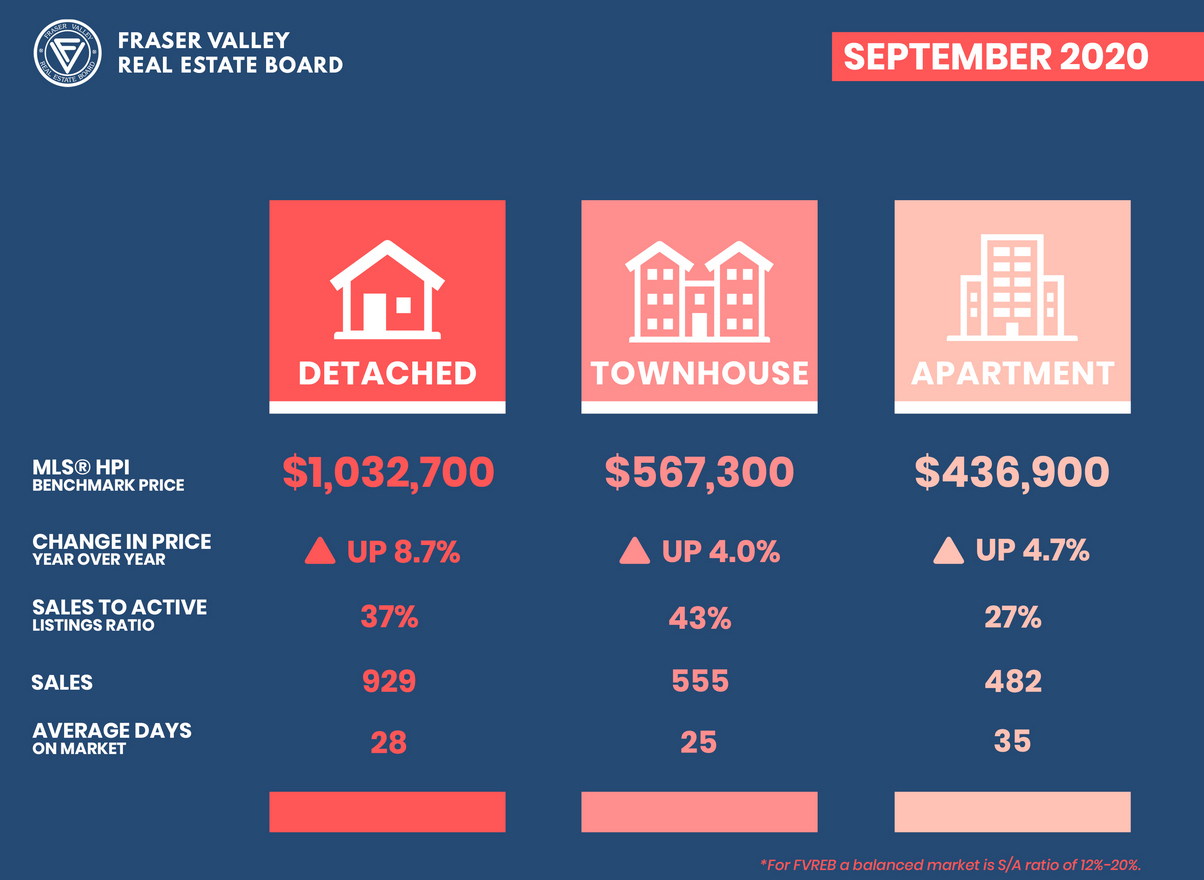
The Fraser Valley real estate board processed 2,231 sales on its Multiple Listing Service in September, an increase of 66.1% compared to the same month last year and an increase of 9.4% compared to August 2020. this is the highest recorded sales for September in the history of FVREB.
In the last three months, Fraser Valley has seen a defined shift in demand towards single family detached homes with sales in July through to September garnering 47% of the three main residential types, compared to 43% during the same period last year.
Read the full report on the FVREB website!
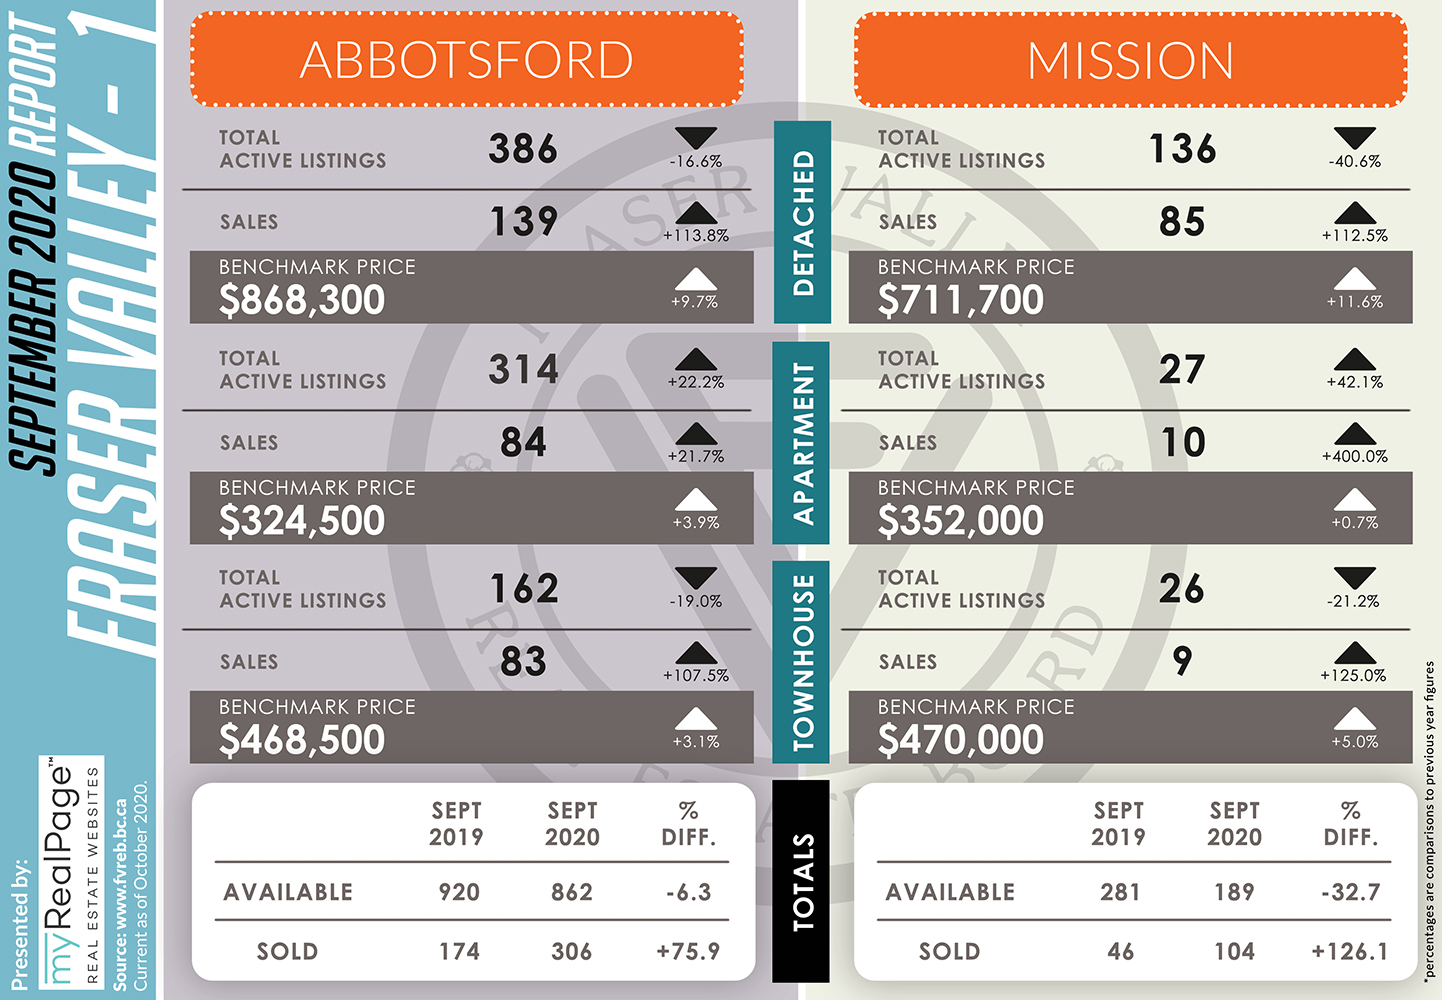
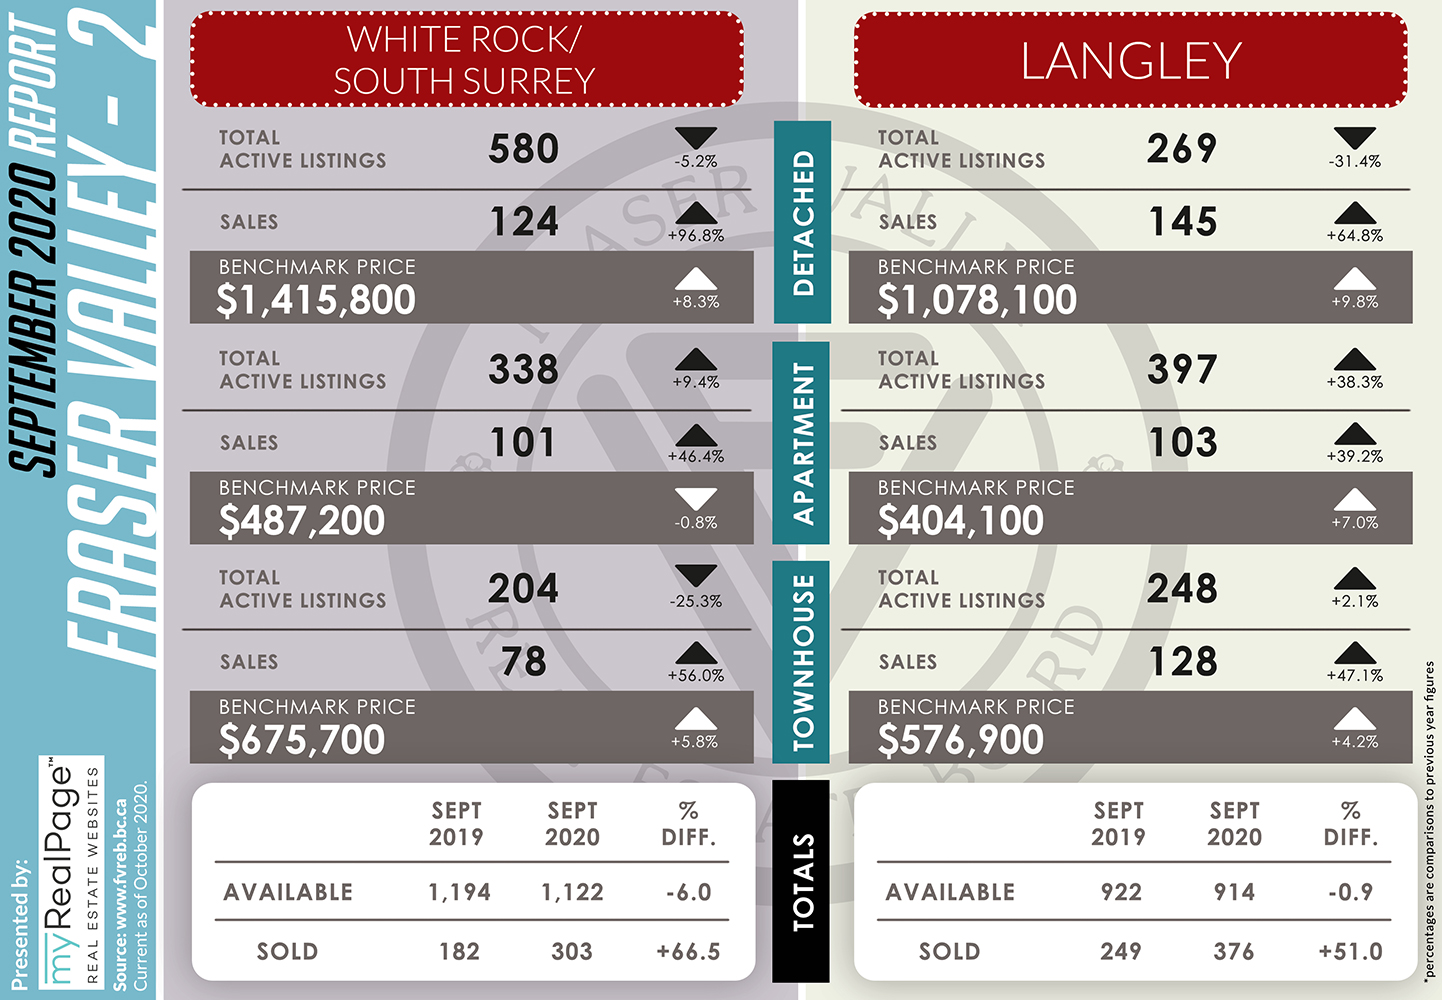
The following data is a comparison between September 2019 and September 2020 numbers, and is current as of October 2020. For last month’s report, check out our previous infographic!
Or follow this link for all our FVREB Infographics!
These infographics cover current trends in Fraser Valley neighbourhoods that are within the FVREB. Click on the images for a larger view! (Protip: Make sure to grab the printable PDF version, too! It fits best when printed on A4-sized sheets, AND we’ve added an area on the sheet where you can attach your business card! 🙂 )
Download Printable Version – FVREB September 2020 Market Report


-
- from FVREB Twitter
Last Updated on July 25, 2022 by myRealPage
