INFOGRAPHICS: September 2021 FVREB Fraser Valley, South Surrey, Etc. Market Reports

Positive start to fall market; new listings increase, sales soften
Demand for Fraser Valley real estate remained robust in September. While overall sales decreased compared to August, total sales reached the second‐highest levels for the month of September in the 100‐year history of the Board.
The Board processed a total of 1,866 property sales on its Multiple Listing Service® (MLS®) in September, a decrease of 10.6% compared to August and a 16.4% decrease compared to the same month last year.
Larry Anderson, President of the Board, said, “While we’ve seen a solid increase in new listings compared to August, market conditions continue to be challenging for buyers. Considering the demand across the region, the increase is simply not enough to bolster the inventory required to create greater balance in the market.
Read the full report on the FVREB website!
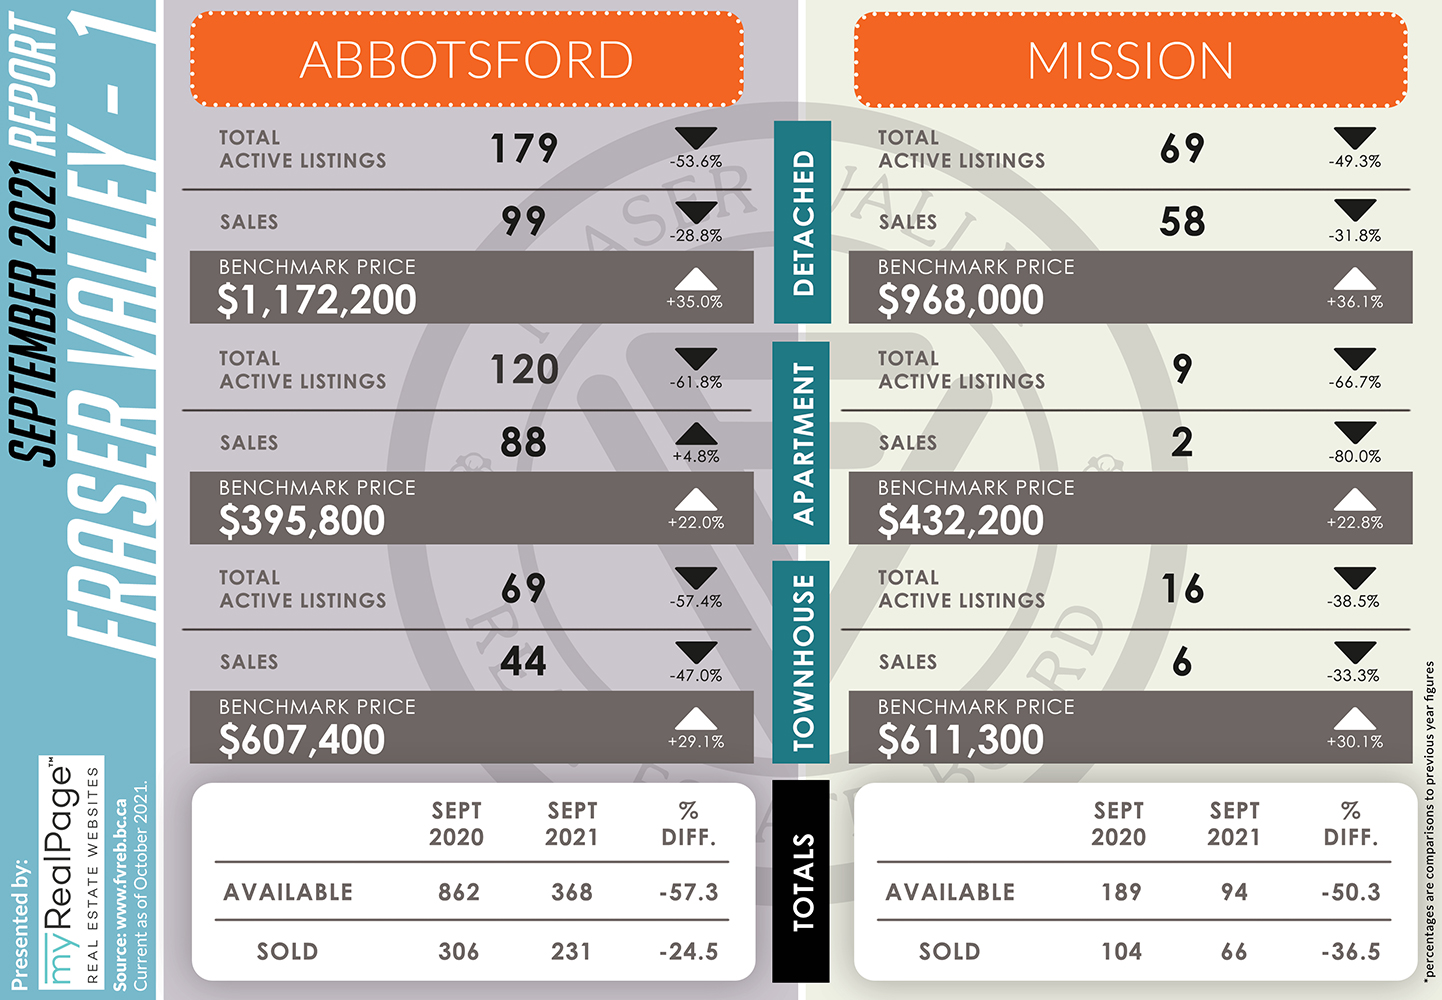
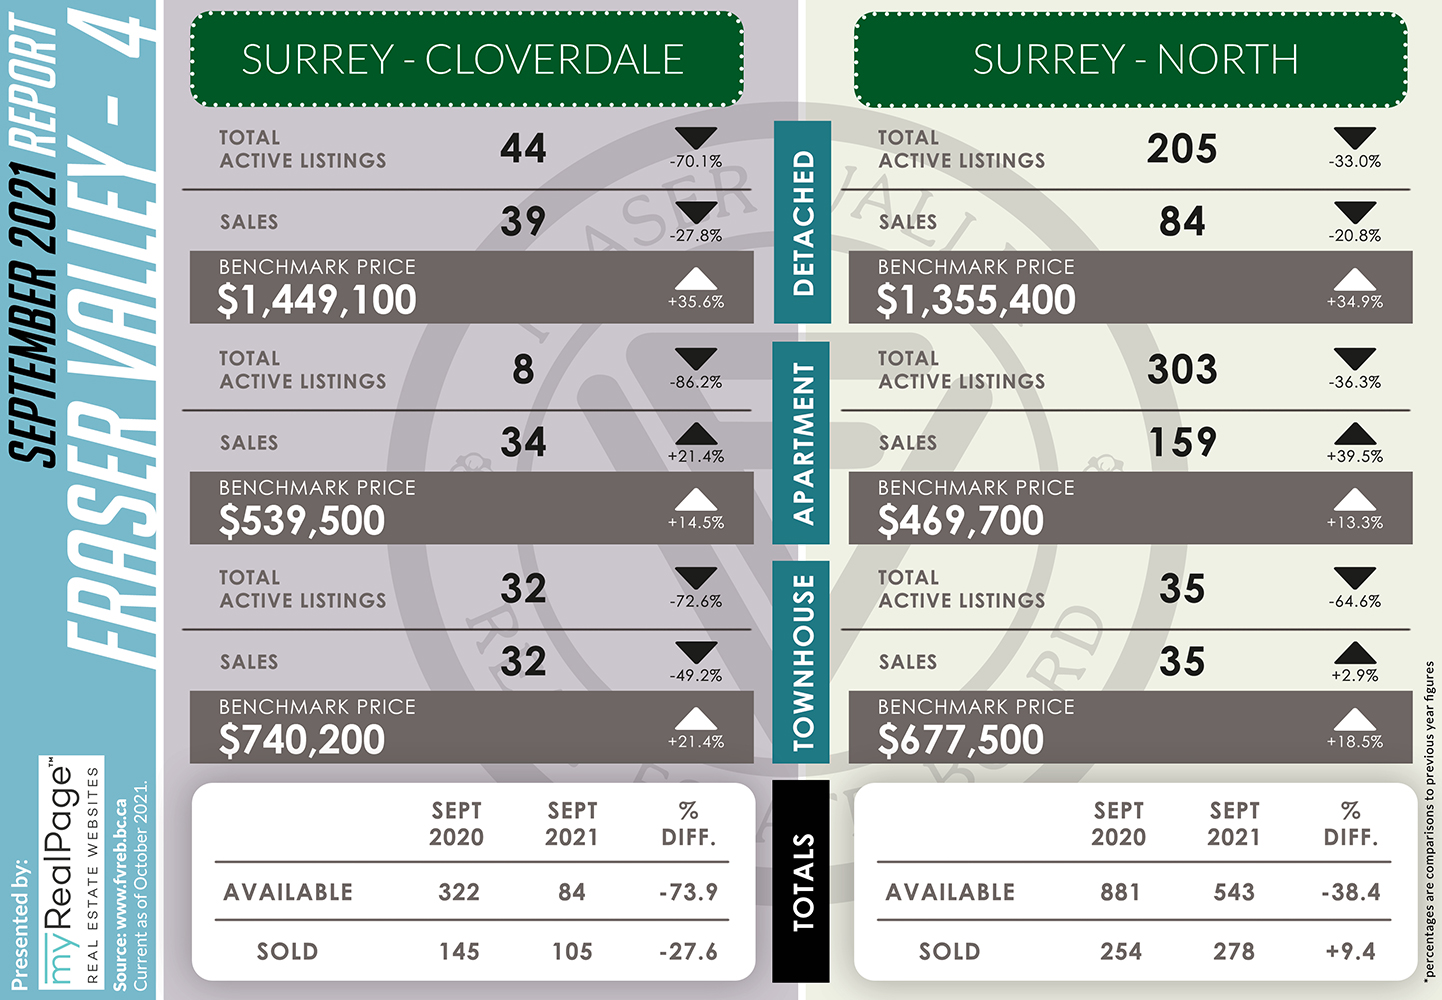
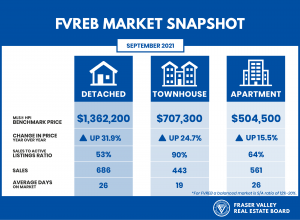
The following data is a comparison between September 2020 and September 2021 numbers, and is current as of October 2021. For last month’s report, check out our previous infographic!
Or follow this link for all our FVREB Infographics!
These infographics cover current trends in Fraser Valley neighbourhoods that are within the FVREB. Click on the images for a larger view! (Protip: Make sure to grab the printable PDF version, too! It fits best when printed on A4-sized sheets, AND we’ve added an area on the sheet where you can attach your business card! 🙂 )
Download Printable Version – FVREB September 2021 Market Report


-
- (from FVREB Twitter)
Last Updated on July 25, 2022 by myRealPage
