INFOGRAPHICS: February 2024 CREB City And Region Market Reports

Low inventory and high demand drive price gains in February
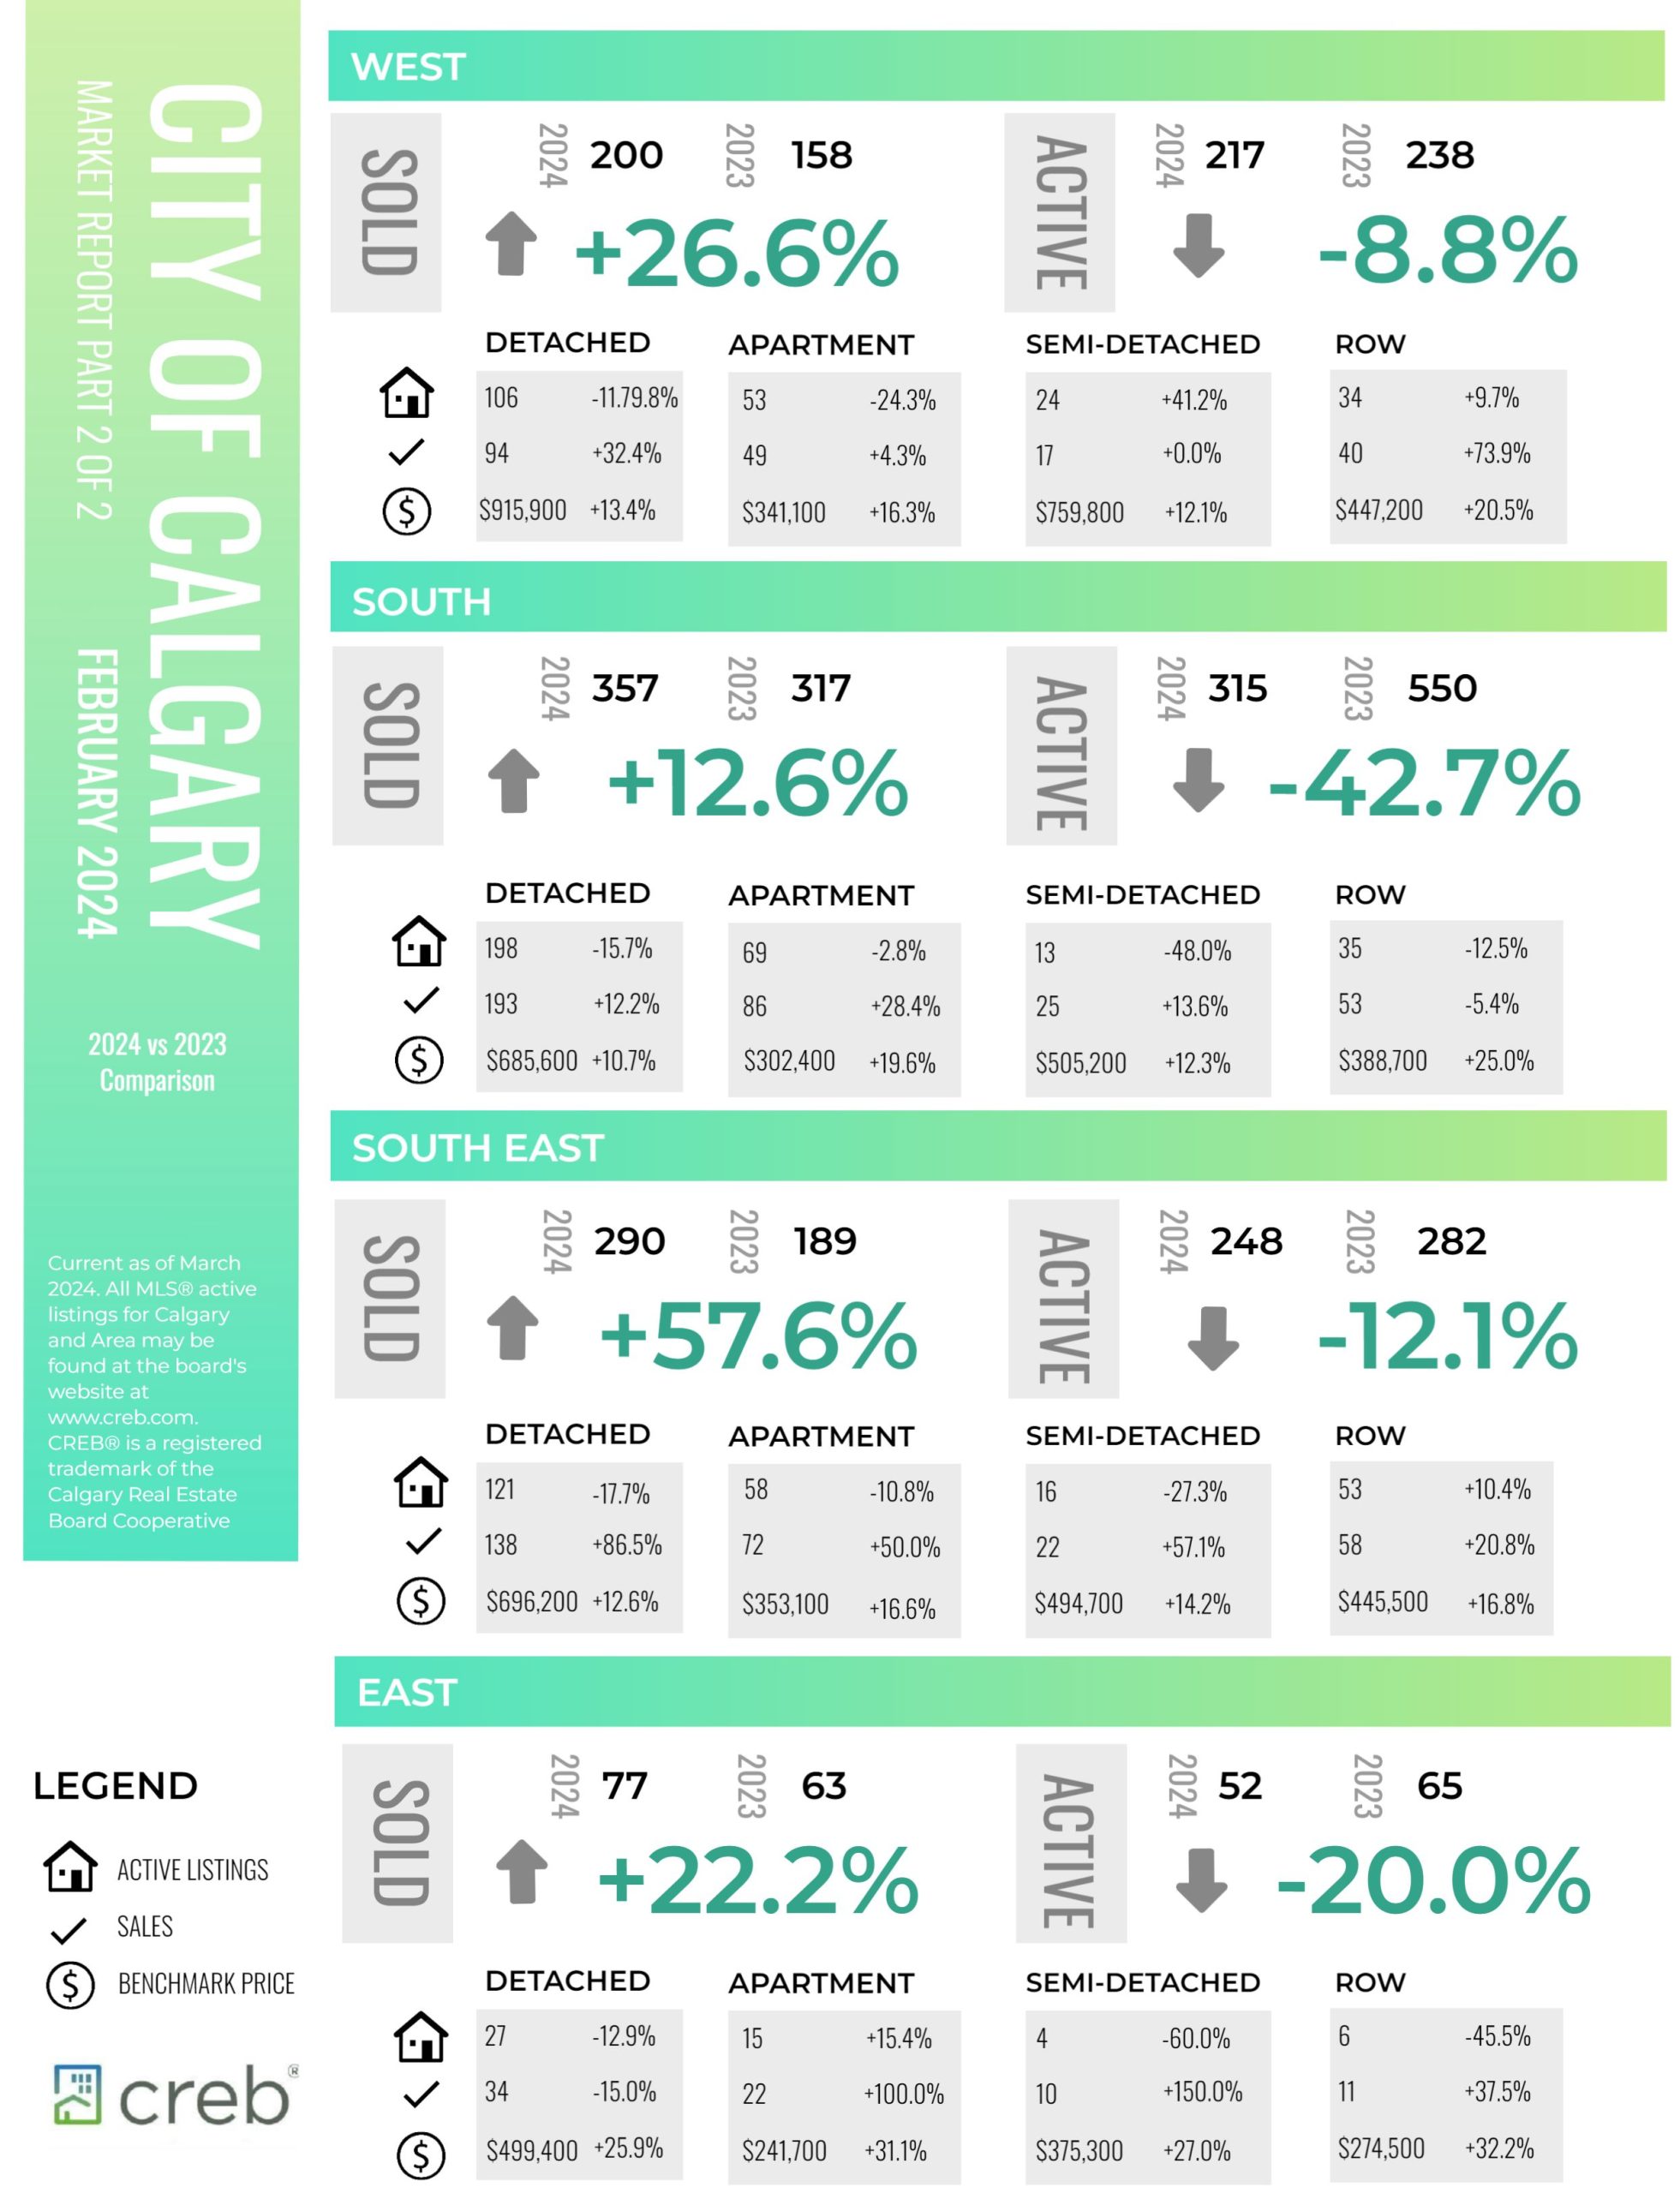
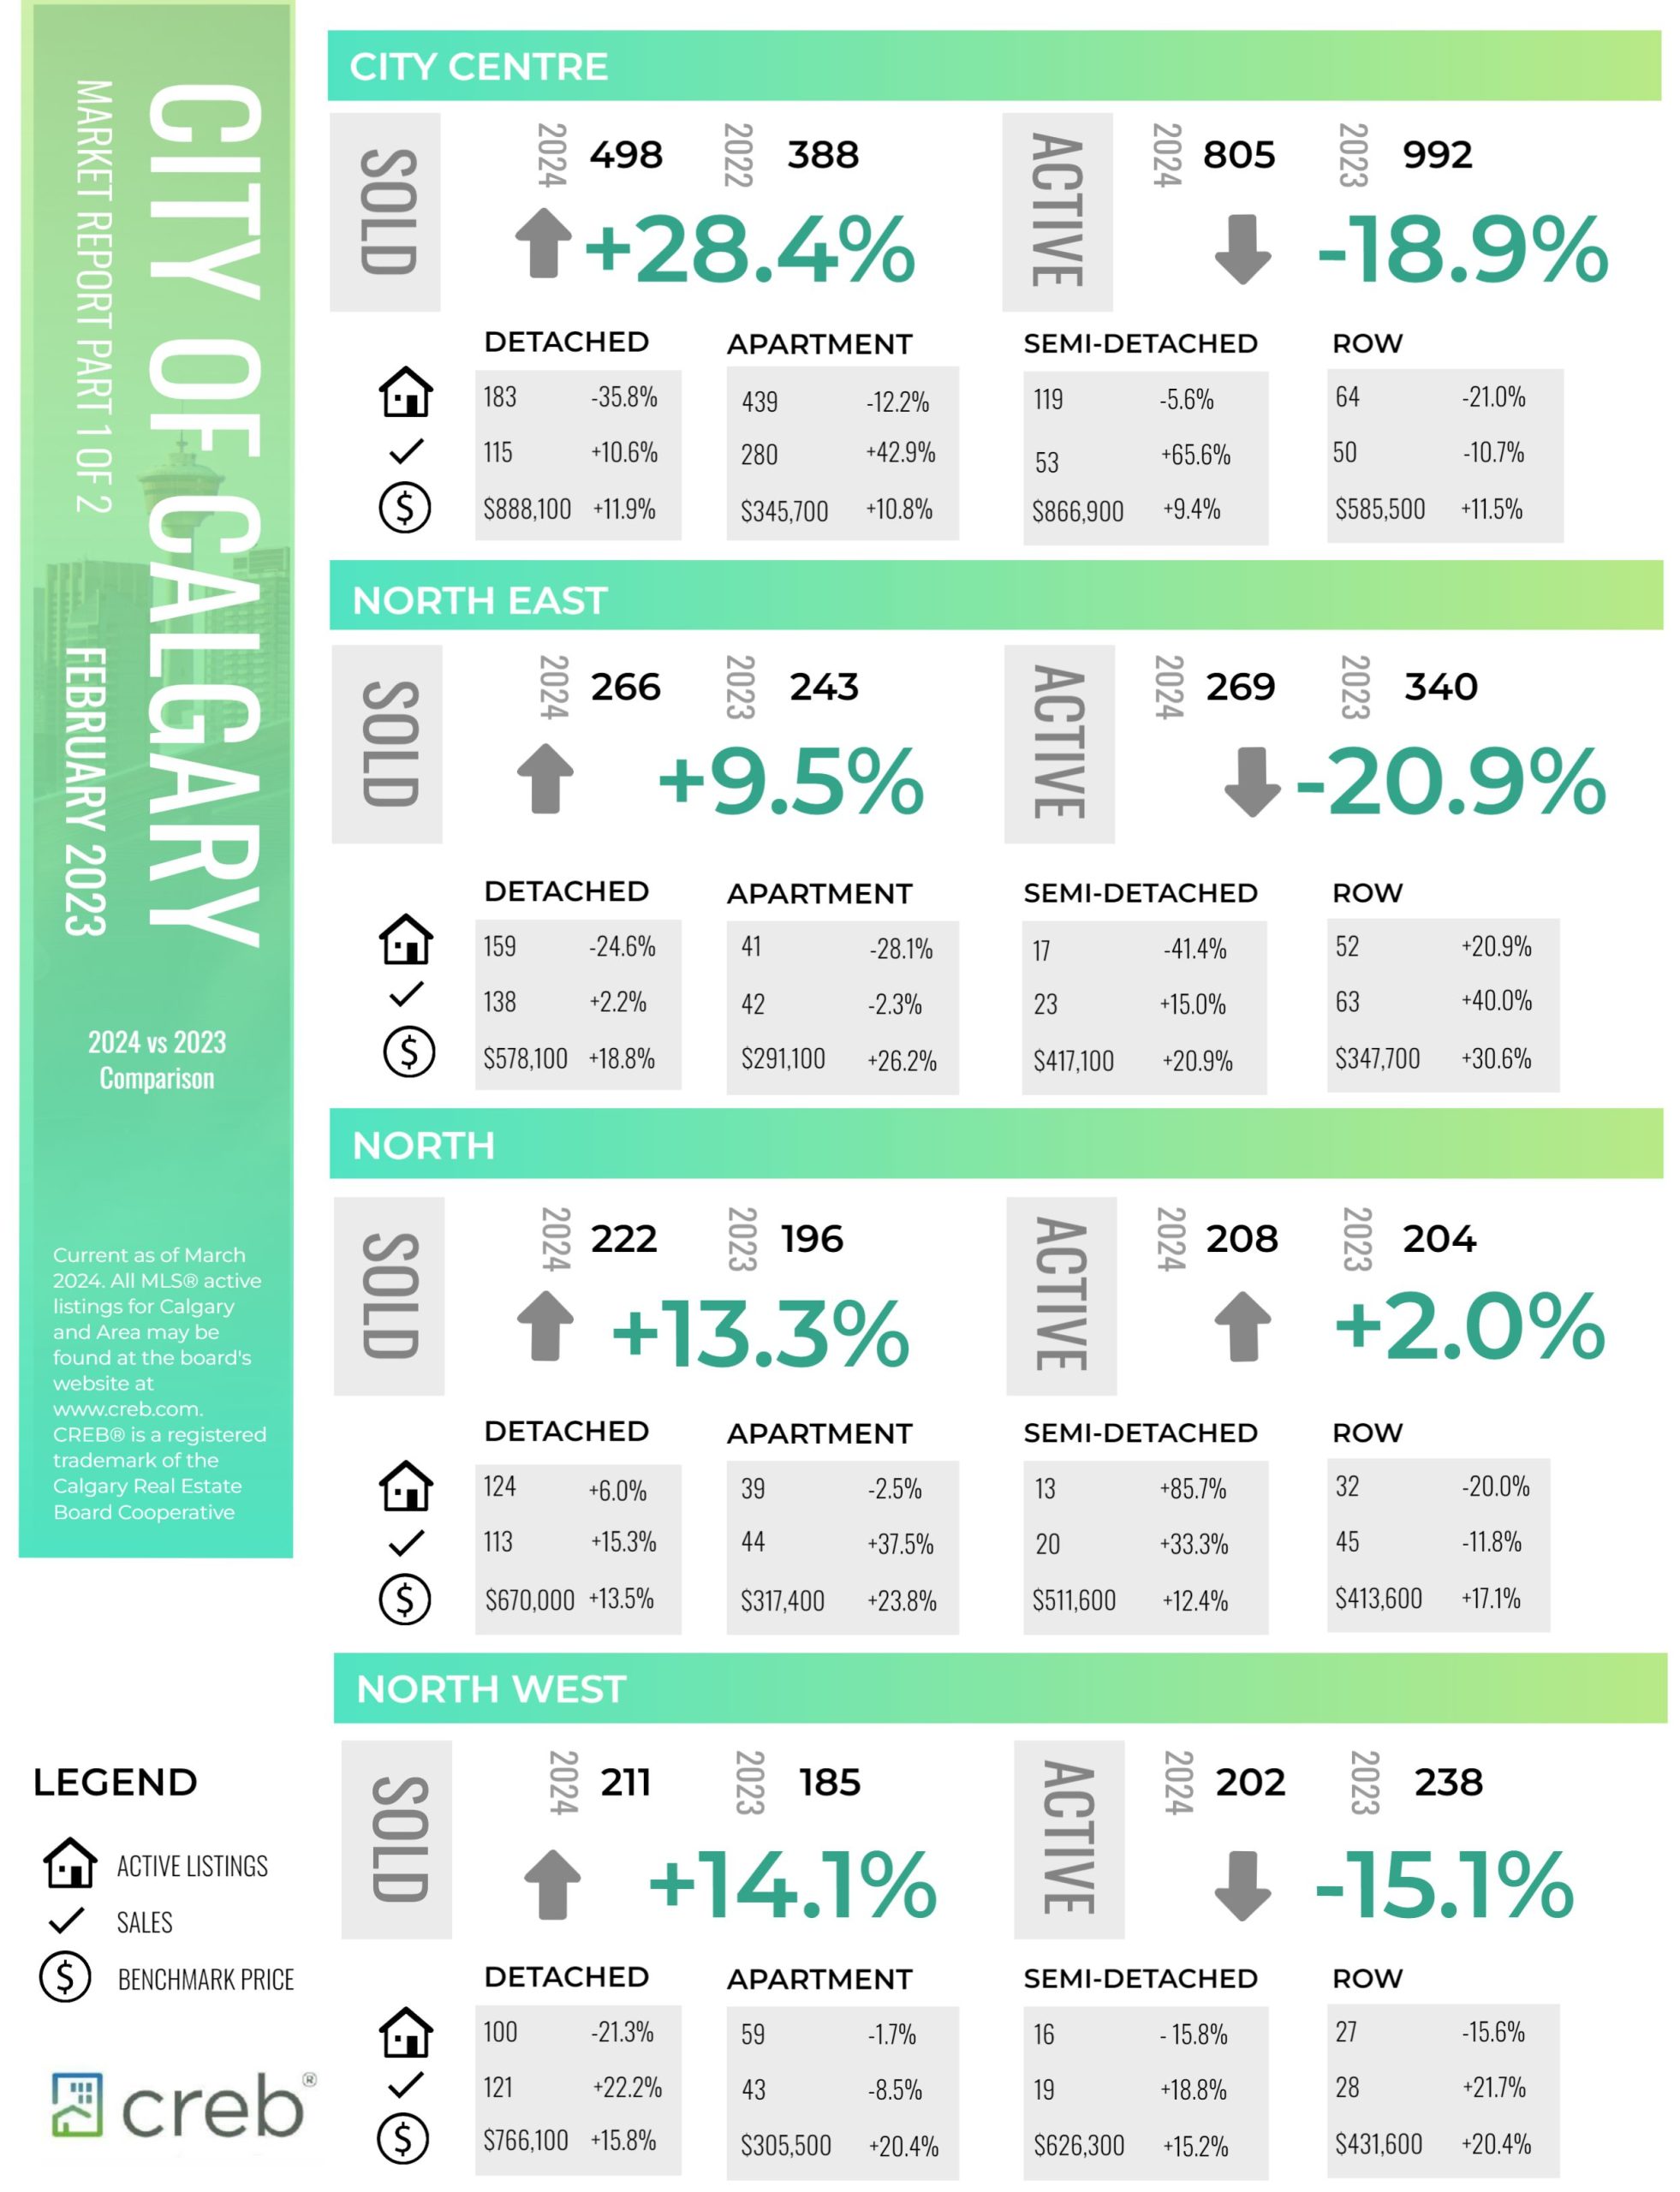
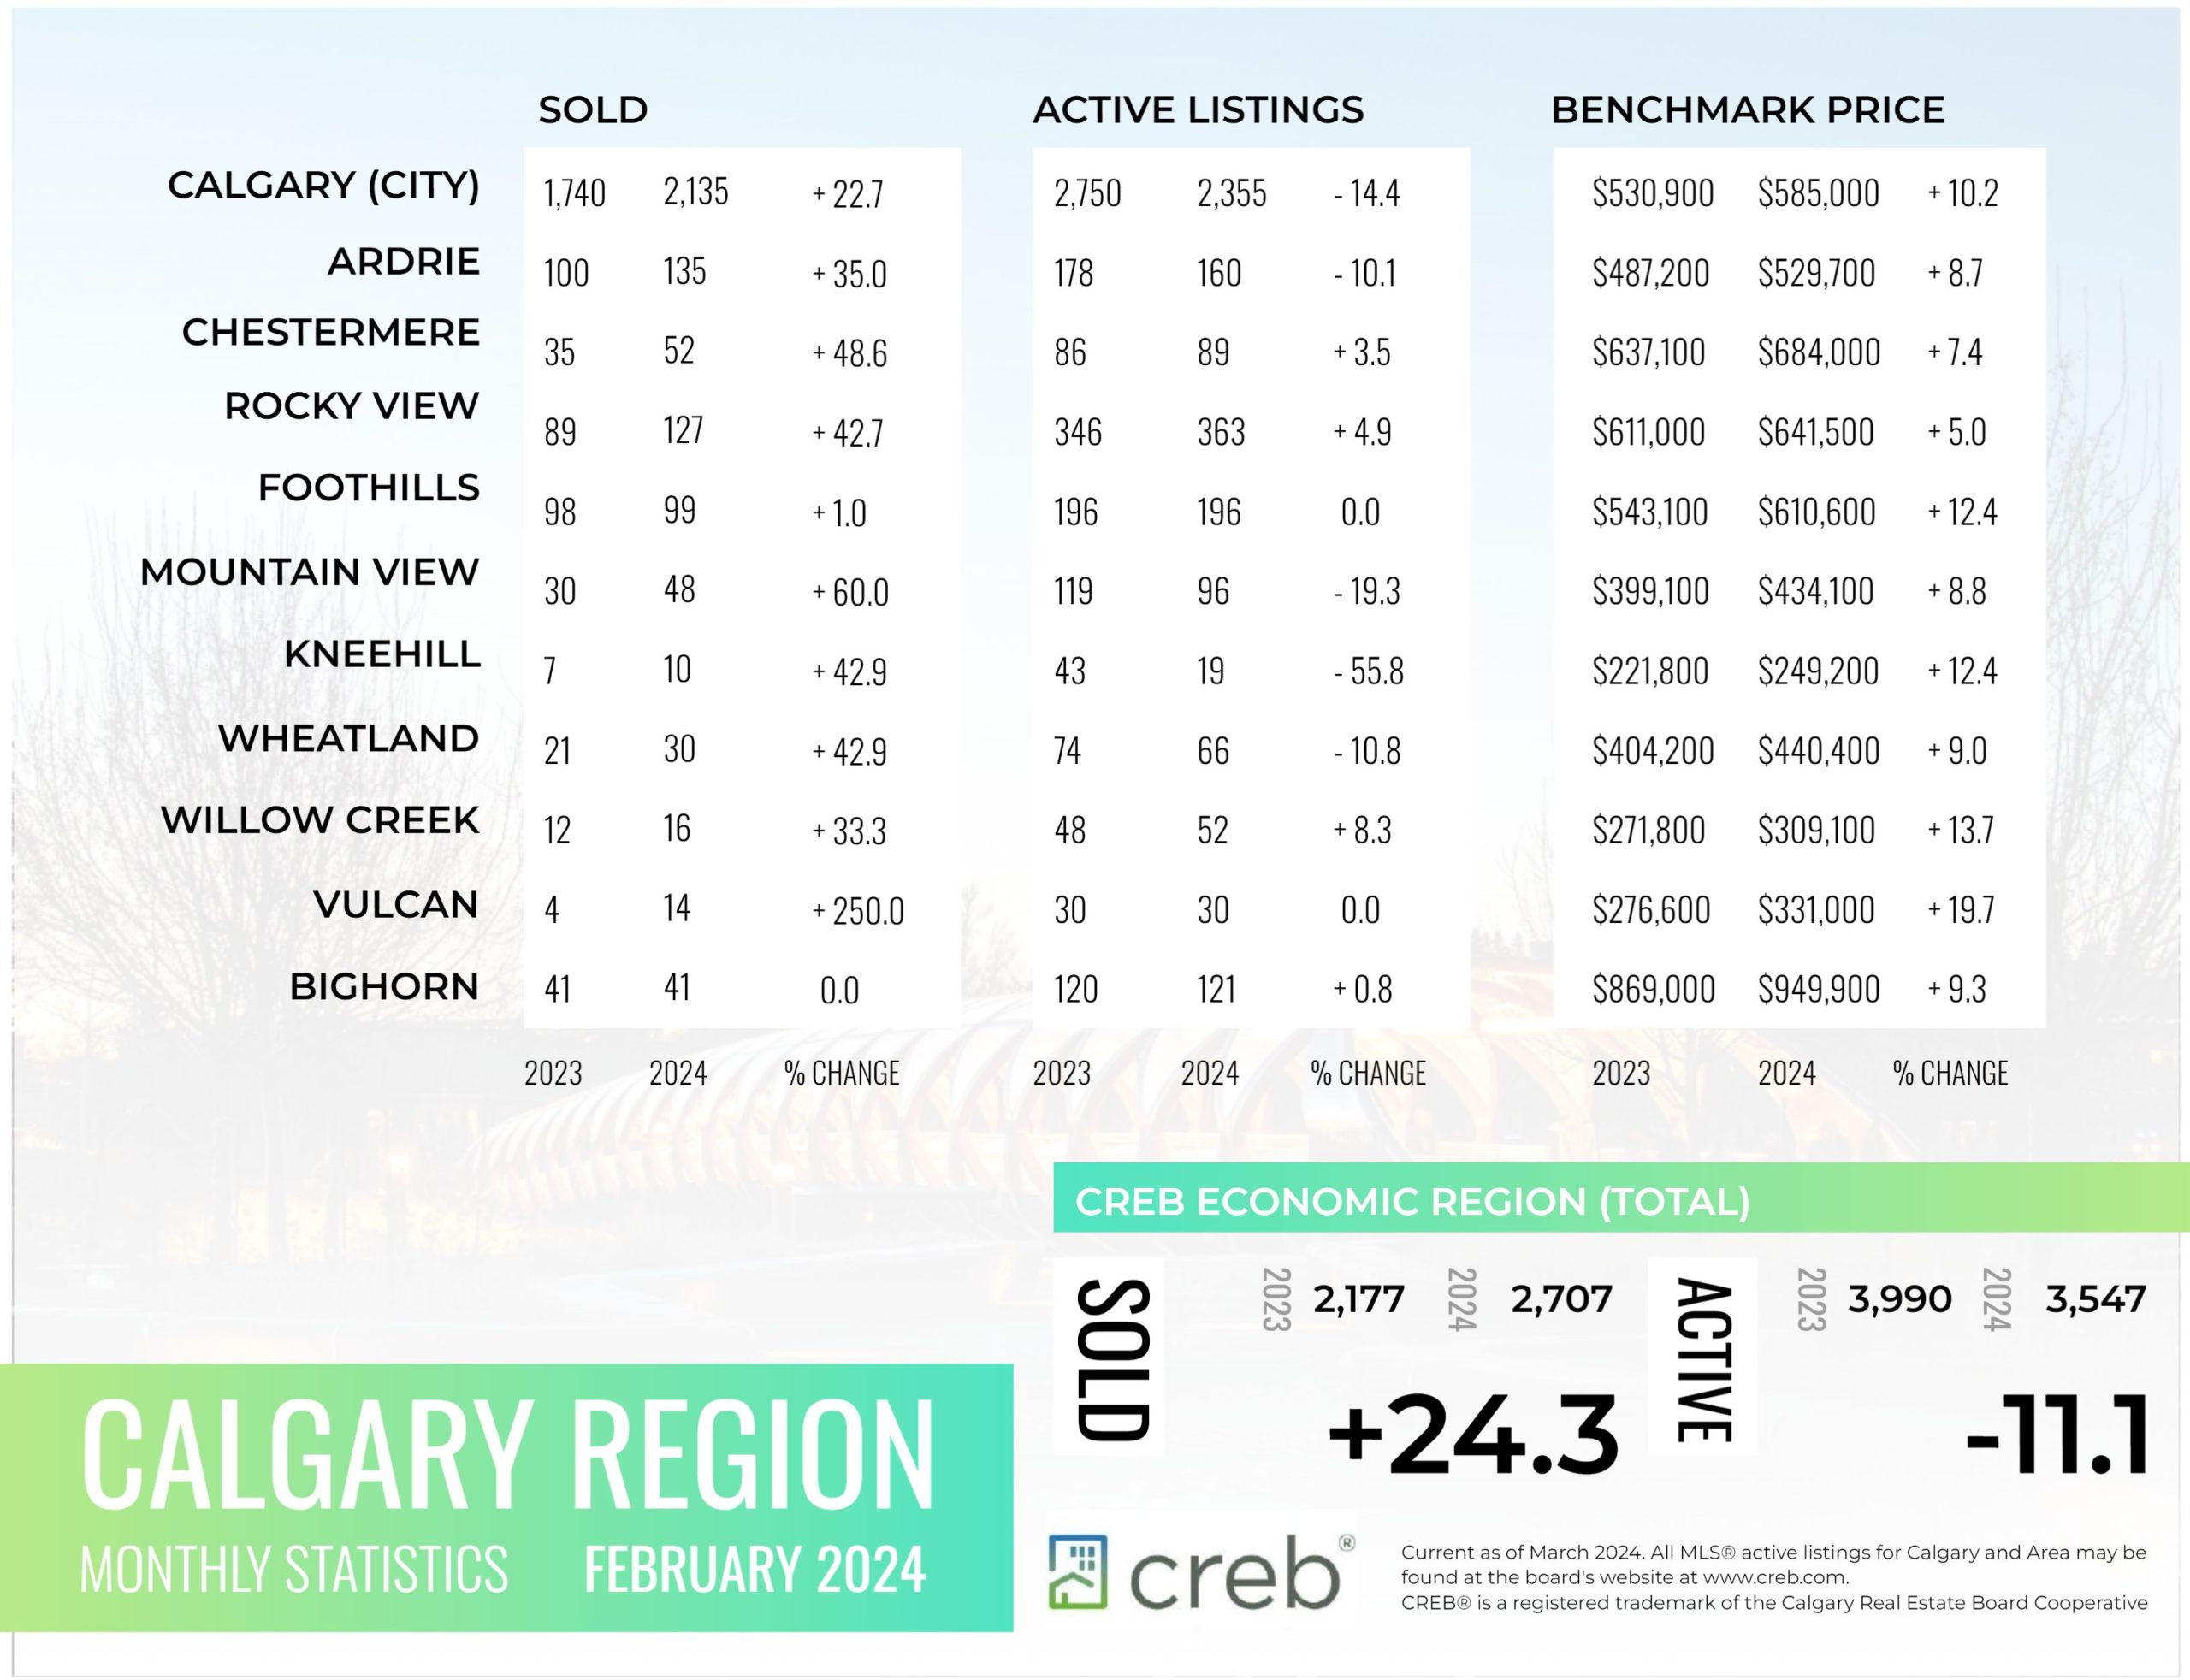
New listings continued to rise in February, reaching 2,711 units. However, the rise in new listings supported further growth in sales, which increased by nearly 23 per cent compared to last year for a total of 2,135 units. The shift in sales and new listings kept the sales to new listings ratio exceptionally high at 79 per cent ensuring inventories remained near historic lows.
Low supply and higher sales caused the months of supply to fall to just over one month, nearly as tight as levels seen during the spring of last year. “Purchasers are acting quickly when new supply comes onto the market, preventing inventory growth in the market,” said Ann-Marie Lurie, Chief Economist at CREB®.
“It is this strong demand and low supply that continues to drive price gains in Calgary. The biggest supply challenge is for homes priced under $500,000, which saw inventories fall by 31 per cent compared to last February. At the same time, we are starting to see supply levels rise for higher priced homes supporting more balanced conditions in the upper end.”
Read the full report on the CREB website!
The following data is a comparison between February 2024 and February 2023 numbers, and is current as of March 2024. For last month’s numbers, check out our previous infographic.
Or follow this link for all our CREB Infographics!
Click on the images for a larger view!
Download Printable Version – February 2024 CREB, City of Calgary Report Part 1
Download Printable Version – February 2024 CREB, City of Calgary Report Part 2
Download Printable Version – February 2024 CREB, Calgary Region Report
Last Updated on March 5, 2024 by myRealPage
