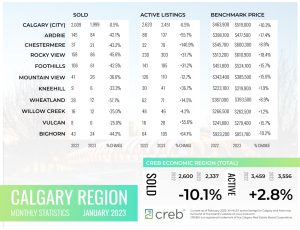
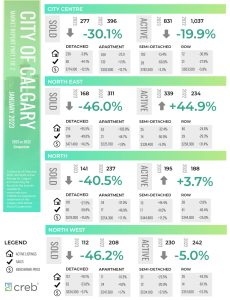
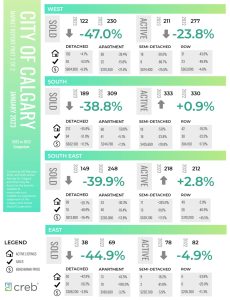
INFOGRAPHICS: January 2023 CREB City And Region Market Reports

Supply of lower-priced homes remains low for January
The level of new listings in January fell to the lowest levels seen since the late 90s. While new listings fell in nearly every price range, the pace of decline was higher for lower-priced properties.
At the same time, sales activity did slow compared to the high levels reported last year but remained consistent with long-term trends. However, there has been a shift in the composition of sales as detached homes only comprised 47 per cent of all sales.
“Higher lending rates are causing many buyers to seek out lower-priced products in our market,” said CREB® Chief Economist Ann-Marie Lurie. “However, the higher rates are likely also preventing some move-up activity in the market impacting supply growth for lower-priced homes. This is causing differing conditions in the housing market based on price range.”
Read the full report on the CREB website!
The following data is a comparison between January 2023 and January 2022 numbers, and is current as of February 2023. For last month’s numbers, check out our previous infographic.
Or follow this link for all our CREB Infographics!
Click on the images for a larger view!
Download Printable Version – January 2023 CREB, City of Calgary Report Part 1
Download Printable Version – January 2023 CREB, City of Calgary Report Part 2
Download Printable Version – January 2023 CREB, Calgary Region Report
Last Updated on November 28, 2023 by myRealPage


