INFOGRAPHICS: January 2024 CREB City And Region Market Reports

January sees strong sales fueled by boost in new listings
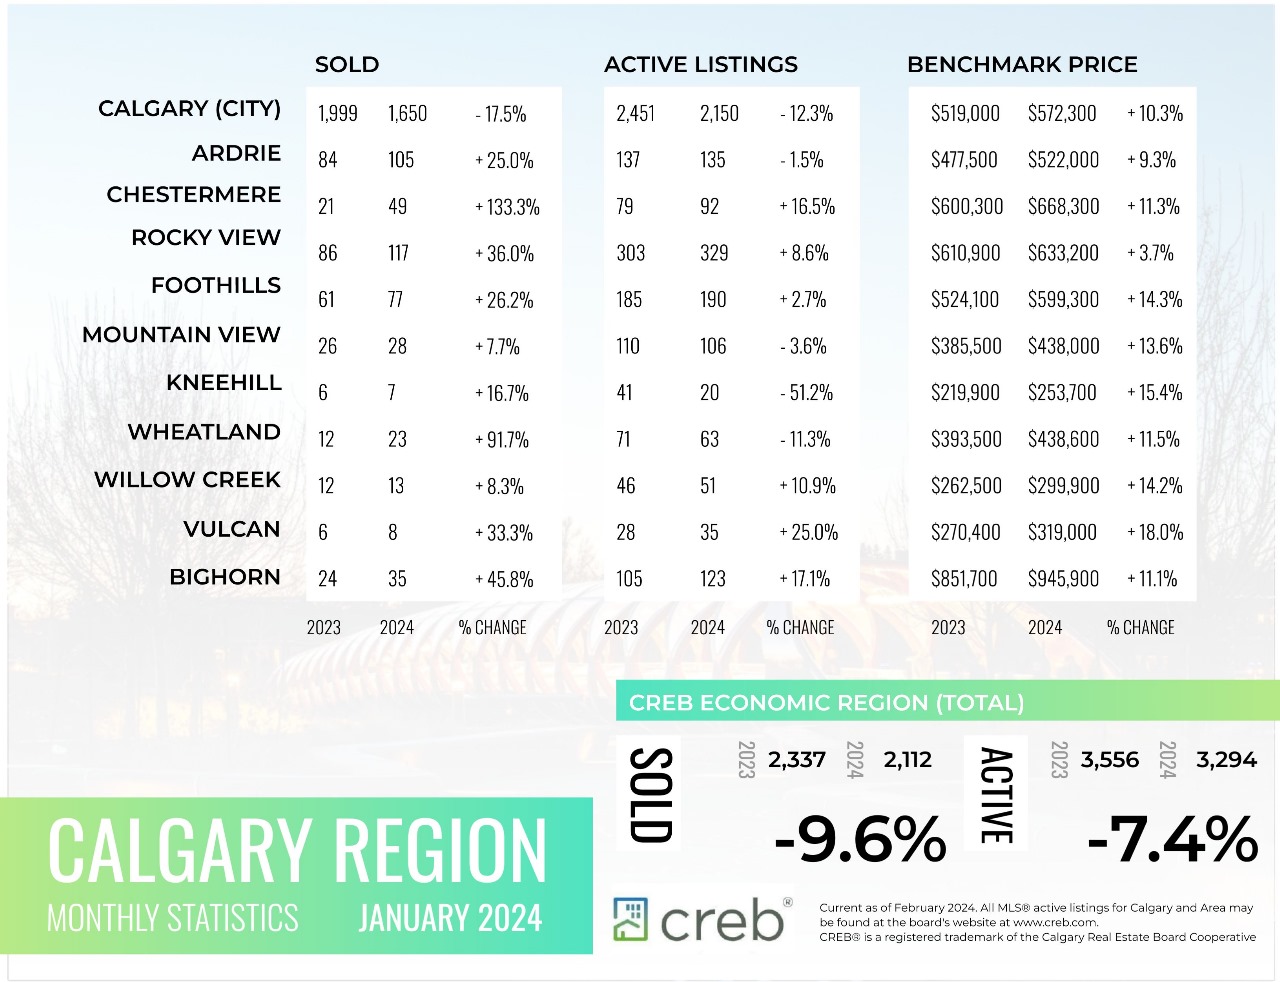
January sales rose to 1,650 units, a significant gain over last year’s levels and long-term trends. The growth was possible thanks to a rise in new listings totalling 2,137 units in January. New listings rose for homes priced above $300,000, but the largest gains occurred for homes priced above $700,000.
The rise in new listings relative to sales did little to change the low inventory situation in the city. With 2,150 units in inventory, levels are near the January record lows set in 2006 and are nearly 49 per cent below the long-term average for the month.
“Supply challenges have been a persistent problem since last year. This month’s gain in new listings has helped provide options to potential purchasers, supporting sales growth. However, the growth in sales prevented any significant adjustments in supply, keeping conditions tight and supporting further price growth,” stated Ann-Marie Lurie, Chief Economist at CREB®.
Read the full report on the CREB website!
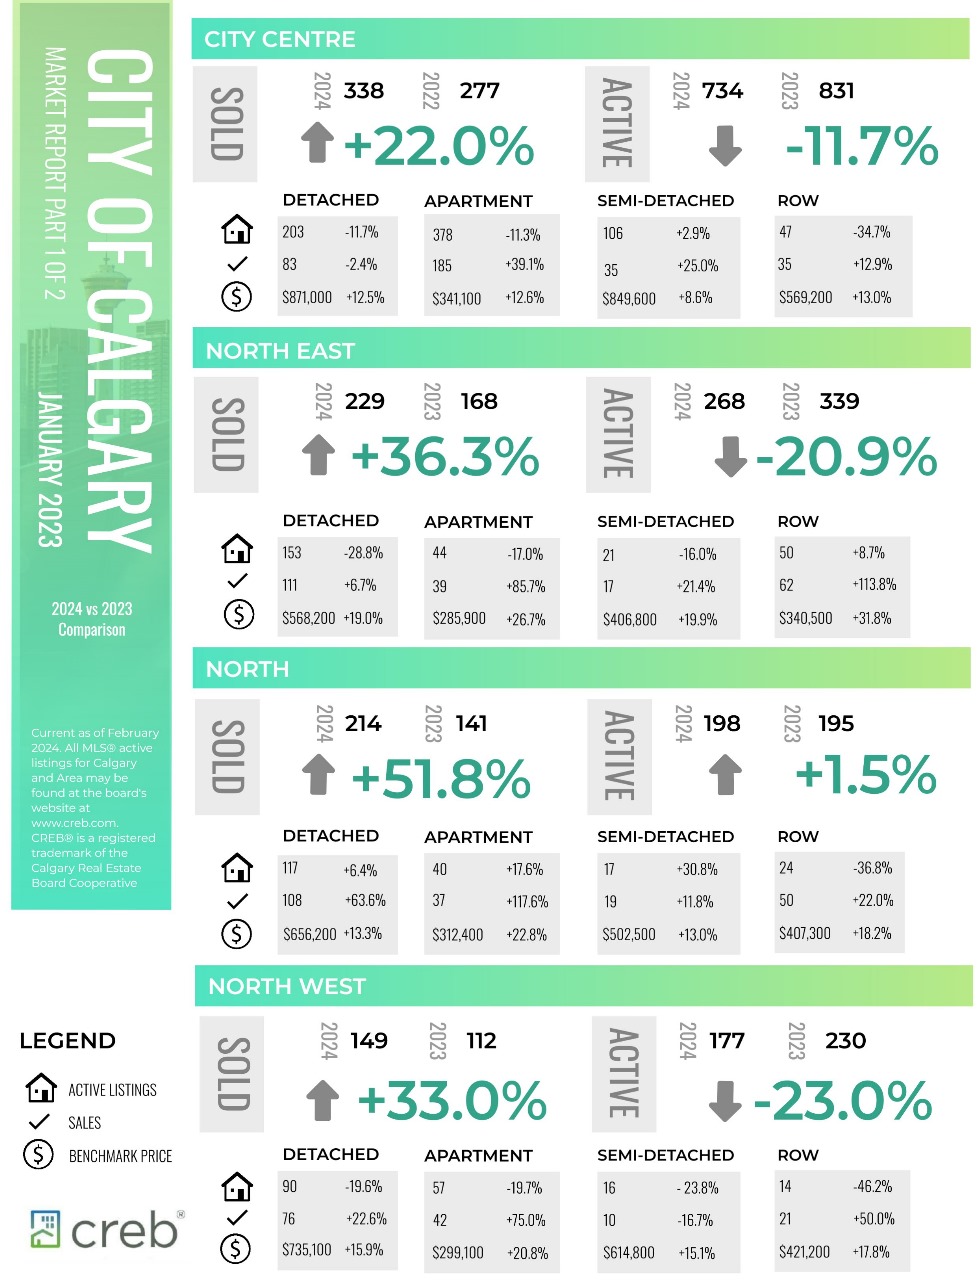
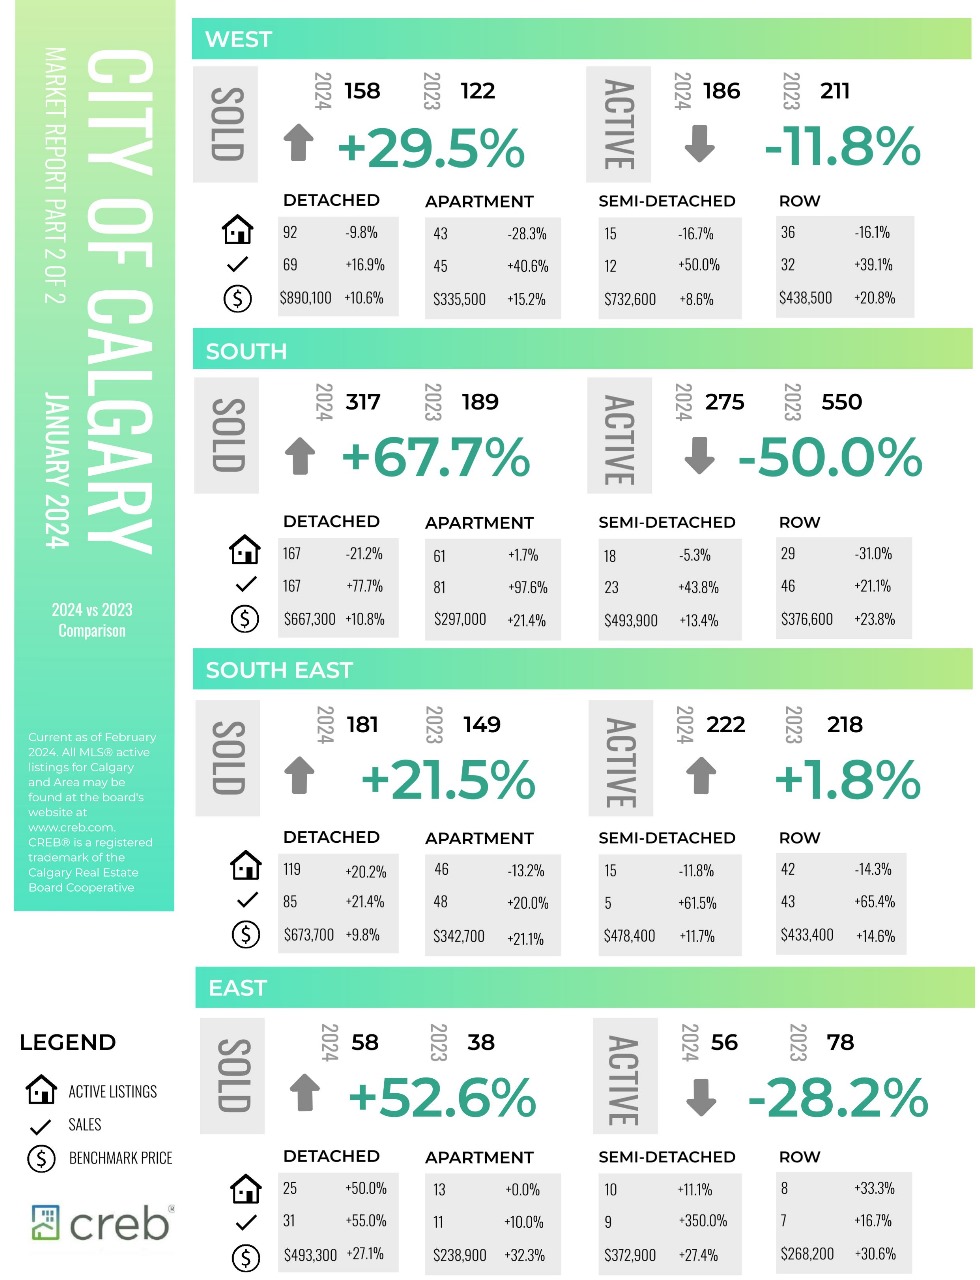
The following data is a comparison between January 2024 and January 2023 numbers, and is current as of February 2024. For last month’s numbers, check out our previous infographic.
Or follow this link for all our CREB Infographics!
Click on the images for a larger view!
Download Printable Version – January 2024 CREB, City of Calgary Report Part 1
Download Printable Version – January 2024 CREB, City of Calgary Report Part 2
Download Printable Version – January 2024 CREB, Calgary Region Report
Last Updated on February 2, 2024 by myRealPage
