INFOGRAPHICS: July 2023 CREB City And Region Market Reports

Calgary home prices reach new heights: July sees seventh consecutive monthly gain
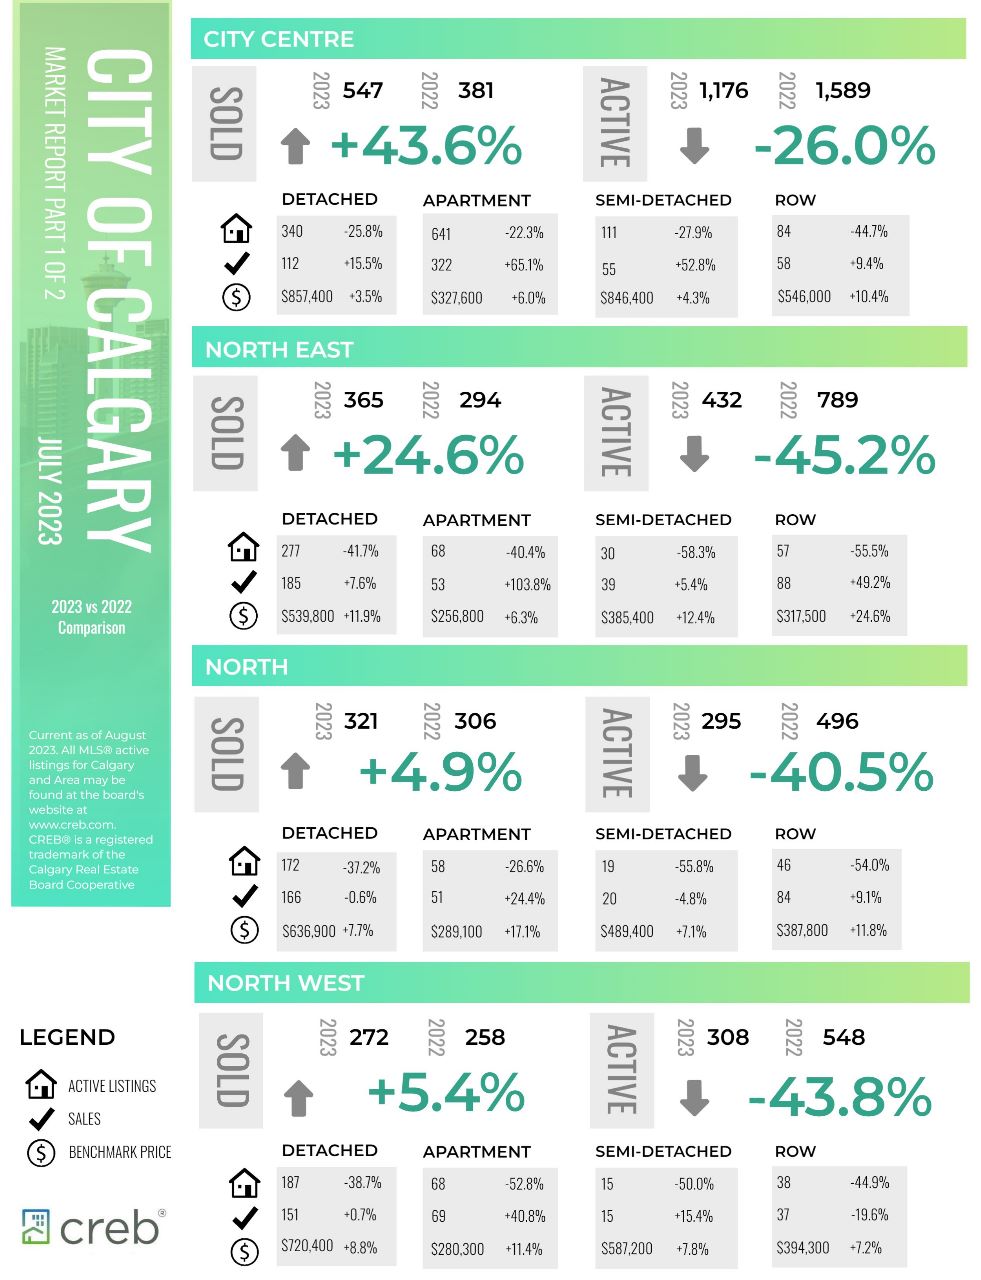
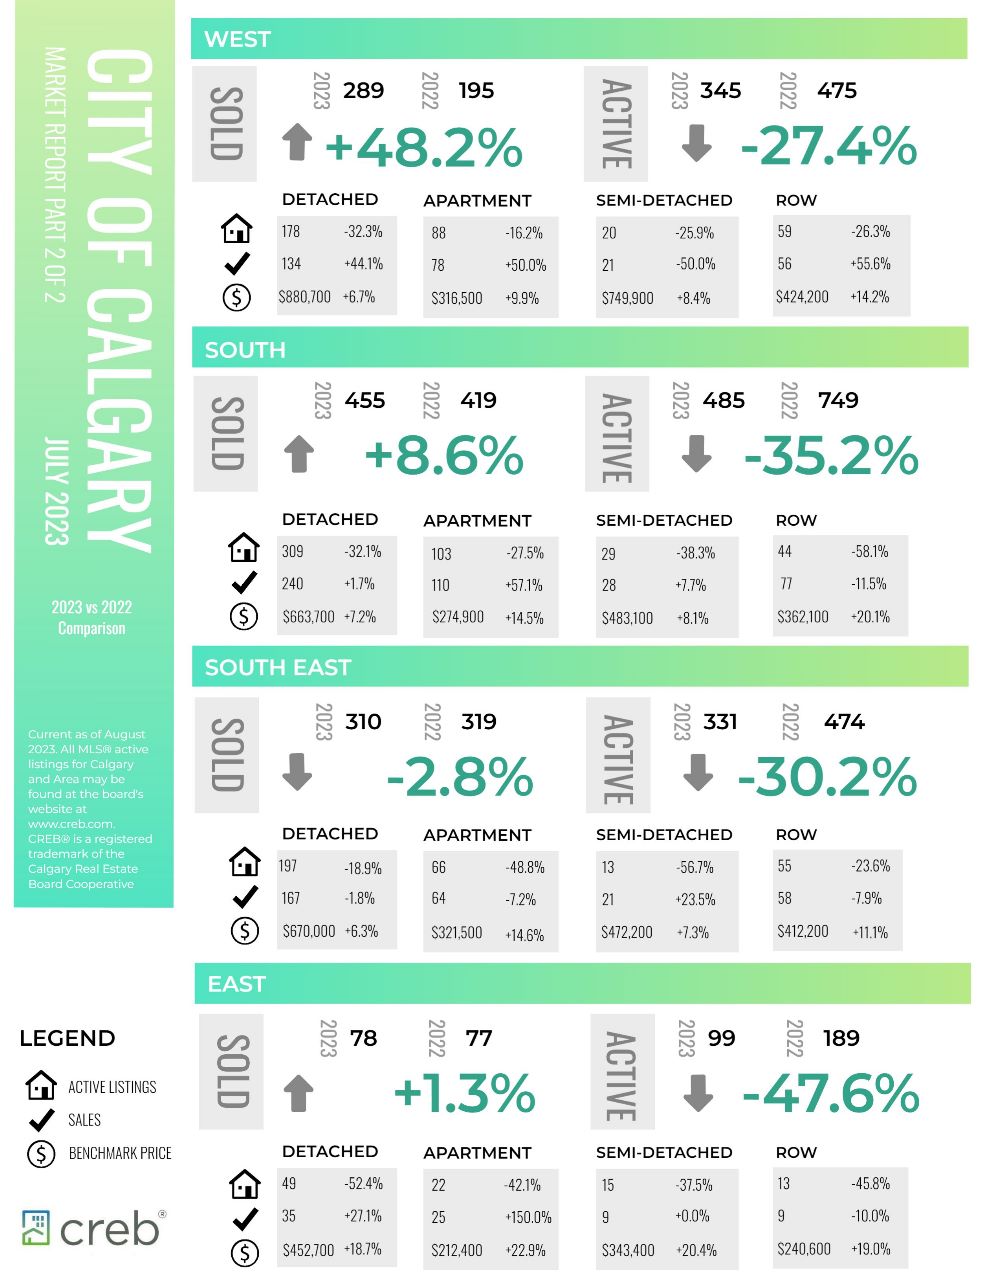
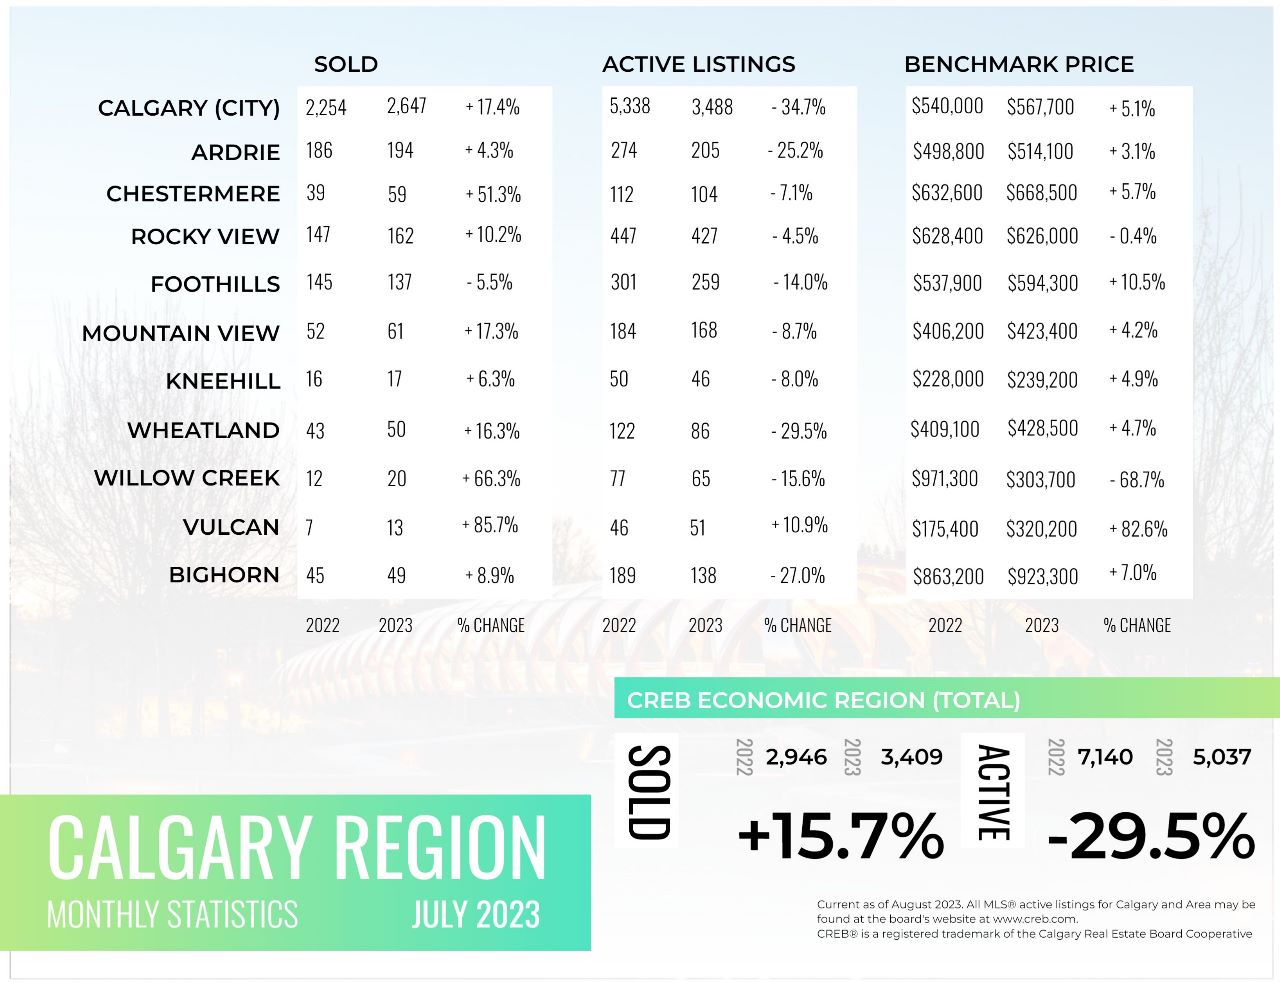
Rising rates had little impact on sales this month as the 2,647 sales represented a year-over-year gain of 18 per cent, reflecting the strongest July levels reported on record. The record-setting pace has been driven mainly by significant gains in the relatively affordable apartment condominium sector. Despite recent gains, year-to-date sales have declined by 19 per cent over last year.
In line with seasonal expectations, sales and new listings trended down compared to last month. However, this had minimal impact on inventory levels, which remained near the July record low set in 2006. With a sales-to-new-listings ratio of 82 per cent and a months of supply of 1.3 months, conditions continue to favour the seller.
“Continued migration to the province, along with our relative affordability, has supported the stronger demand for housing despite higher lending rates,” said CREB® Chief Economist Ann-Marie Lurie. “At the same time, we continue to struggle with supply in the resale, new home and rental markets resulting in further upward pressure on home prices.”
Read the full report on the CREB website!
The following data is a comparison between July 2023 and July 2022 numbers, and is current as of August 2023. For last month’s numbers, check out our previous infographic.
Or follow this link for all our CREB Infographics!
Click on the images for a larger view!
Download Printable Version – July 2023 CREB, City of Calgary Report Part 1
Download Printable Version – July 2023 CREB, City of Calgary Report Part 2
Download Printable Version – July 2023 CREB, Calgary Region Report
Last Updated on November 28, 2023 by myRealPage


