INFOGRAPHICS: February 2020 VIREB Vancouver Island Market Reports

Spring is almost upon us, and it’s time for our monthly market updates for areas covered by the Vancouver Island Real Estate Board (VIREB)!
As noted in their latest media release, February has seen higher sales, which can be taken as a positive sign.
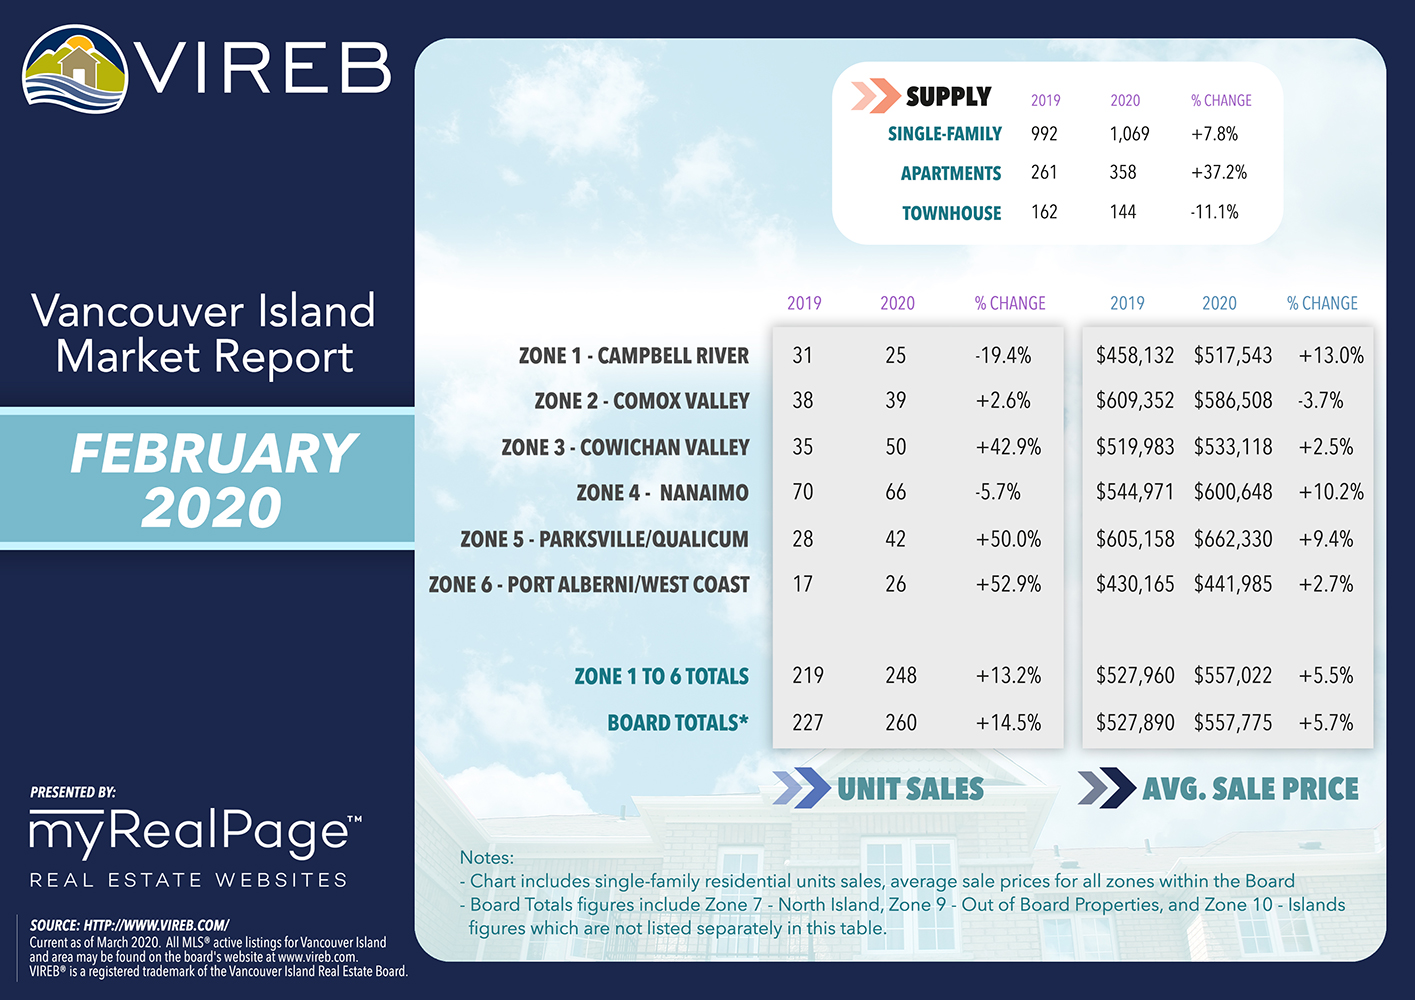
Sales of single-family homes in the VIREB area last month rose by 15% year over year and were 49% higher than in January.
Last month, 260 single-family homes sold on the Multiple Listing Service® (MLS®) System compared to 174 in January and 227 one year ago. Apartment sales in February dropped by 19% year over year, while the number of townhouses sold decreased by 10% from one year ago.
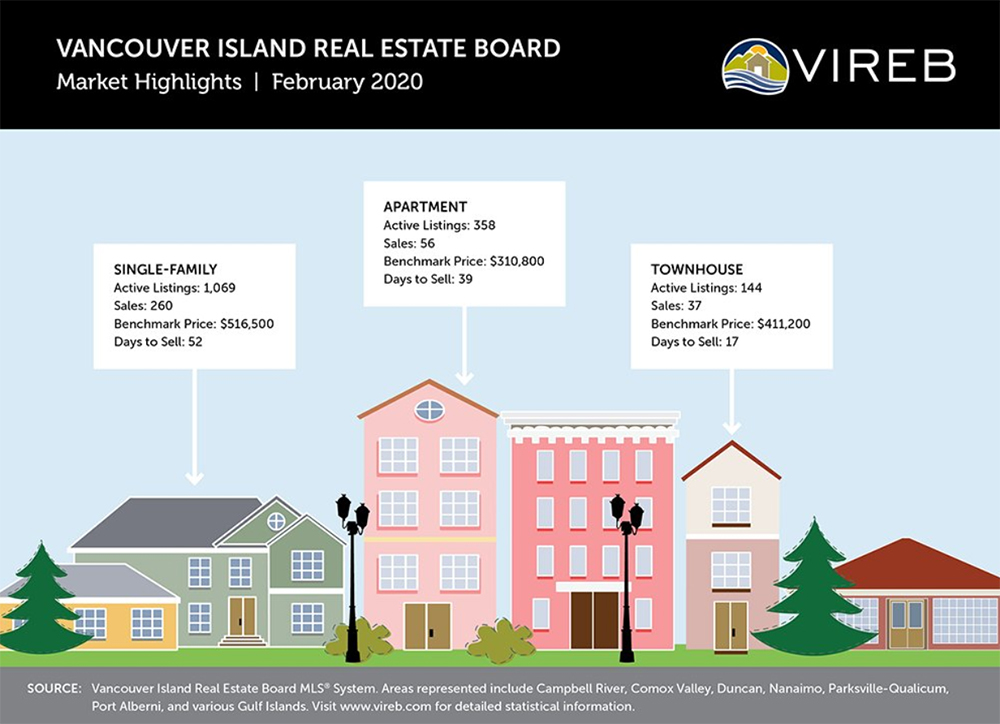
Inventory of single-family homes last month rose by eight% from one year ago (992 to 1,069). Active listings of apartments rose by 37% (261 to 358) year over year, while townhouse inventory dropped by 11% (162 to 144).
The benchmark price of a single-family home board-wide was $516,500 in February, a 3% increase from one year ago and marginally higher than in January. (Benchmark pricing tracks the value of a typical home in the reported area.) In the apartment category, the year-over-year benchmark price rose by 5%, hitting $310,800, which is slightly higher than the previous month. The benchmark price of a townhouse in February rose by 2% year over year and was a bit higher than in January, climbing to $411,200.
Regionally, the benchmark price of a single-family home in the Campbell River area last month was $442,000, an increase of 4% over last year. In the Comox Valley, the benchmark price reached $517,600, up by 2% from one year ago. Duncan reported a benchmark price of $479,300, an increase of 4% from February 2019. Nanaimo’s benchmark price rose by 3% to $564,700 in February, while the Parksville-Qualicum area saw its benchmark price drop slightly to $578,300. The cost of a benchmark single-family home in Port Alberni reached $321,100 in February, a 4% increase from one year ago.
Due to VIREB’s broad geographic area, what is a trend in one market may not be in another. For example, REALTORS® in some zones are seeing multiple offers that benefit sellers, while other markets are more balanced. However, VIREB’s board-wide February sales are a positive sign that buyers are feeling optimistic as we head into spring, which is historically a busy time for real estate.
Another positive outcome is Minister of Finance Bill Morneau’s announcement regarding changes to the benchmark rate used to determine the minimum qualifying rate for insured mortgages. Guideline B-20, also known as the mortgage stress test, significantly reduced the purchasing power of some buyers and pushed others to the sidelines.
The following data is a comparison between February 2019 and February 2020 numbers, and is current as of March 2020. Click here to check out last month’s infographics.
You can also view all our VIREB infographics by clicking here.
Click on the images for a larger view!
(Protip: Make sure to grab the printable PDF versions, too! It fits best when printed on A4-sized sheets, AND we’ve added an area on the sheet where you can attach your business card! 🙂 )
Download Printable Version – February 2020 VIREB Market Report
(Image Source: VIREB Twitter)
Last Updated on July 25, 2022 by myRealPage
