INFOGRAPHICS: February 2018 Greater Vancouver Market Reports

Based on the latest reports from the Real Estate Board of Greater Vancouver (REBGV), we present to you some infographics on how the market is doing within North Vancouver, West Vancouver, Vancouver East, and Vancouver West.
According to the latest release:
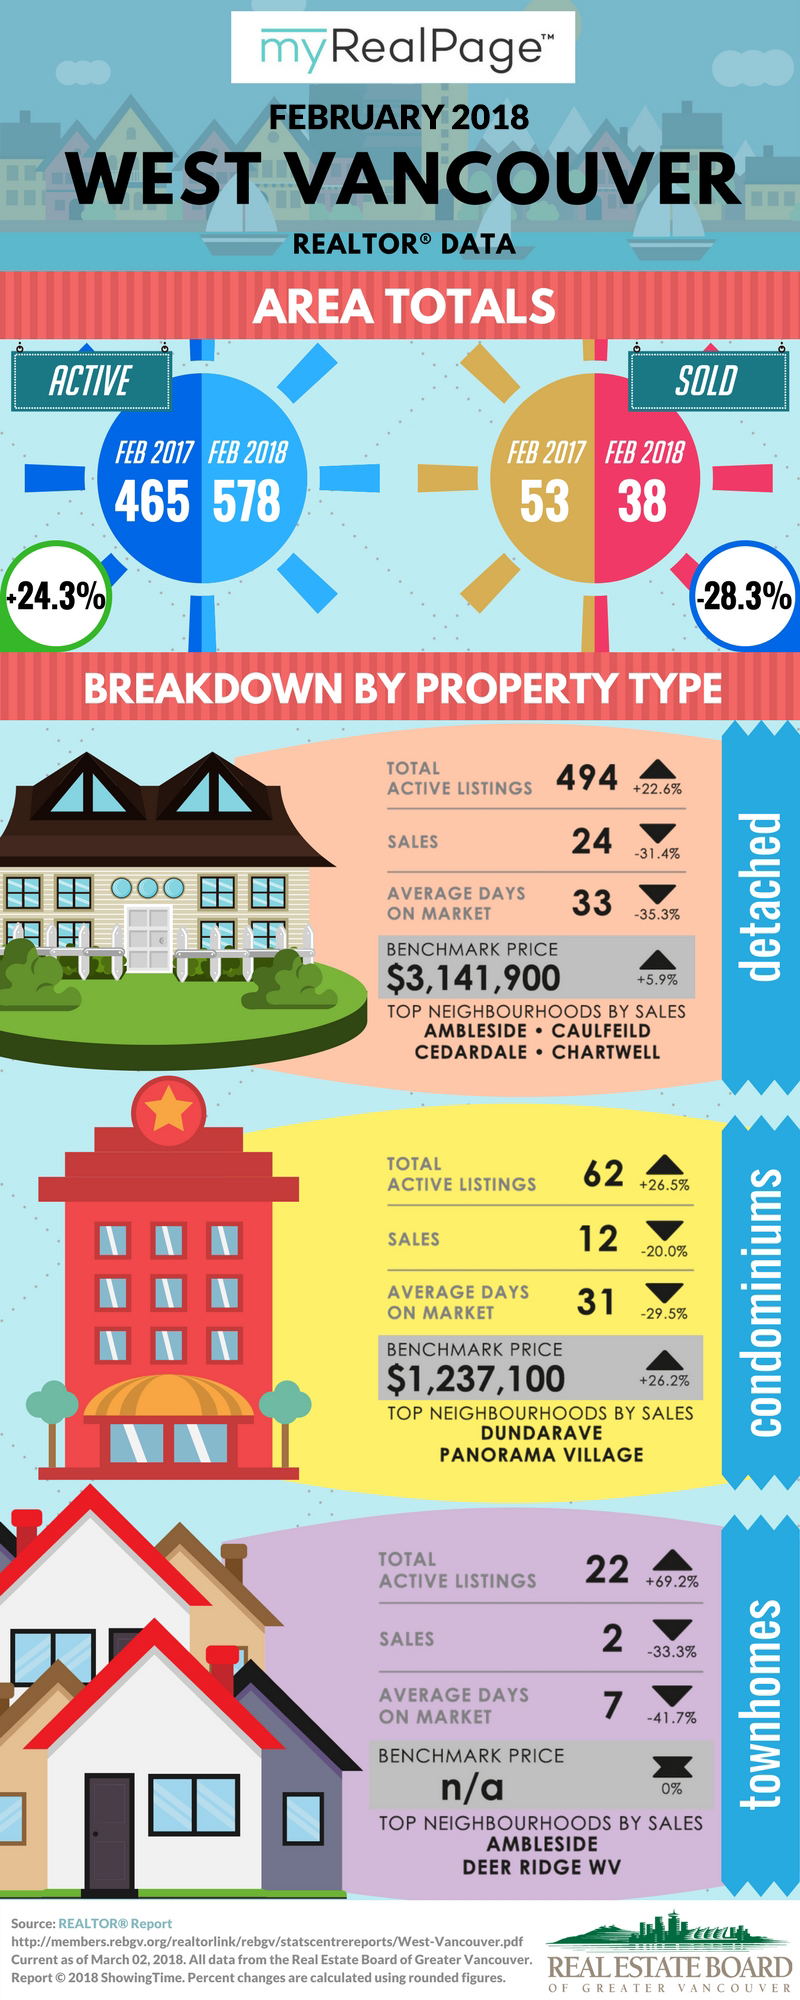
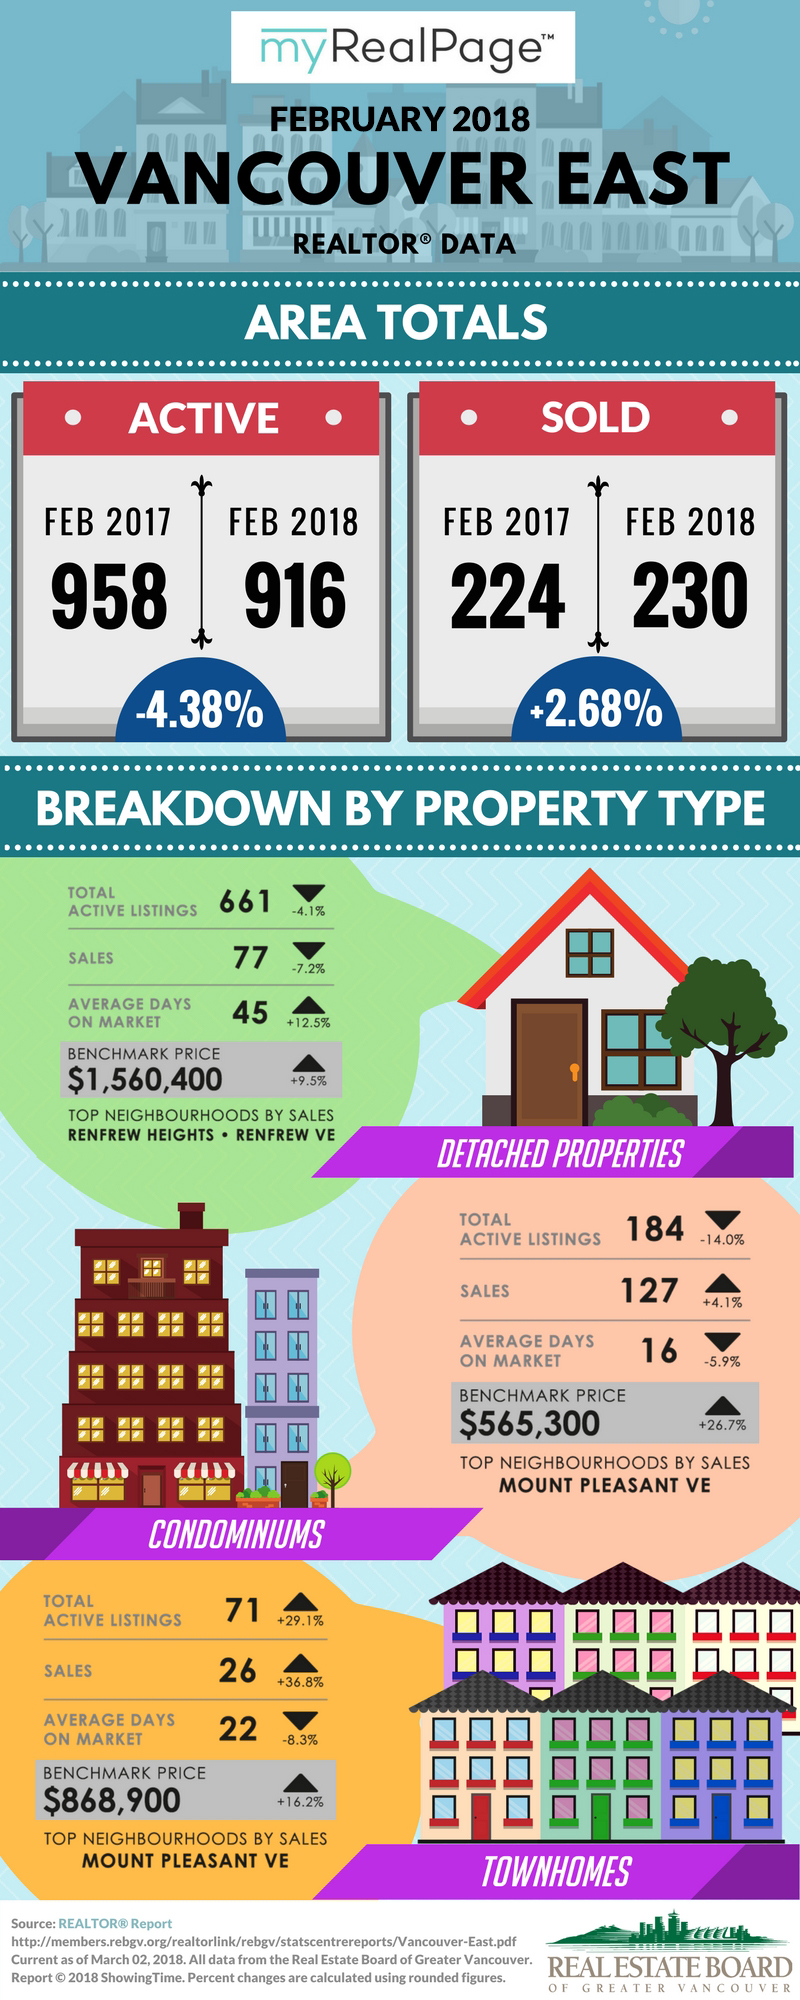
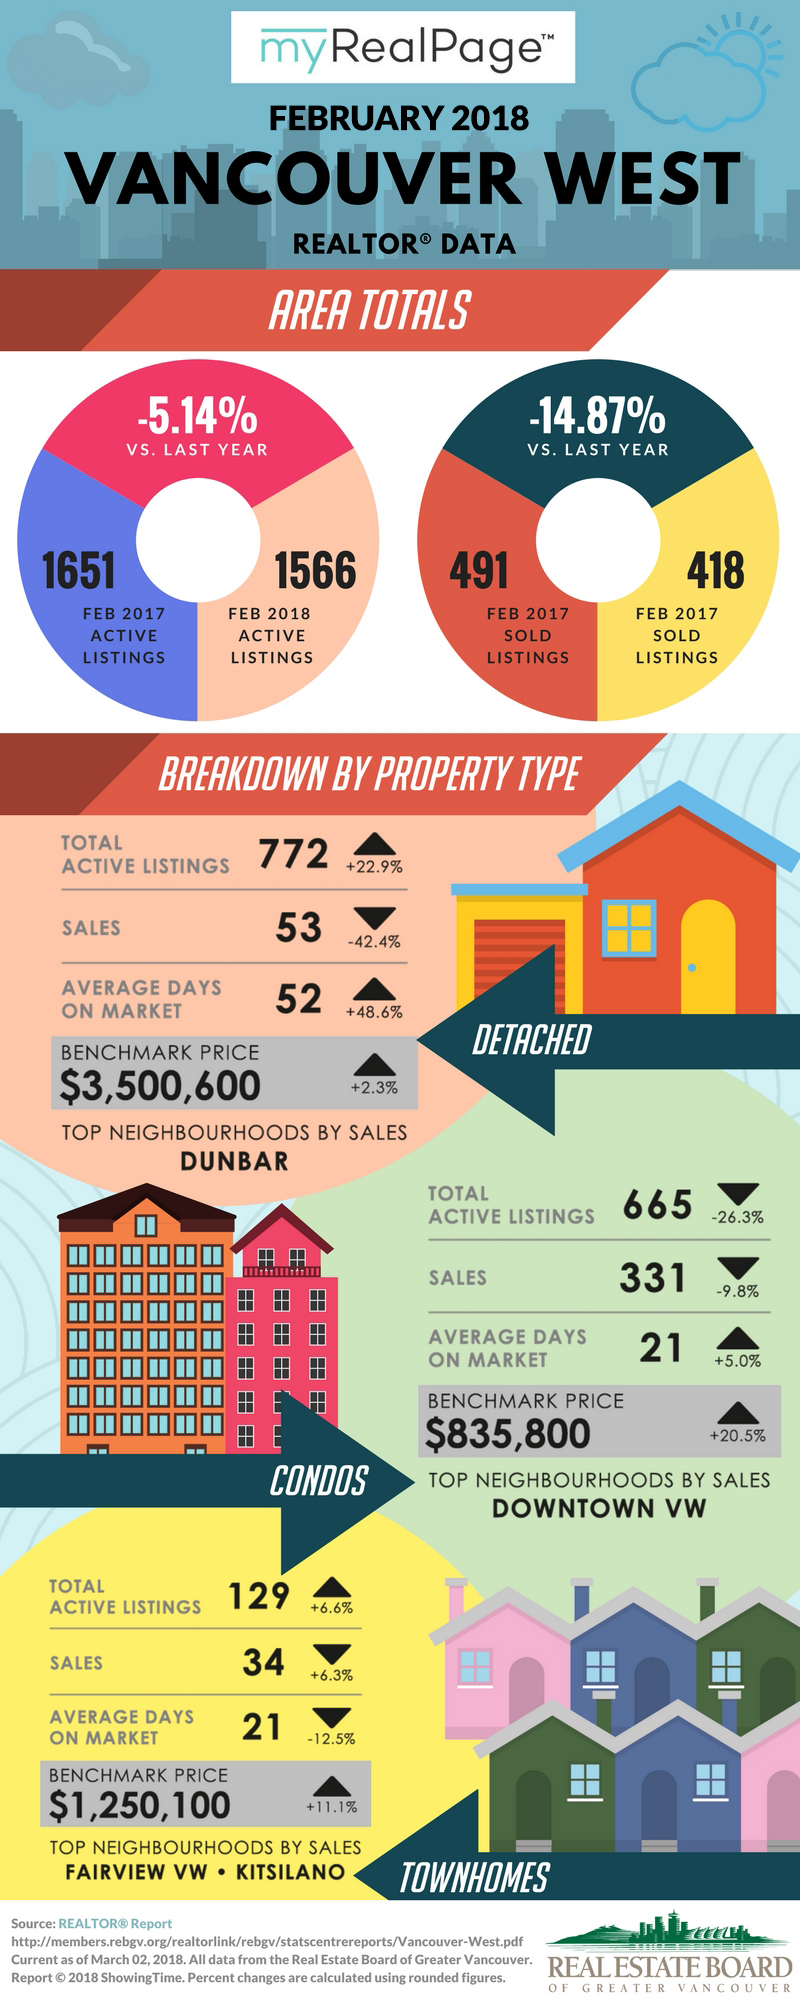
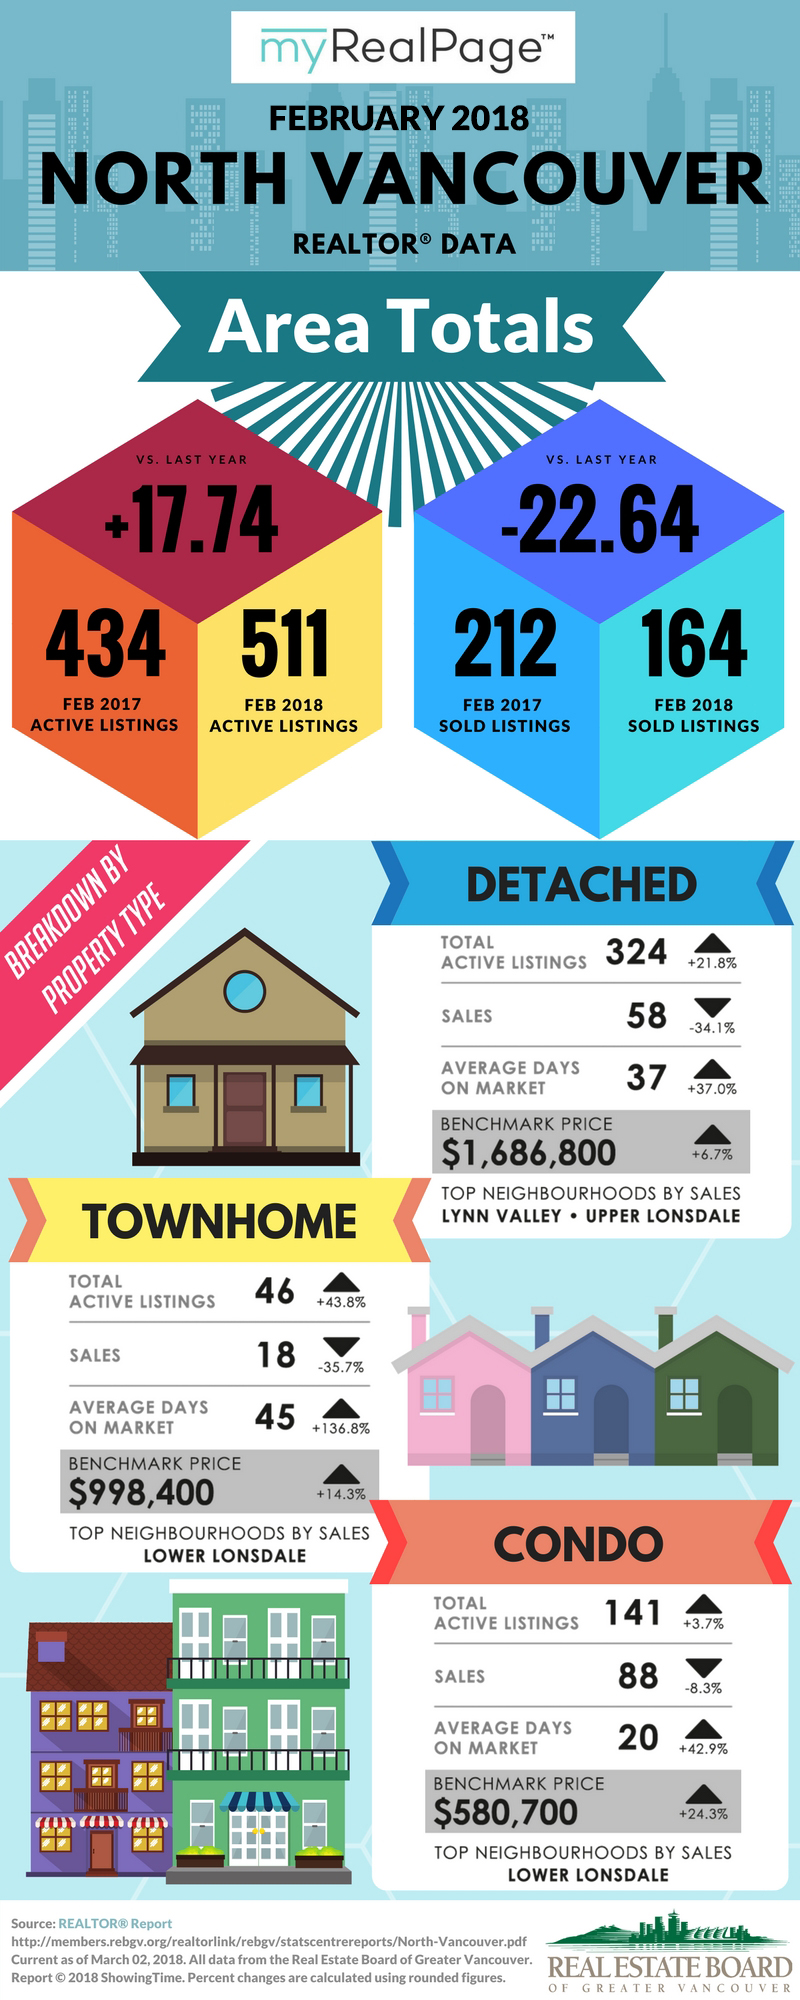
Last month’s sales were 14.4 per cent below the 10-year February sales average. By property type, detached sales were down 39.4 per cent over the same period, attached sales were down 6.8 per cent, and apartment sales were 5.5 per cent above the 10-year February average.
“Rising interest rates and stricter mortgage requirements have reduced home buyers’ purchasing power, particularly for those at the entry level of our market,” Jill Oudil, REBGV president said. “Even still, the supply of apartment and townhome properties for sale today is unable to meet demand. On the other hand, our detached home market is beginning to enter buyers’ market territory.”
Oudil has also added that though Spring is usually the busiest season for home buyers and sellers, “We’ll wait to see how they react to the taxes and other policy measures that our provincial and federal governments have introduced so far this year.”
The following data is a comparison between February 2017 and February 2018 numbers, and is current as of March 2018.
Click on the images for a larger view!
Or follow this link for all our REBGV Infographics!
Download Printable Version – West Vancouver
Download Printable Version – Vancouver East
Download Printable Version – Vancouver West
Download Printable Version – North Vancouver
Last Updated on July 25, 2022 by myRealPage
