INFOGRAPHICS: April 2023 REBGV Greater Vancouver Market Reports

Prices continue rising as home buyer confidence returns
With listing activity remaining below historical norms, home sales in Metro Vancouver1 have mounted a surprising comeback, rising near levels seen last spring, before eight consecutive interest rate hikes eroded borrowing power and brought home sales activity down along with it.
The Real Estate Board of Greater Vancouver (REBGV) reports that residential home sales in the region totalled 2,7412 in April 2023, a 16.5 per cent decrease from the 3,281 sales recorded in April 2022, and 15.6 per cent below the 10-year seasonal average (3,249).
“The fact we are seeing prices rising and sales rebounding this spring tells us home buyers are returning with confidence after a challenging year for our market, with mortgage rates roughly doubling. The latest MLS HPI® data show home prices have increased about five per cent year-to-date, which already outpaces our forecast of one to two per cent by year-end. The year is far from over, however, and it remains to be seen if these price increases will be sustained into 2024.”
Andrew Lis, REBGV director of economics and data analytics
Read the full report on the REBGV website!
The following data is a comparison between April 2023 and April 2022 numbers, and is current as of May 2023. For last month’s update, you can check out our previous post!
Or follow this link for all our REBGV Infographics!
These infographics cover current trends in several areas within the Greater Vancouver region. Click on the images for a larger view!
Printable Version – REBGV April 2023 Data Infographic Report North Vancouver
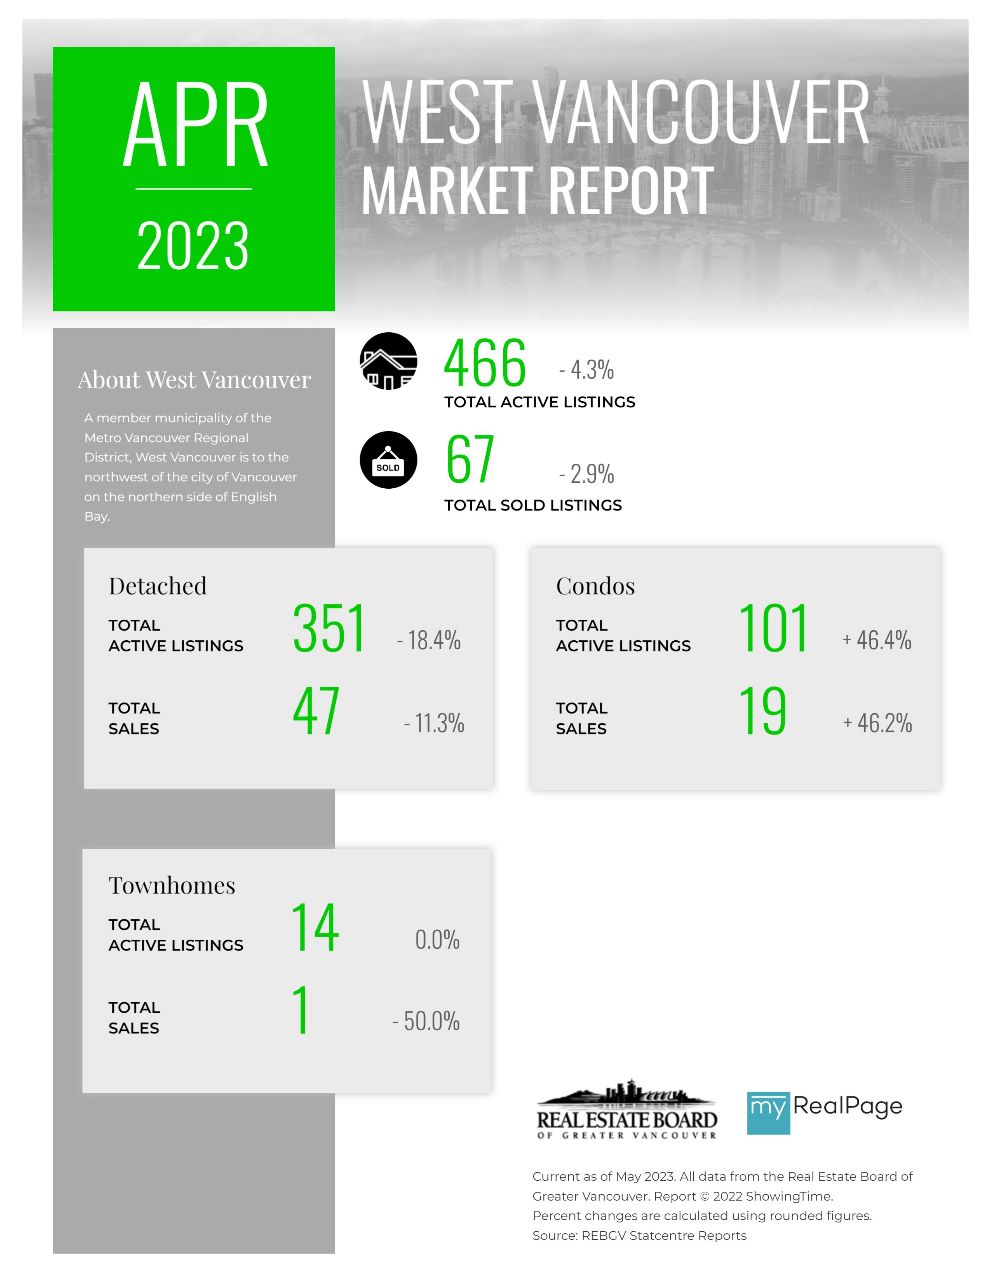
Printable Version – REBGV April 2023 Data Infographics Report West Vancouver
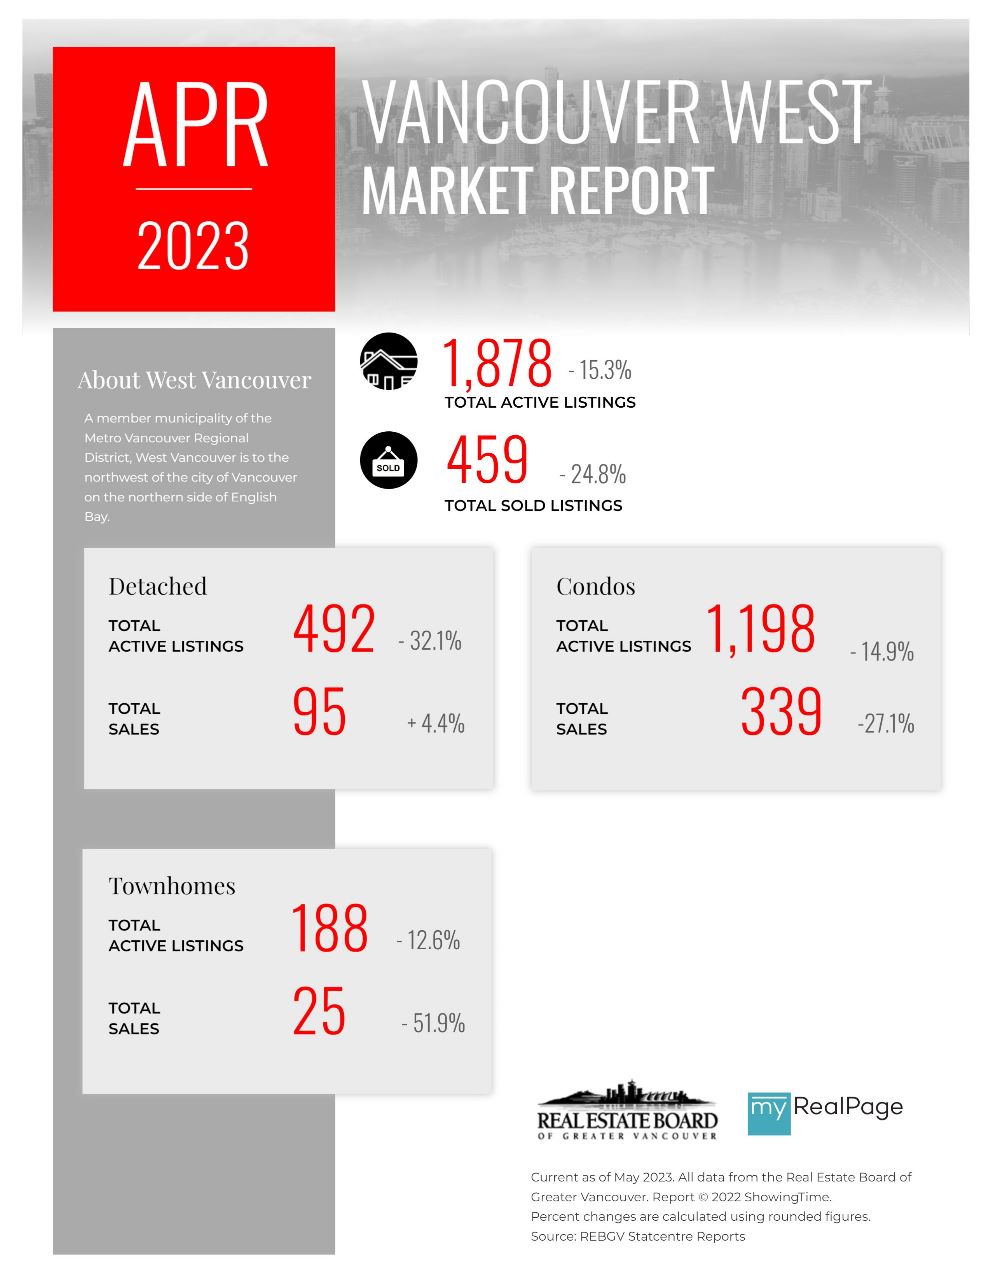
Printable Version – REBGV April 2023 Data Infographics Report Vancouver West
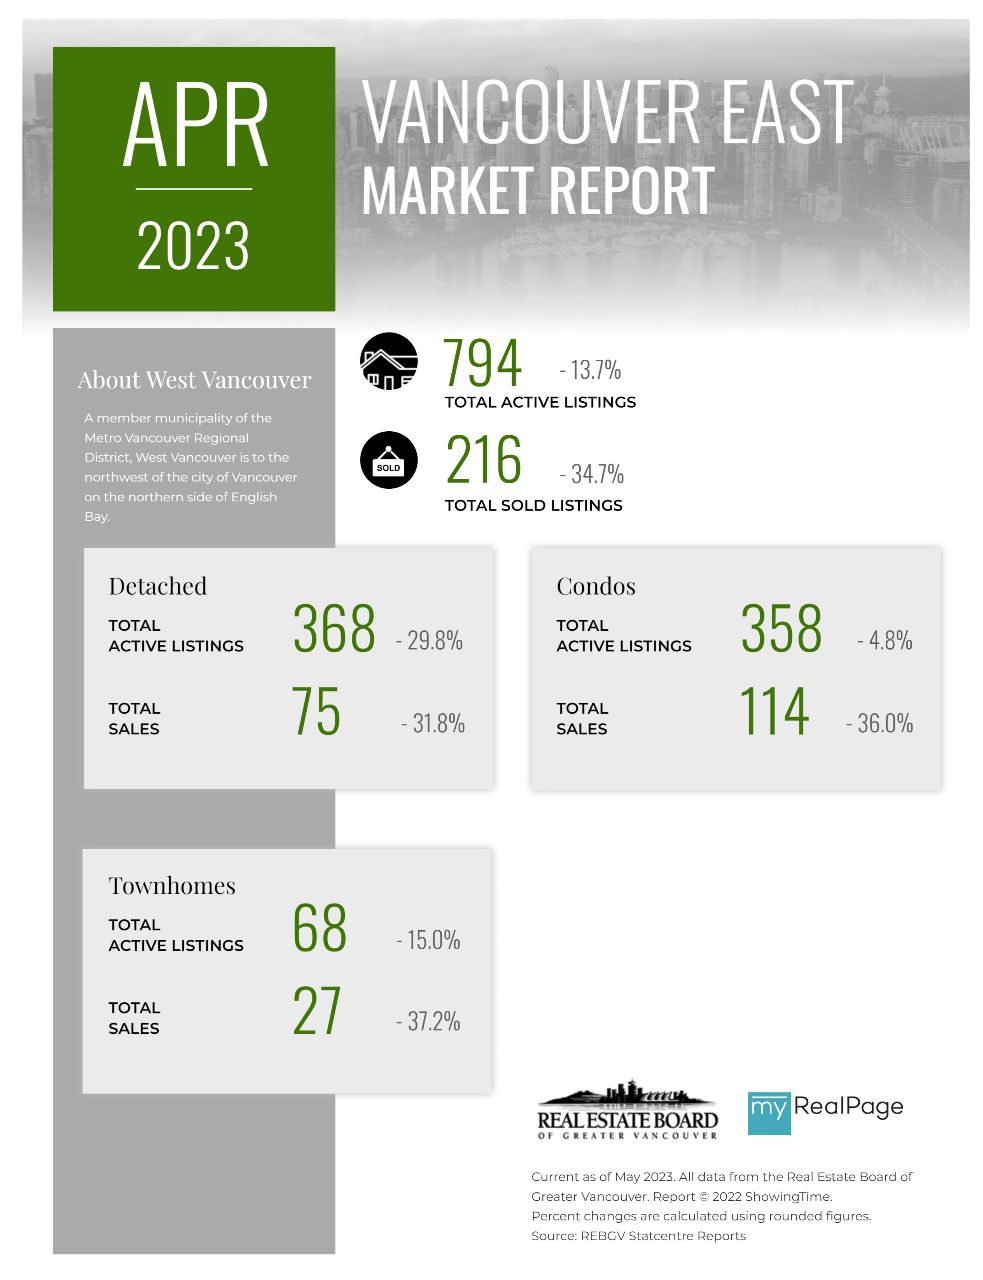
Printable Version – REBGV April 2023 Data Infographics Report Vancouver East
Printable Version – REBGV April 2023 Data Infographic Report Maple Ridge
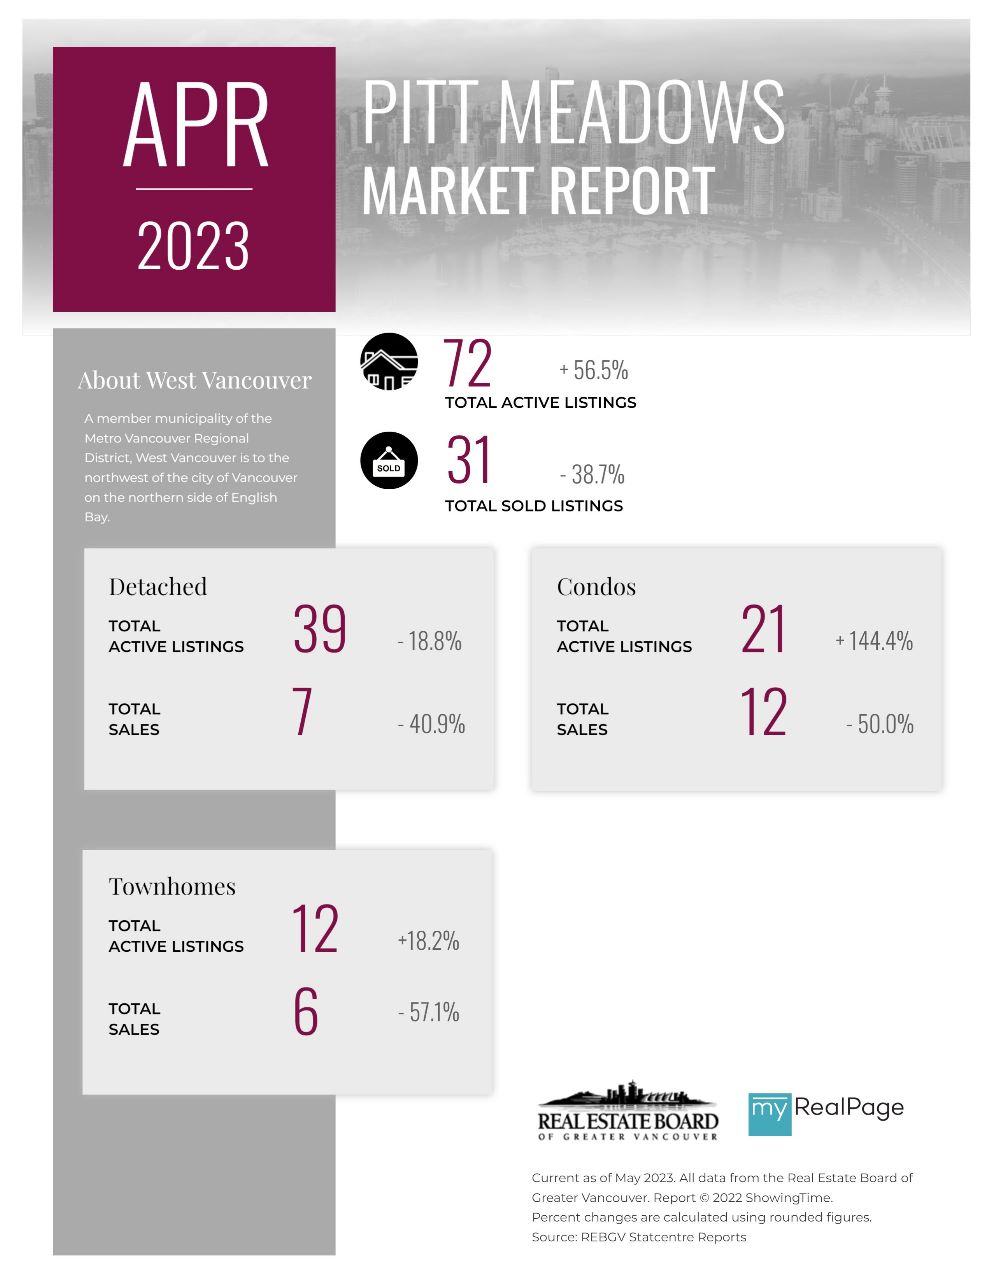
Printable Version – REBGV April 2023 Data Infographics Report Pitt Meadows
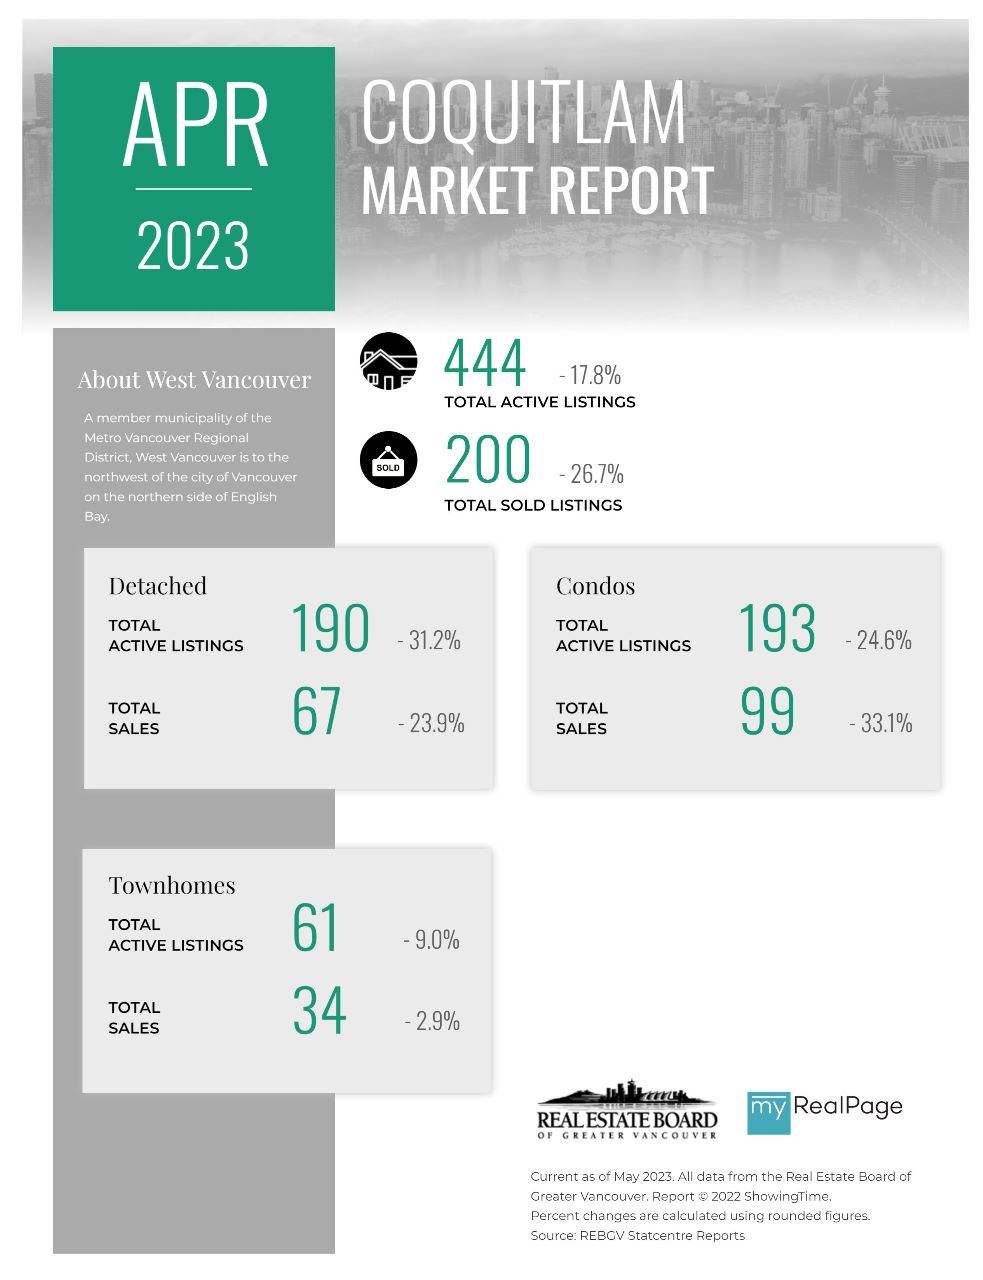
Printable Version – REBGV April 2023 Data Infographics Report Coquitlam
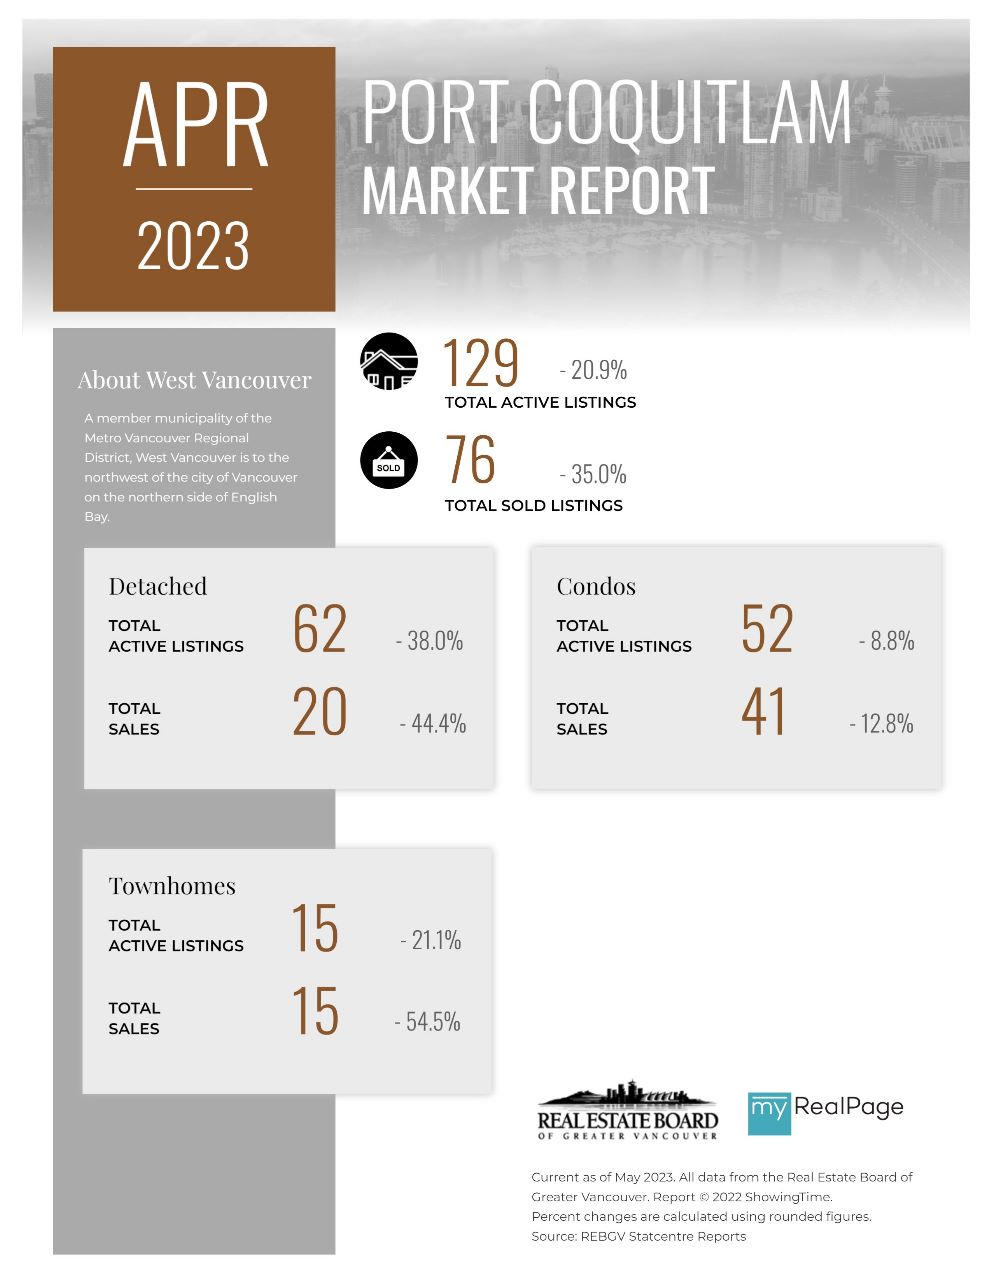
Printable Version – REBGV April 2023 Data Infographics Report Port Coquitlam
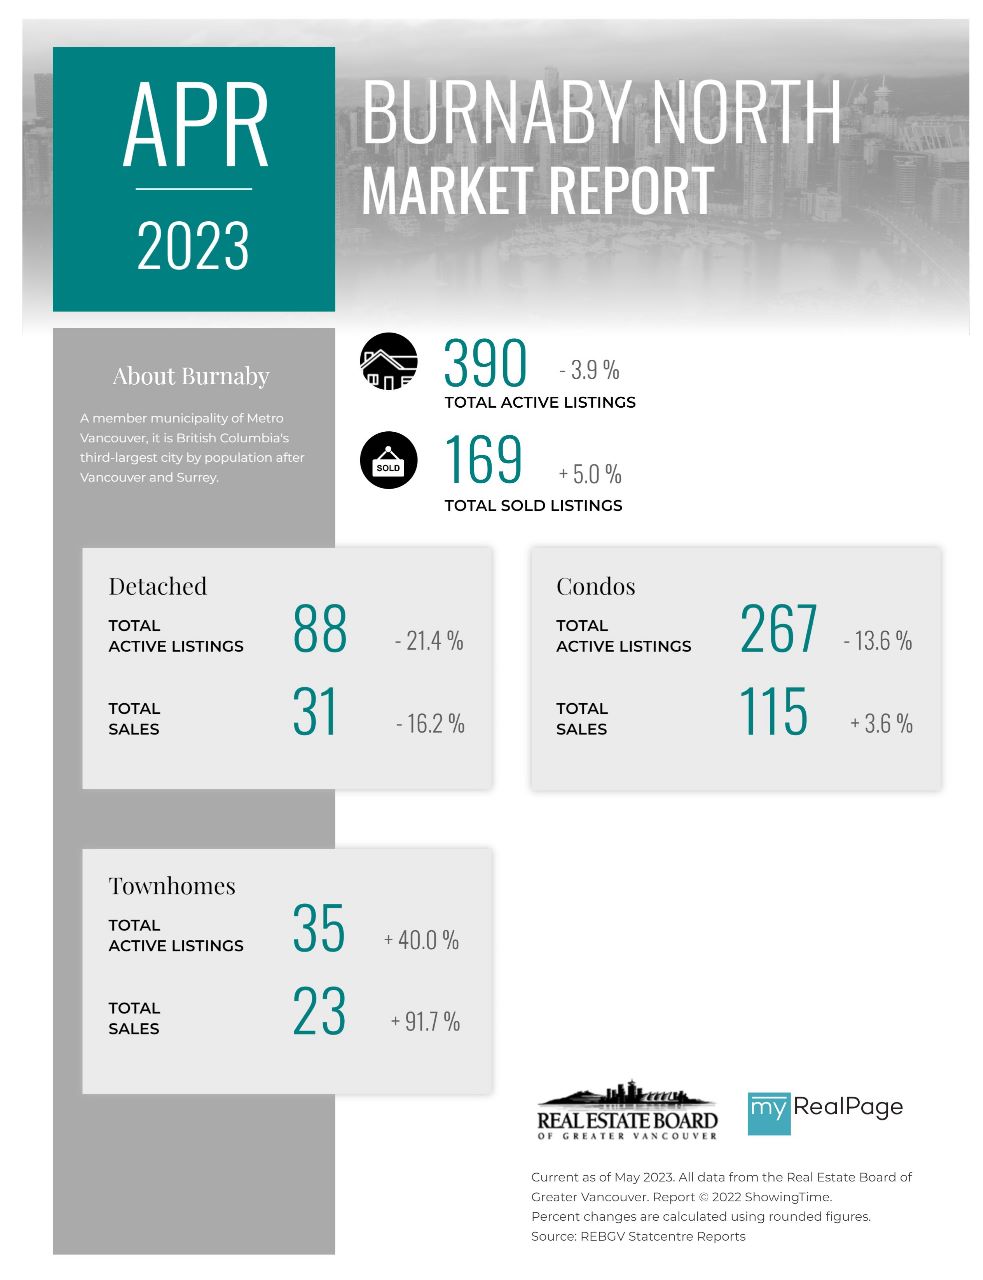
Printable Version – REBGV April 2023 Data Infographic Report Burnaby North
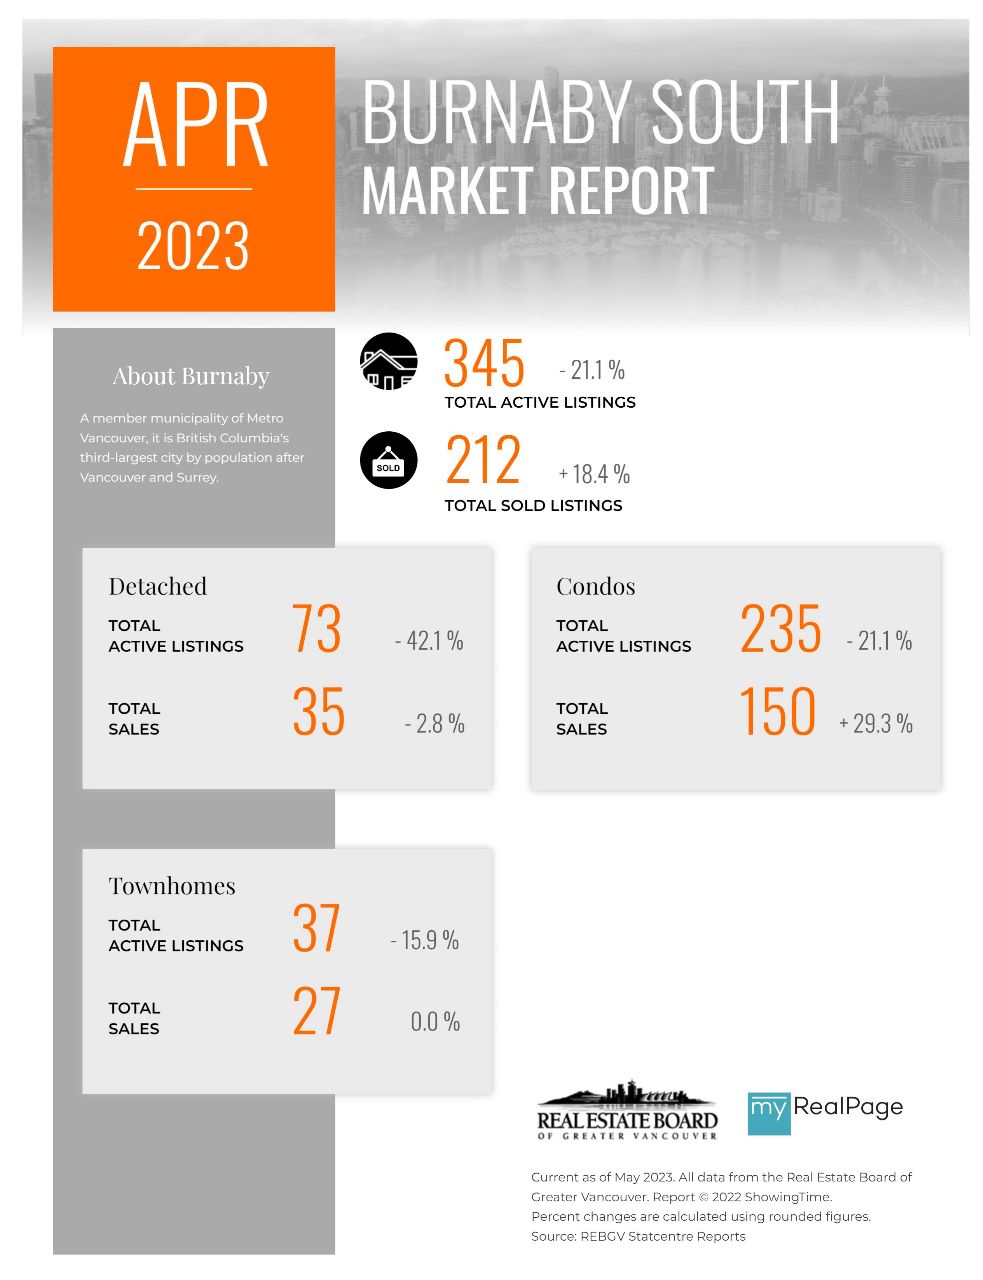
Printable Version – REBGV April 2023 Data Infographics Report Burnaby South
Printable Version – REBGV April 2023 Data Infographics Report Burnaby East
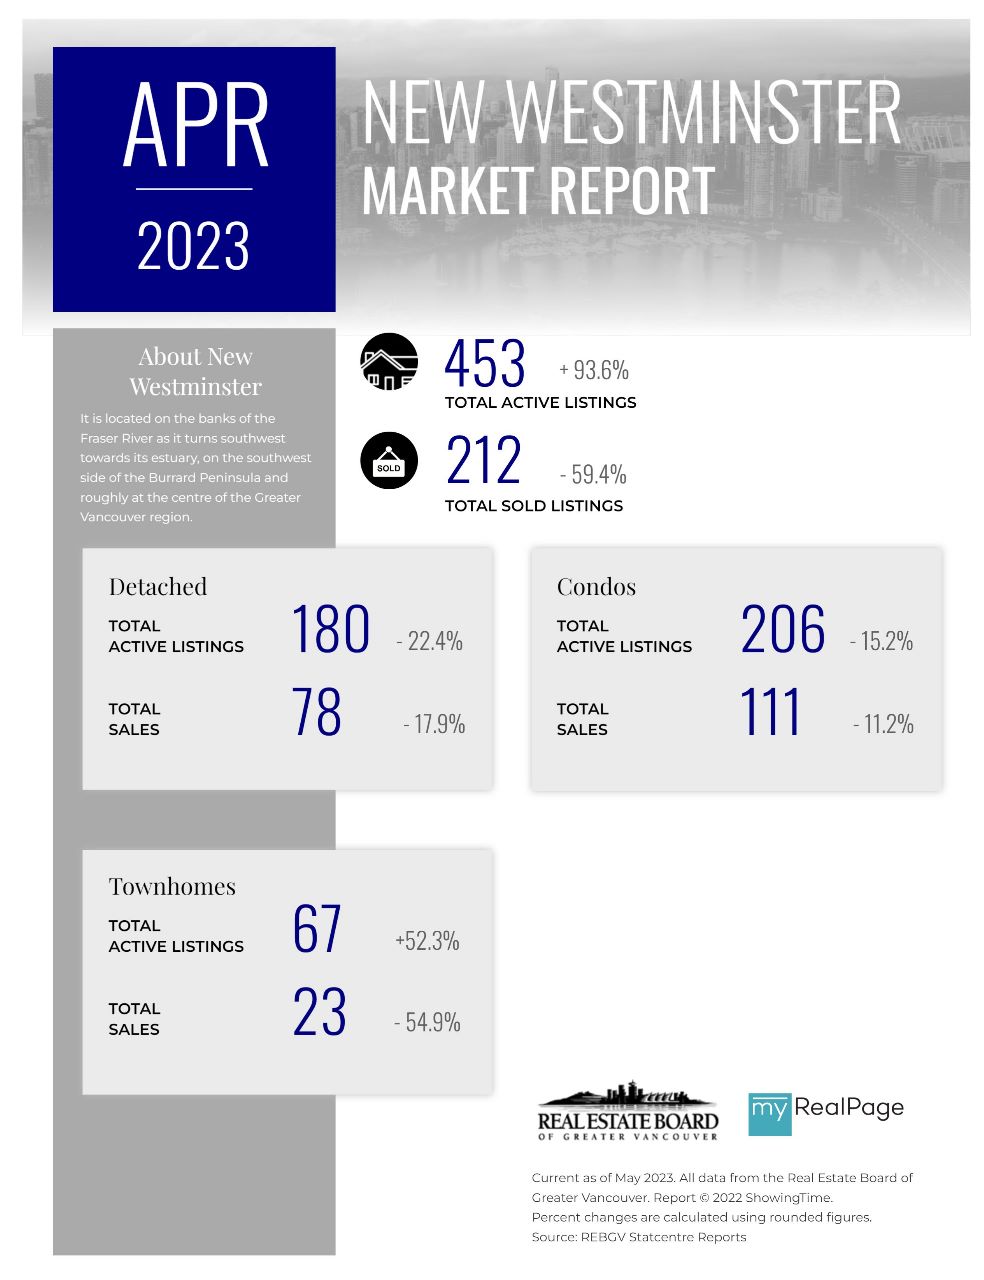
Printable Version – REBGV April 2023 Data Infographics Report New Westminster


Last Updated on May 8, 2023 by myRealPage
