INFOGRAPHICS: February 2023 FVREB Fraser Valley, South Surrey, Etc. Market Reports

Signs of stability in Fraser Valley create opportunities for home buyers and sellers
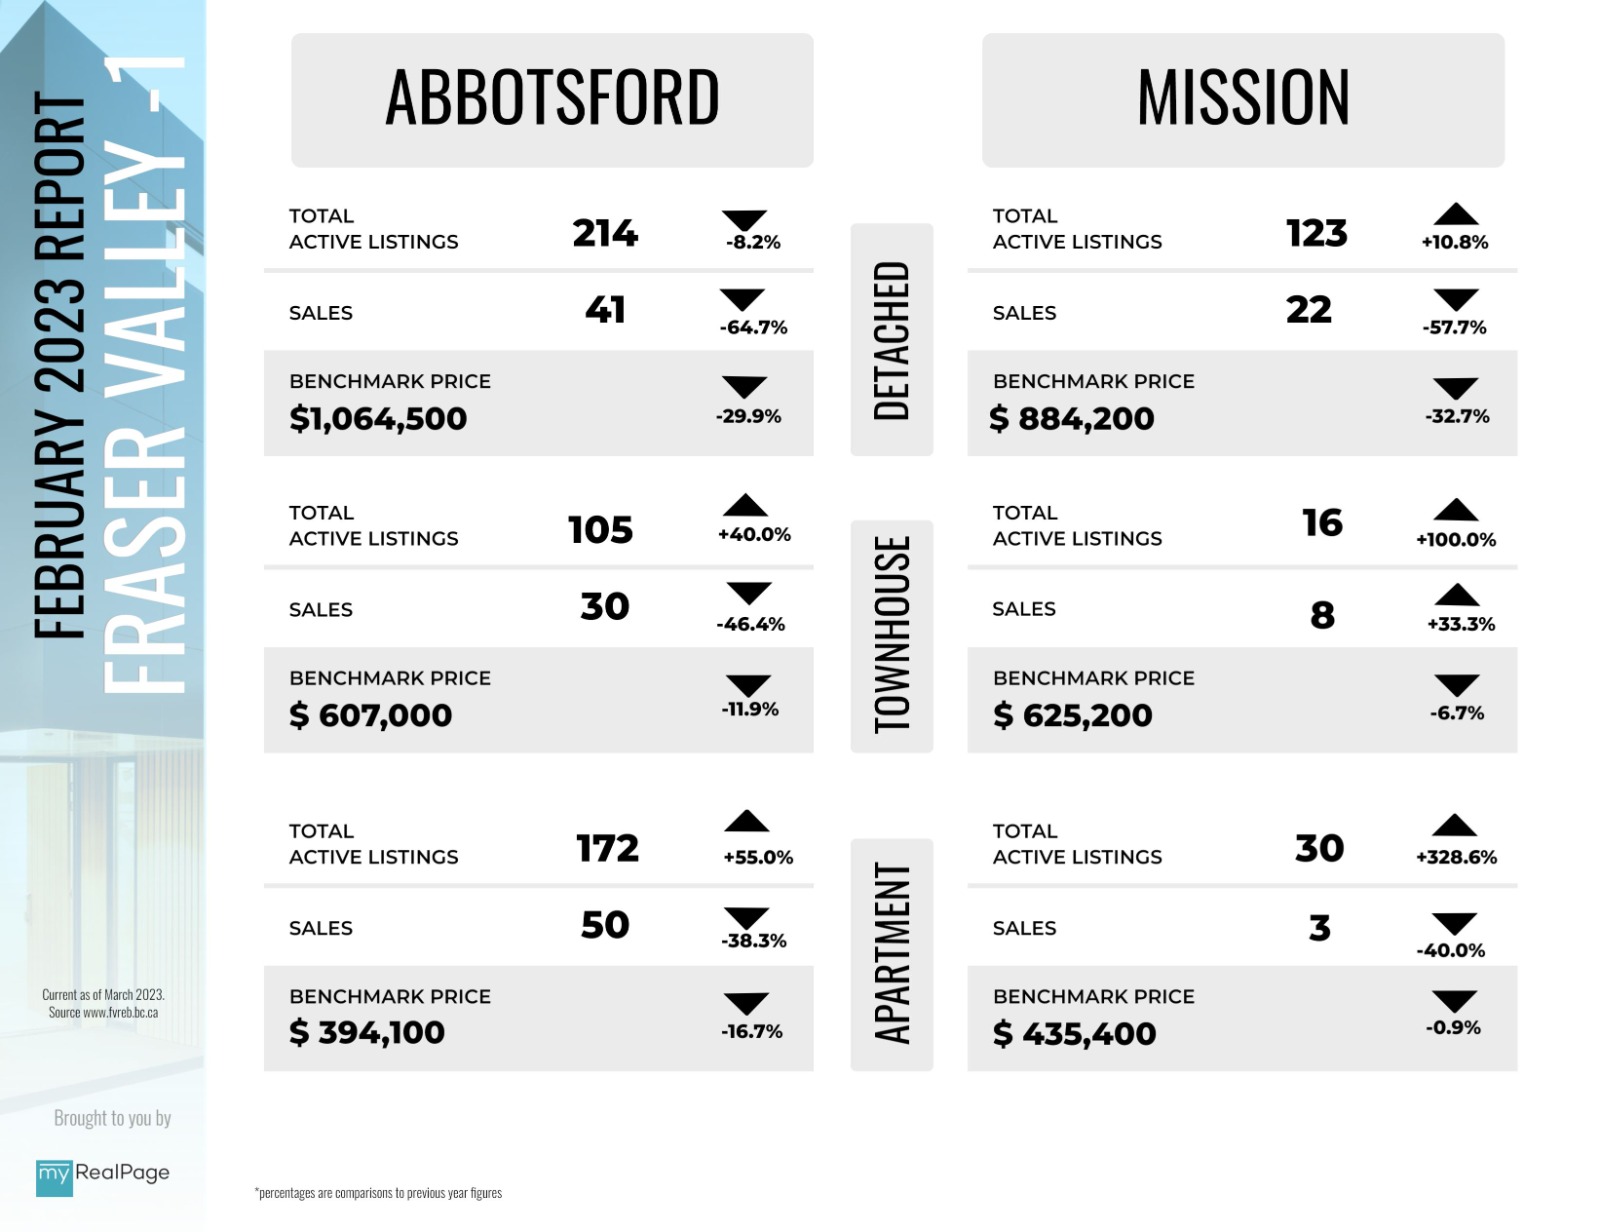
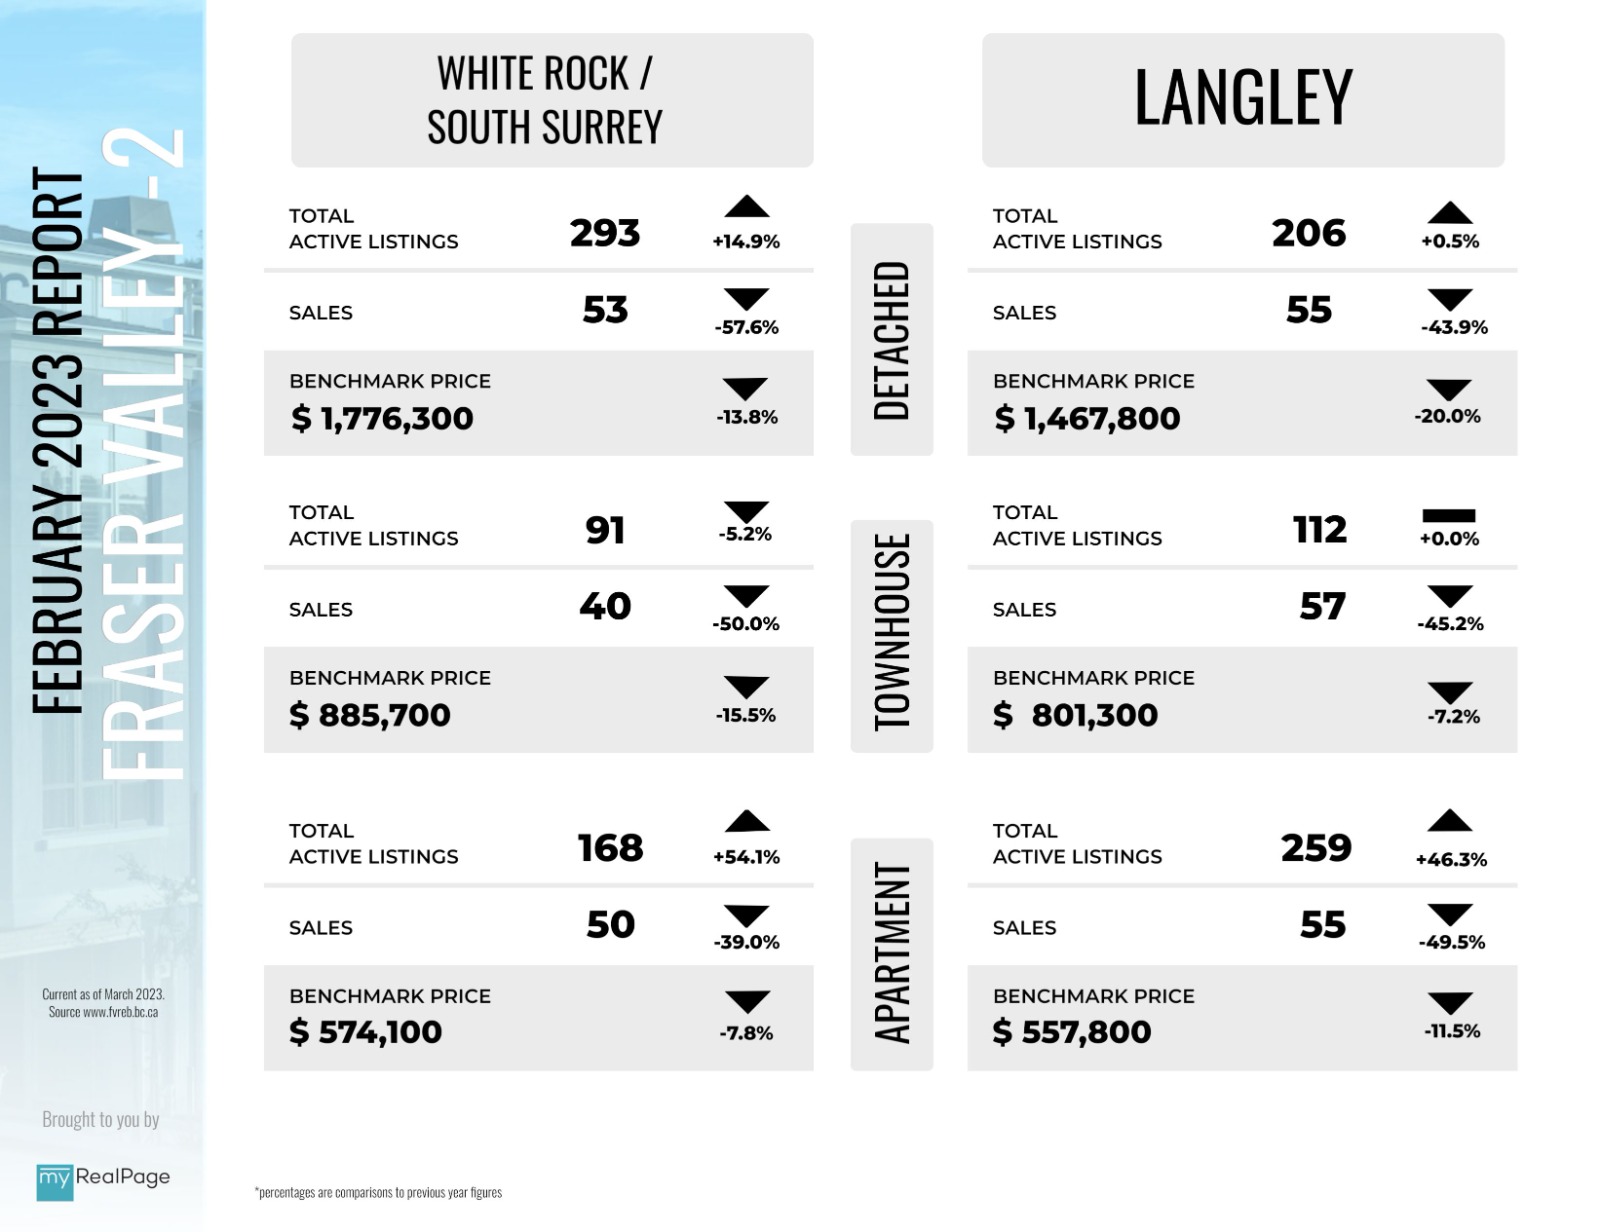
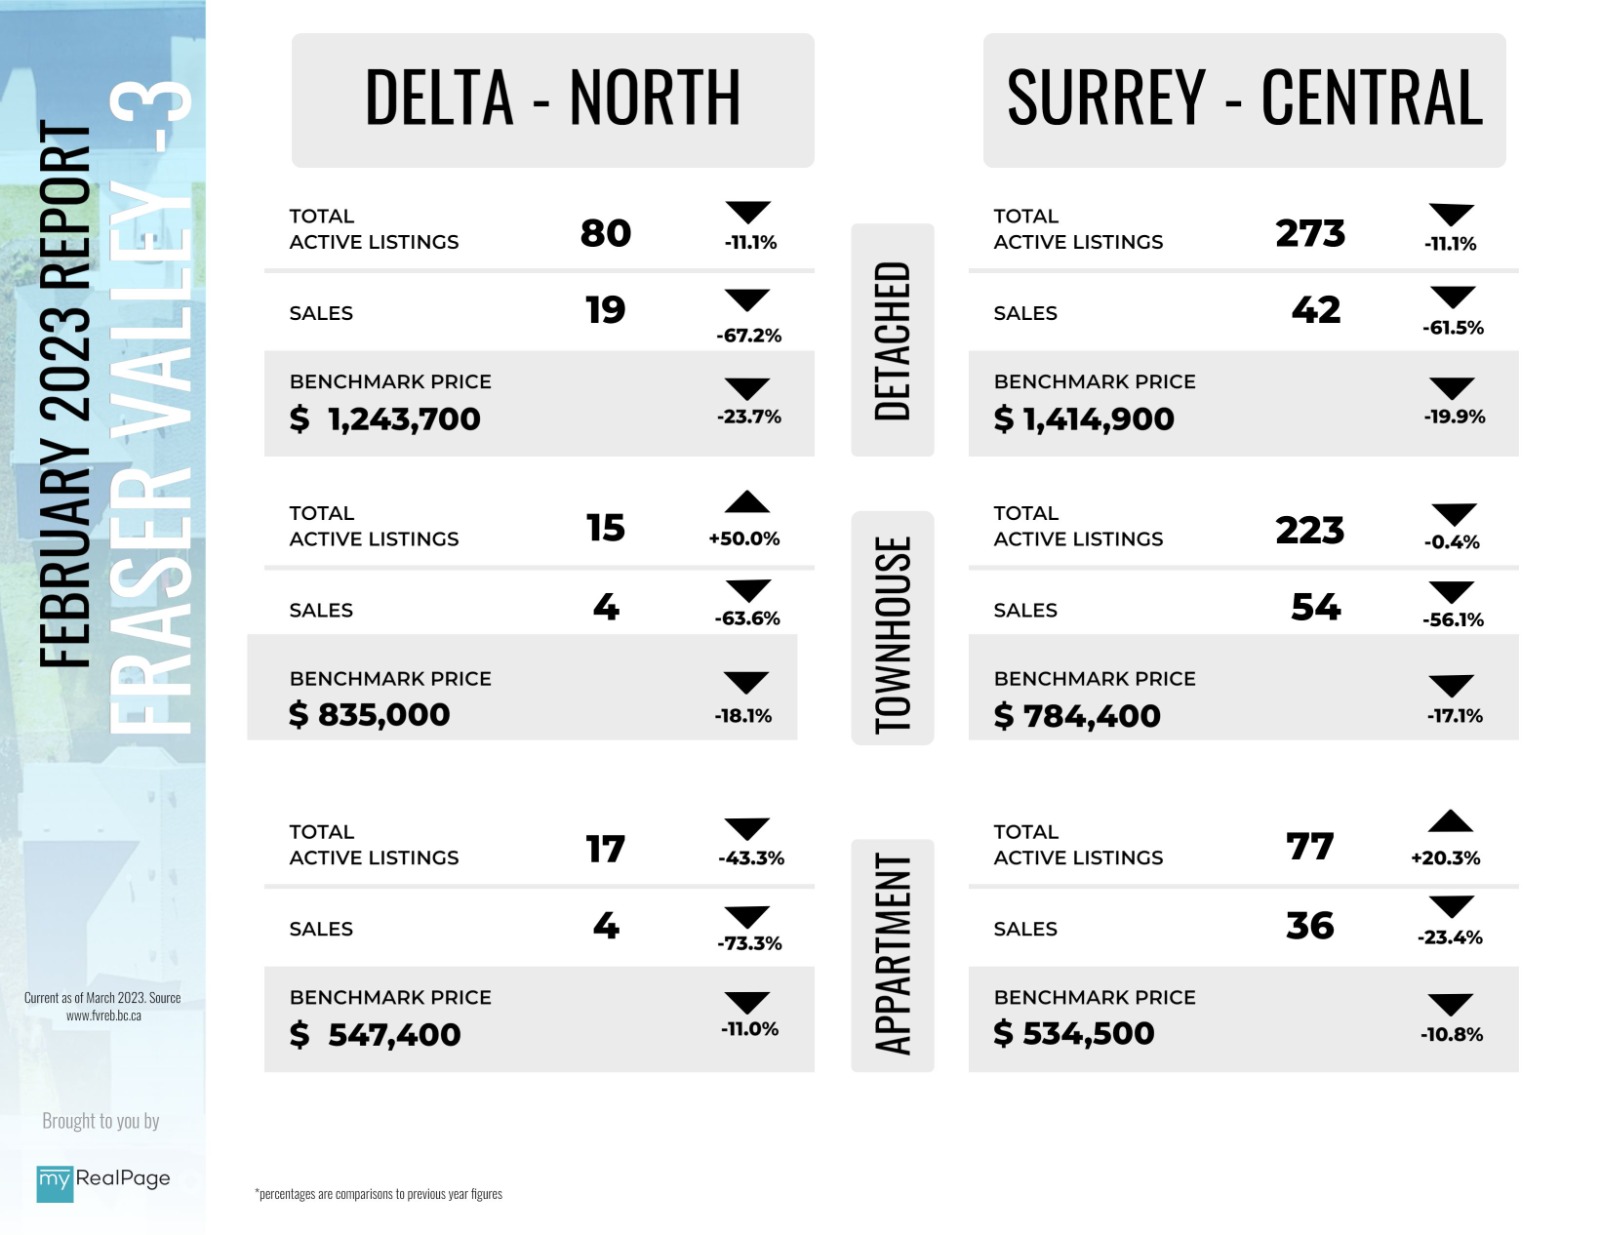
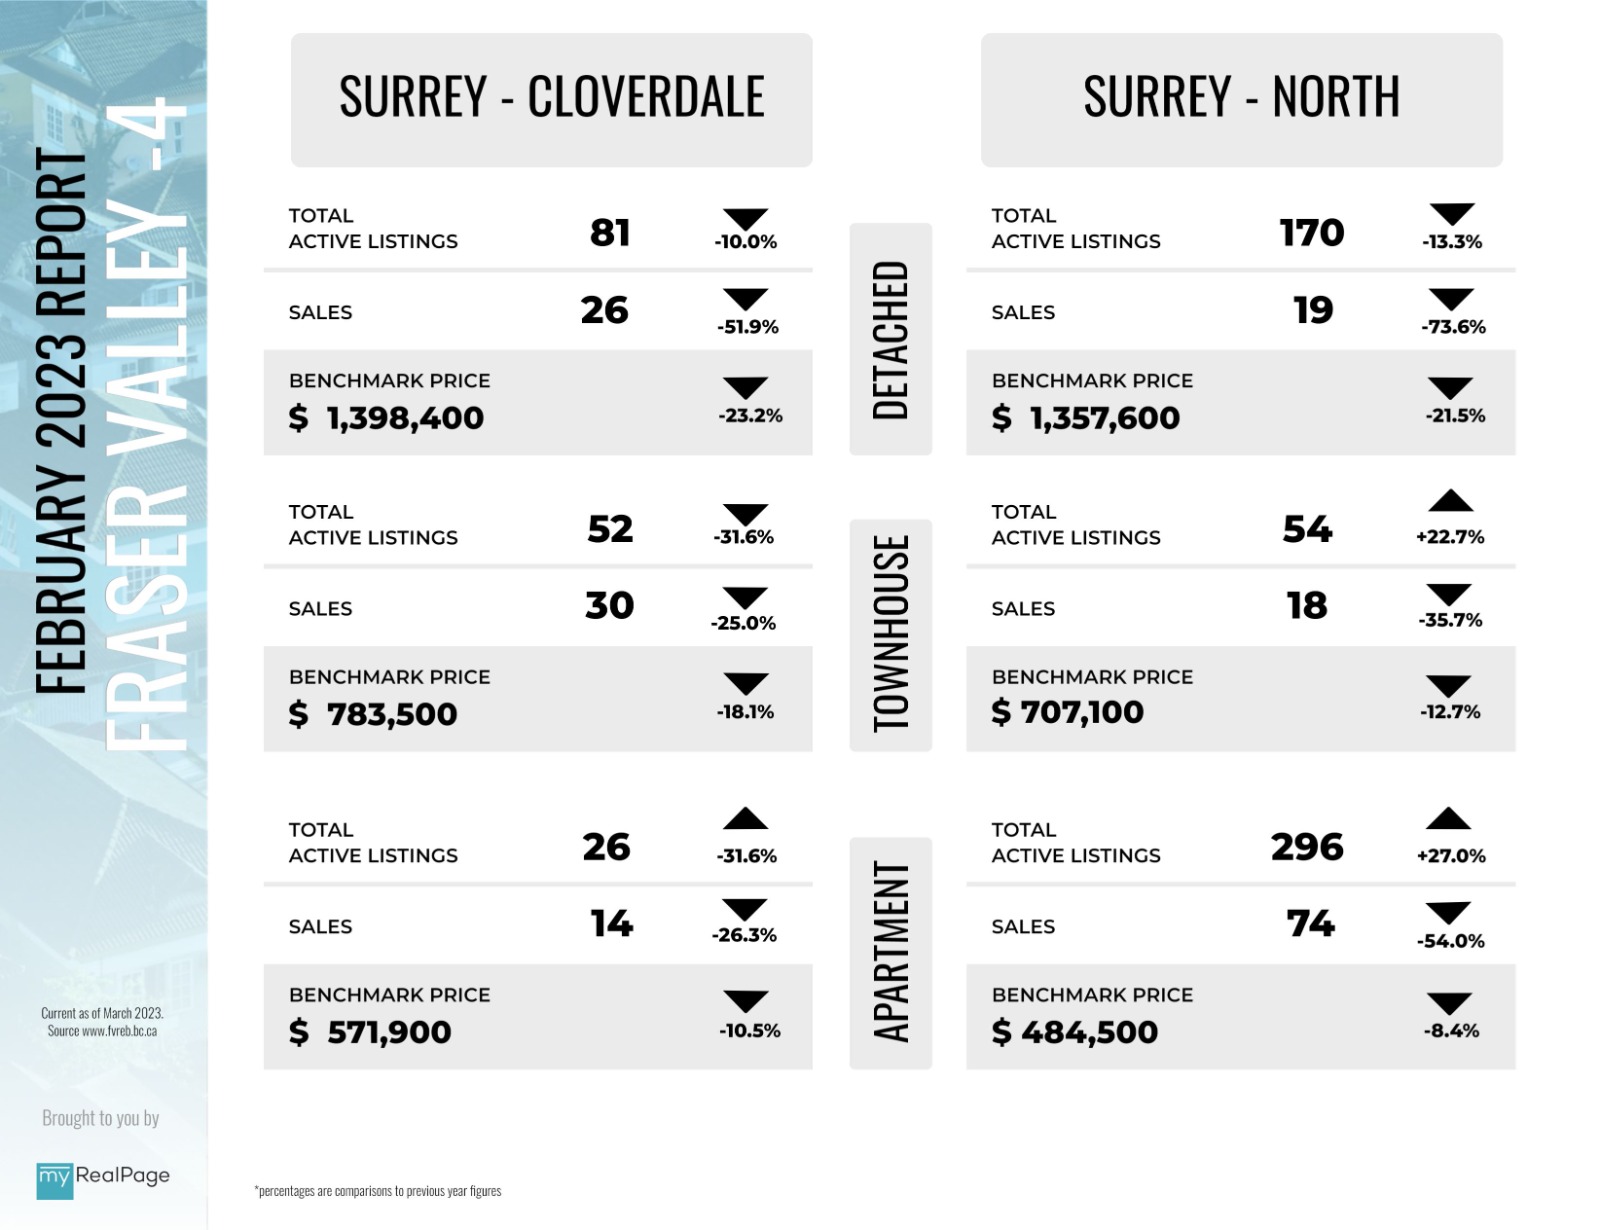
House prices in the Fraser Valley posted a slight but positive bump in February after nearly a year of month-over- month decreases. Similarly, sales, though still trending lower than normal, also recorded their first monthly gain since October.
The Fraser Valley Real Estate Board (FVREB) processed 898 sales on its Multiple Listing Service® in February, an increase of 43.5 per cent over January but still only half as many as were recorded a year ago.
February new listings were also up, by 5.7 per cent over last month to 1,938 but 48.2 per cent lower than this time last year. Active listings grew by 7.0 per cent over January and by 16.3 per cent over February 2022.
Read the full report on the FVREB website!
The following data is a comparison between February 2023 and February 2022 numbers, and is current as of March 2023. For last month’s report, check out our previous infographic!
Or follow this link for all our FVREB Infographics!
These infographics cover current trends in Fraser Valley neighbourhoods that are within the FVREB. Click on the images for a larger view!
Download Printable Version – FVREB February 2023 Market Report 1
Download Printable Version – FVREB February 2023 Market Report 2
Download Printable Version – FVREB February 2023 Market Report 3
Download Printable Version – FVREB February 2023 Market Report 4
Last Updated on March 6, 2023 by myRealPage
